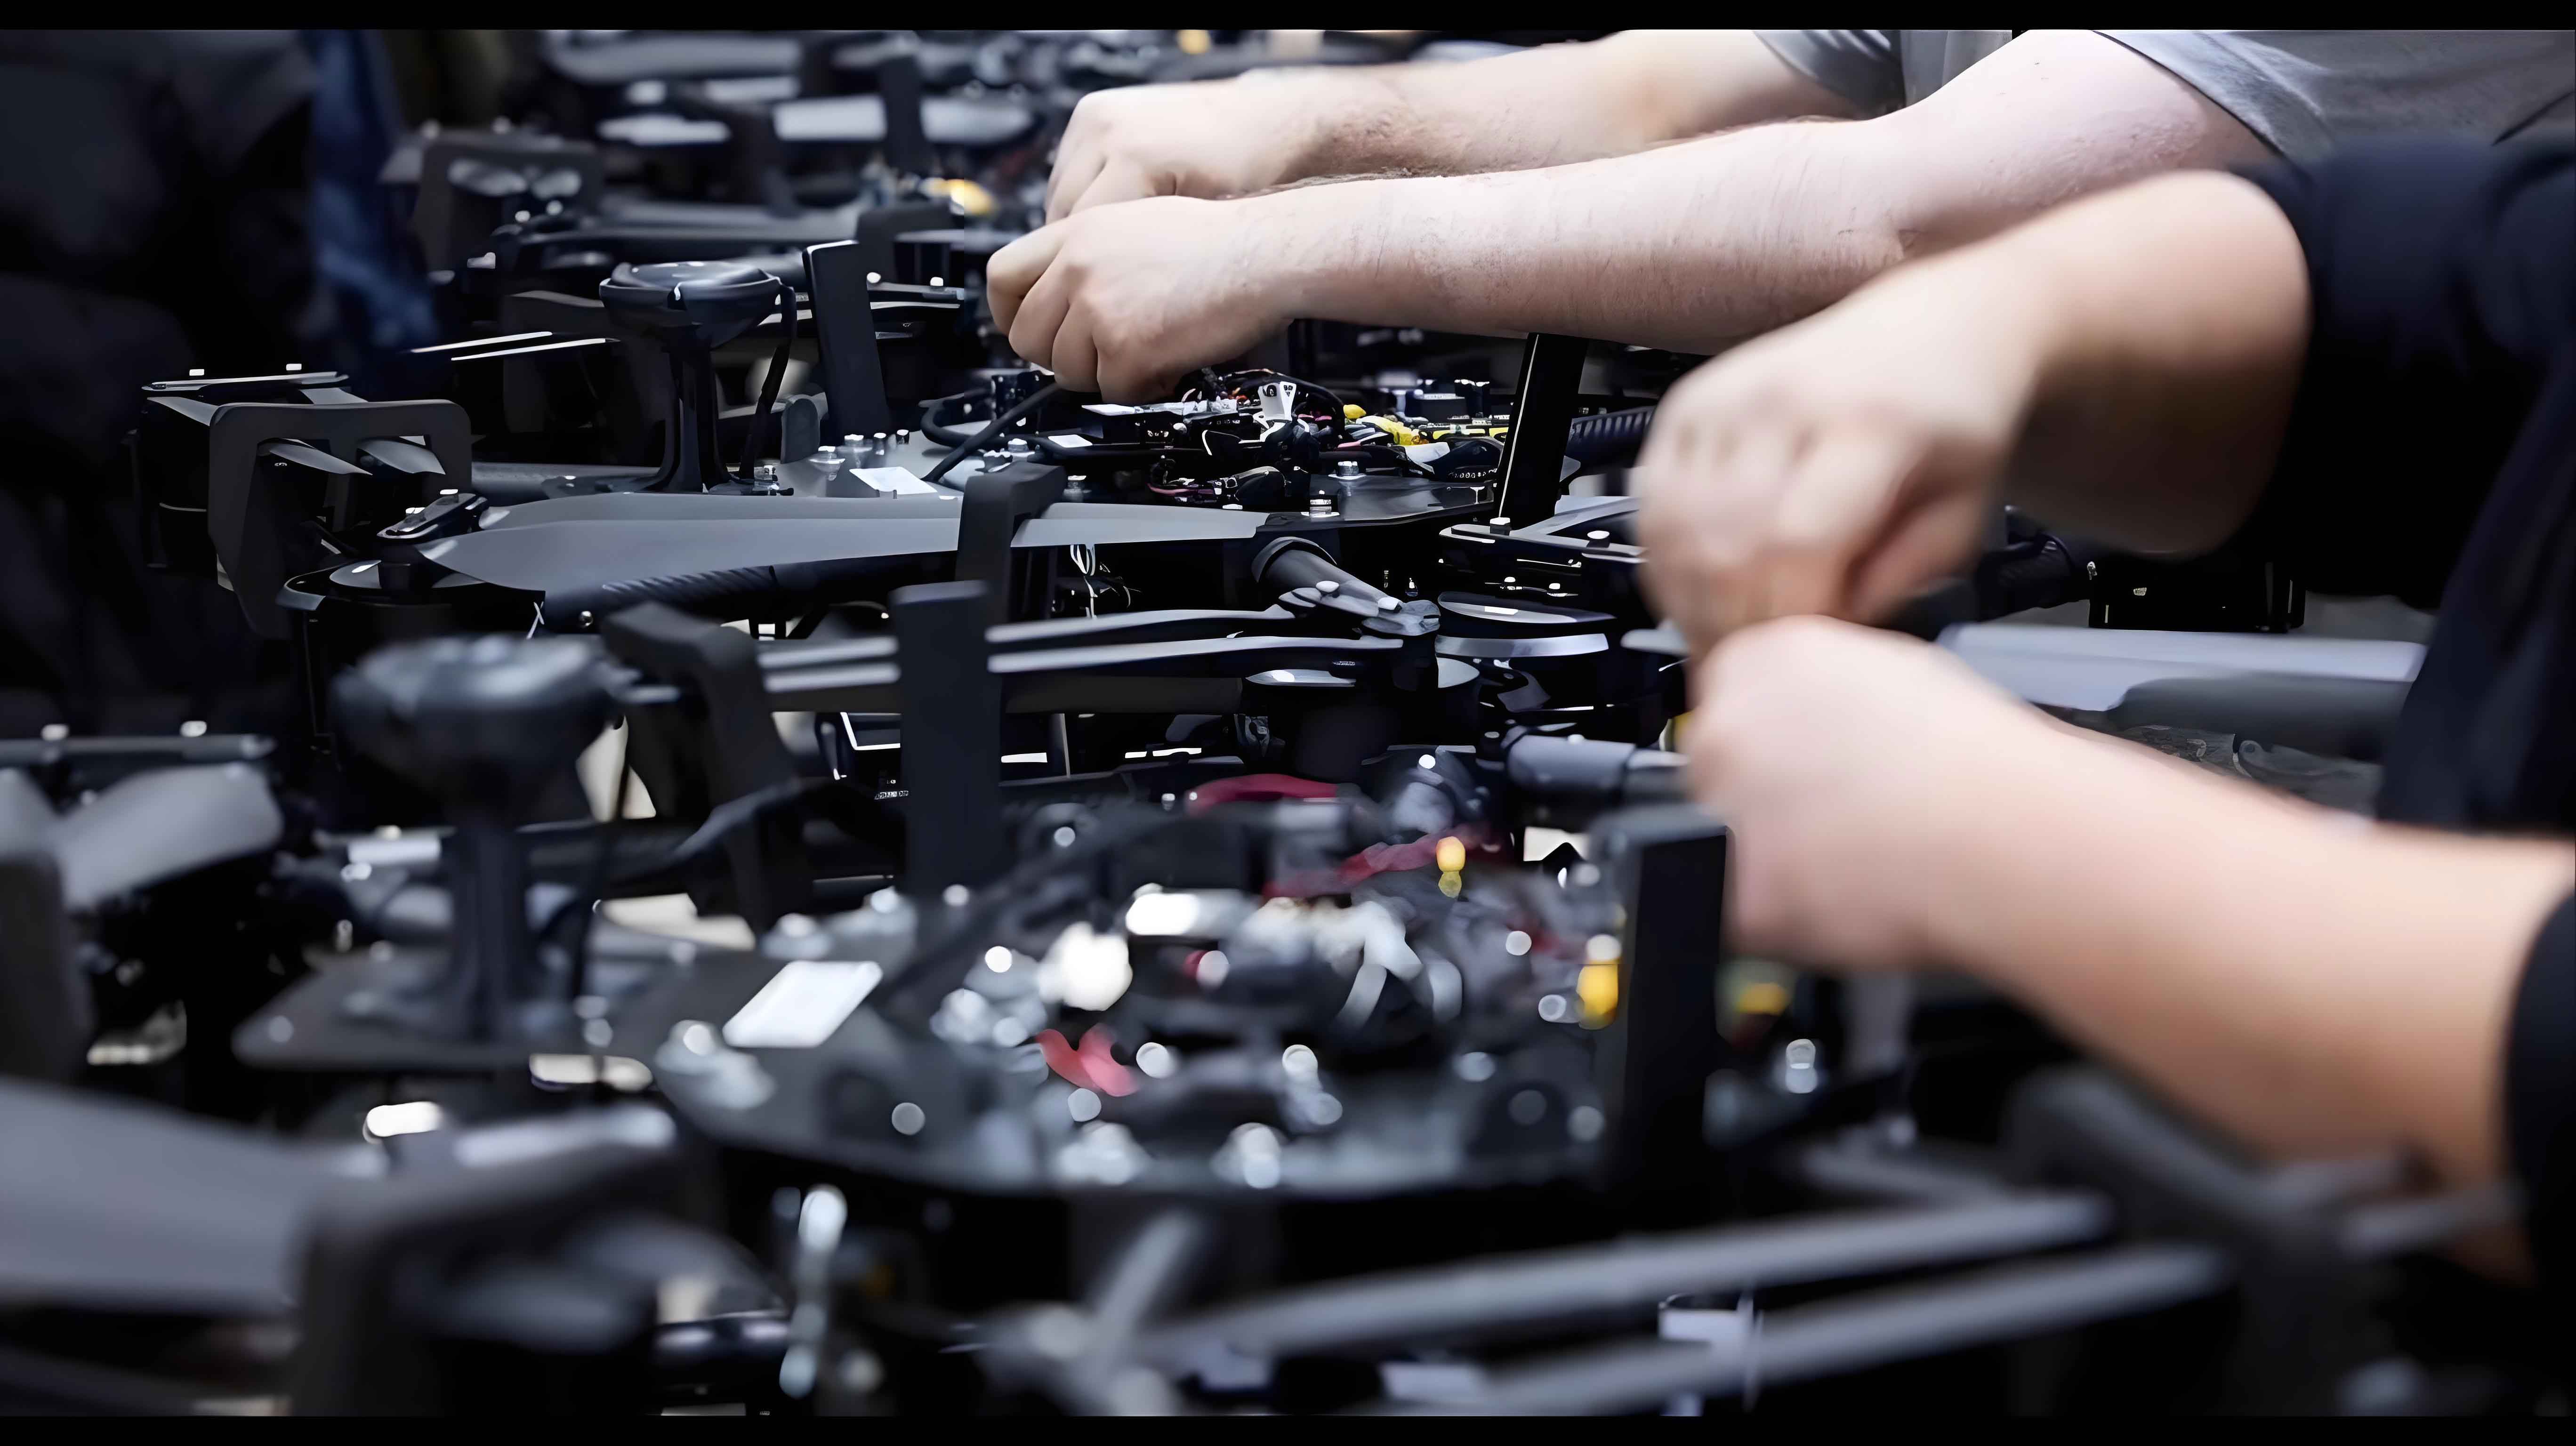
Aerodynamic shape is critical for drone performance, as it generates lift and stabilizes flight attitudes. Any deviations in manufacturing can compromise efficiency or safety, making assessment essential. However, traditional methods like key dimension measurements fail to capture full geometric inaccuracies or quantify aerodynamic impacts. We propose an integrated approach using digital photogrammetry and computational fluid dynamics (CFD) to evaluate these deviations. This method enables drone manufacturers to identify flaws early, ensuring compliance with design specifications and minimizing risks in operational scenarios.
Our assessment workflow comprises four core phases: geometric data acquisition via photogrammetry, deviation analysis, reverse modeling, and CFD-based aerodynamic evaluation. Initially, we position the drone horizontally and employ a digital photogrammetric system to capture high-accuracy point cloud data (precision <1 mm). This system uses multiple calibrated cameras to record surface points, generating a dense dataset for the wings, canards, and vertical tails—key aerodynamic surfaces. For instance, during measurements, we ensure consistent lighting and marker placement to reduce errors. The point cloud is then aligned with the theoretical CAD model using the nose as a reference point, minimizing coordinate system mismatches. We compute deviations across all surfaces, creating statistical distributions to highlight manufacturing inconsistencies. Based on this, we reconstruct a 3D model using NURBS surfaces in reverse engineering software. Finally, we perform CFD simulations on both theoretical and manufactured shapes, validating against wind tunnel data to quantify aerodynamic impacts. This holistic process allows drone manufacturers to address deviations proactively, enhancing product reliability.

Digital photogrammetry provides a non-contact, high-resolution solution for capturing drone geometries. We use a multi-camera setup to photograph the drone from various angles, processing images with triangulation algorithms to generate point clouds. The accuracy is critical; for example, a deviation of ±1 mm can be detected across curved surfaces like wing airfoils. To ensure reliability, we repeat measurements under controlled environmental conditions. After acquisition, we register the point cloud to the theoretical model via rigid transformation:
$$
\begin{bmatrix}
x’ \\ y’ \\ z’
\end{bmatrix} = \mathbf{R} \begin{bmatrix}
x \\ y \\ z
\end{bmatrix} + \mathbf{t}
$$
where \(\mathbf{R}\) is the rotation matrix and \(\mathbf{t}\) the translation vector, minimizing residual errors. Deviation analysis reveals asymmetric flaws, such as wing warping, which are common in drone manufacturing due to material stresses. We categorize deviations into bins (e.g., 0–5 mm, 5–10 mm) and compute their prevalence. For example, a typical distribution might show:
| Deviation Range (mm) | Percentage of Total Surface Area (%) | Primary Affected Components |
|---|---|---|
| 0–2 | 15 | Fuselage, Tail Base |
| 2–5 | 65 | Wings, Canards |
| 5–10 | 15 | Wing Tips, Leading Edges |
| >10 | 5 | Asymmetric Wing Sections |
This table summarizes data from multiple drone assessments, showing that deviations often concentrate on lift-generating surfaces, potentially altering airflow. For instance, cross-sectional comparisons at specific spans (e.g., z=400 mm for canards) reveal airfoil distortions up to 25 mm, attributable to tooling errors in drone manufacturing. Such insights help drone manufacturers refine quality control.
Reverse modeling converts point clouds into watertight 3D geometries using NURBS surfaces, defined as:
$$
\mathbf{C}(u) = \frac{\sum_{i=0}^{n} N_{i,p}(u) w_i \mathbf{P}_i}{\sum_{i=0}^{n} N_{i,p}(u) w_i}
$$
where \(\mathbf{P}_i\) are control points, \(w_i\) weights, and \(N_{i,p}\) basis functions. We optimize continuity (e.g., C2 continuity) to ensure smooth surfaces for CFD meshing. This step is vital for drone manufacturers, as it translates raw data into analyzable models without CAD assumptions.
CFD analysis evaluates aerodynamic impacts by simulating flow conditions. We generate structured O-H grids with ~10 million cells using ICEM, refining boundary layers to resolve viscous effects. The grid independence is verified by doubling cells until force coefficients vary by <1%. Governing equations include the compressible Navier-Stokes equations:
$$
\frac{\partial \rho}{\partial t} + \nabla \cdot (\rho \mathbf{v}) = 0
$$
$$
\frac{\partial (\rho \mathbf{v})}{\partial t} + \nabla \cdot (\rho \mathbf{v} \mathbf{v}) = -\nabla p + \nabla \cdot \mathbf{\tau}
$$
$$
\frac{\partial (\rho E)}{\partial t} + \nabla \cdot (\mathbf{v} (\rho E + p)) = \nabla \cdot (k \nabla T) + \nabla \cdot (\mathbf{\tau} \cdot \mathbf{v})
$$
where \(\rho\) is density, \(\mathbf{v}\) velocity, \(p\) pressure, \(\mathbf{\tau}\) stress tensor, \(E\) total energy, \(k\) thermal conductivity, and \(T\) temperature. We use Fluent with the Spalart-Allmaras turbulence model, pressure-far-field conditions, and no-slip adiabatic walls. Simulations run at 50 m/s, 0 km altitude, for angles of attack (AoA) from −4° to 8°. Validation against wind tunnel data involves tuning discretization schemes (e.g., second-order upwind) until CFD-theoretical matches within 2%. Applying this validated setup to the manufactured model, we compute forces and moments. Results show significant deviations:
| Aerodynamic Parameter | Theoretical Value (AoA=2°) | Manufactured Value (AoA=2°) | Deviation (%) |
|---|---|---|---|
| Lift Coefficient (\(C_L\)) | 0.42 | 0.37 | -12 |
| Drag Coefficient (\(C_D\)) | 0.031 | 0.034 | +10 |
| Lift-to-Drag Ratio (\(L/D\)) | 13.5 | 10.9 | -19 |
| Pitching Moment (\(C_m\)) | -0.05 | -0.03 | +40 (shift) |
| Roll Moment (\(C_l\)) | 0.00 | 0.02 | Asymmetric |
Notably, \(C_L\) drops by 12% at low AoA due to airfoil thickening, increasing stall risks. The \(L/D\) reduction implies higher energy consumption, affecting endurance. A positive \(C_m\) shift necessitates elevator trim adjustments (~1° AoA change), while asymmetric roll moments (e.g., \(C_l = 0.02\)) require aileron presets for balance. These issues stem from inconsistent wing fabrication, a common challenge in drone manufacturing. We further assess performance metrics like takeoff distance (\(s_{TO}\)):
$$
s_{TO} \propto \frac{1}{C_L^{3/2}} \quad \Rightarrow \quad \Delta s_{TO} \approx 15\% \text{ increase}
$$
highlighting operational penalties. Such quantitative outputs enable drone manufacturers to prioritize corrections, such as retooling asymmetric components.
In conclusion, our method quantifies aerodynamic deviations in drone manufacturing using photogrammetry and CFD, revealing impacts like lift loss and moment imbalances. By providing statistical geometric data and force comparisons, it helps drone manufacturers enhance quality assurance and reduce flight risks. Future work will integrate real-time scanning for in-line production checks, further supporting drone manufacturers in achieving precision.
