
The strategic importance of rapid, reliable logistics support to remote island outposts cannot be overstated. Traditional methods face significant challenges due to geographical isolation and complex maritime environments. In this context, civilian UAV technology presents a transformative opportunity for military logistics applications. The global market offers a diverse range of industry-grade civilian UAV models with substantial payload capacities suitable for such missions. Selecting the most efficient platform from this vast array necessitates a robust and transparent evaluation methodology that goes beyond simple performance comparisons.
Classical evaluation approaches, such as expert judgment, mathematical modeling, simulation, and machine learning, each have inherent limitations when applied to this multi-criteria decision problem involving complex internal trade-offs. Data Envelopment Analysis (DEA) offers a non-parametric, data-driven alternative for evaluating the relative efficiency of homogeneous Decision-Making Units (DMUs). However, conventional DEA models treat each civilian UAV as a “black box,” aggregating all inputs and outputs into a single efficiency score. This fails to account for the internal structural relationships between different capability components, such as a drone’s inherent flight performance versus its ability to withstand harsh operational environments. This lack of granularity often results in numerous DMUs being rated as efficient, providing little discriminatory power for decision-makers.
To address this gap, we propose a novel evaluation framework based on an enhanced Super-Efficiency Parallel Network DEA model. This research introduces a structured approach to assess the island transport efficiency of various civilian UAV models. First, we decompose the holistic transport capability into two parallel, interrelated sub-processes: Flight Platform Base Capability and Mission Environment Adaptation Capability. We then construct a corresponding指标体系, distinguishing between shared and exclusive input resources. A critical innovation is the refinement of shared-input allocation proportions between the parallel sub-processes. Finally, we integrate the super-efficiency concept into the parallel network structure to achieve a full ranking of all civilian UAV models, including those deemed efficient by standard models. This provides a more nuanced, interpretable, and discriminatory assessment for military selection processes.
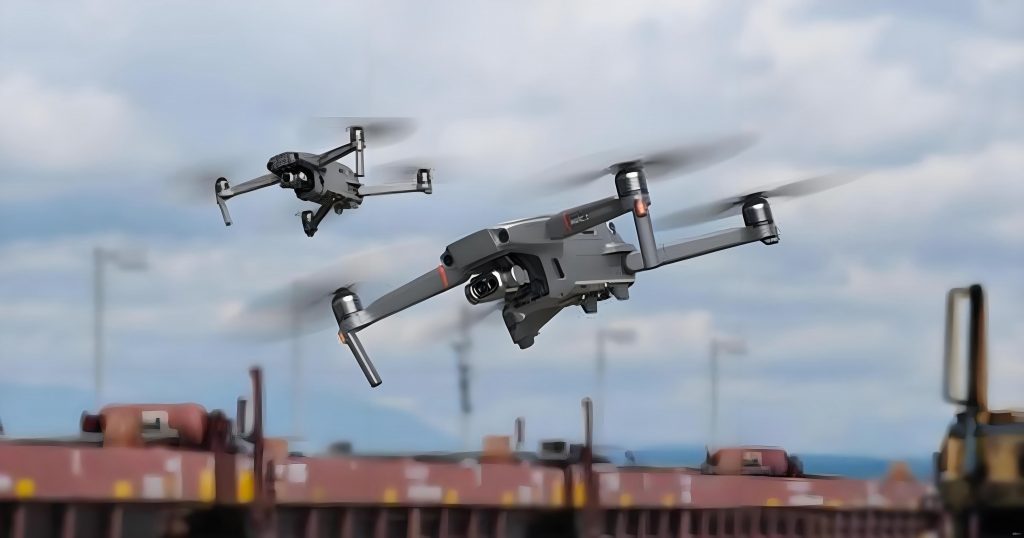
Methodological Framework for Efficiency Evaluation
1. Capability Decomposition and Indicator System
The efficacy of a civilian UAV for island transport is not a monolithic attribute but a synthesis of distinct yet parallel competencies. We model it as a system with two primary sub-processes operating concurrently:
- Sub-process 1 (Flight Platform Base Capability): This represents the fundamental aerial vehicle performance, focused on the core task of moving mass over distance. It consumes resources related to the physical platform and basic operation.
- Sub-process 2 (Mission Environment Adaptation Capability): This represents the system’s robustness and reliability in the specific challenging island and maritime theater. It consumes resources related to hardening, protection, and specialized systems for environmental survival.
Some input resources (e.g., procurement cost, maintenance investment) are shared between these sub-processes, as they contribute to both base performance and environmental hardening. The allocation of these shared inputs is not inherently fixed. We introduce allocation parameters $\alpha$ and $\beta$ (where $0 < \alpha, \beta < 1$) to denote the proportion of shared inputs assigned to Sub-process 1, with the remainder $(1-\alpha)$ and $(1-\beta)$ allocated to Sub-process 2. This allows the model to flexibly reflect different resource utilization strategies inherent in different civilian UAV designs.
Based on this decomposition, we construct a quantitative indicator system. Inputs represent the costs or resources consumed, while outputs represent the desired capabilities or performance achieved. The specific indicators for our island transport scenario are defined as follows:
| Variable Type | Indicator | Definition & Unit |
|---|---|---|
| Input Variables | $I_1$: Deployable Quantity | Inverse of footprint area on a ship deck. Unit: m². |
| $I_2$: Maintenance Input | Average maintenance cost per 100 km of flight. Unit: CNY. | |
| $I_3$: Procurement Cost | Market price of the civilian UAV. Unit: 10k CNY. | |
| $I_4$: Repair Input | Average repair cost, calculated as (Faults per 100km) × (Average Repair Cost). Unit: CNY. | |
| Output Variables | $O_1$: Endurance | Maximum flight time with full payload. Unit: hour. |
| $O_2$: Payload Capacity | Maximum cargo mass. Unit: kg. | |
| $O_3$: Cruise Speed | Sustained operational speed. Unit: km/h. | |
| $O_4$: Operational Radius | Maximum effective delivery distance. Unit: km. | |
| $O_5$: Salt Spray Resistance | Corrosion resistance in maritime environment (1-10 scale). | |
| $O_6$: Wind/Rain Resistance | Operational capability in adverse weather (1-10 scale). | |
| $O_7$: EMI Resistance | Resistance to electromagnetic interference (1-10 scale). | |
| $O_8$: Delivery Accuracy Rate | Percentage of successful precision deliveries and returns. Unit: %. |
The outputs are allocated to the sub-processes based on their nature. $O_1$, $O_2$, $O_3$, and $O_4$ are assigned to Sub-process 1 (Base Capability). $O_5$, $O_6$, $O_7$, and $O_8$ are assigned to Sub-process 2 (Adaptation Capability). Inputs $I_1$ and $I_4$ are exclusive to Sub-process 1 and Sub-process 2, respectively. Inputs $I_2$ and $I_3$ are shared, with their allocation governed by parameters $\alpha$ and $\beta$.
2. Model Construction: From Classic DEA to Enhanced Parallel Network DEA
Let us consider $n$ civilian UAV models as DMUs. For DMU $j$ ($j=1,…,n$), we denote $x_{ij}$ and $y_{rj}$ as the $i$-th input and $r$-th output of the overall system. For sub-process $p$ ($p=1,2$), the corresponding vectors are $x_{ij}^{(p)}$ and $y_{rj}^{(p)}$.
Classic CCR Model: This model evaluates the overall efficiency $\theta^*$ of DMU$_0$ without considering internal structure:
$$
\begin{align*}
\theta^* = & \max \sum_{r=1}^{s} \mu_r y_{r0} \\
\text{s.t.} & \sum_{r=1}^{s} \mu_r y_{rj} – \sum_{i=1}^{m} \nu_i x_{ij} \leq 0, \quad j=1,…,n \\
& \sum_{i=1}^{m} \nu_i x_{i0} = 1 \\
& \mu_r, \nu_i \geq 0, \quad \forall r,i
\end{align*}
$$
where $\mu_r$ and $\nu_i$ are the weights for outputs and inputs, respectively.
Parallel Network DEA Model with Shared Inputs: This model opens the “black box” by incorporating constraints for each sub-process. The overall efficiency $\theta^*$ for DMU$_0$ is calculated by:
$$
\begin{align*}
\theta^* = & \max \sum_{r=1}^{s} \mu_r y_{r0} \\
\text{s.t.} & \sum_{r=1}^{s} \mu_r y_{rj} – \sum_{i=1}^{m} \nu_i x_{ij} \leq 0, \quad j=1,…,n \\
& \sum_{r=1}^{s} \mu_r y_{rj}^{(p)} – \sum_{i=1}^{m} \nu_i x_{ij}^{(p)} \leq 0, \quad \text{for } p=1,2 \text{ and } j=1,…,n \\
& \sum_{i=1}^{m} \nu_i x_{i0} = 1 \\
& \mu_r, \nu_i \geq 0, \quad \forall r,i
\end{align*}
$$
For shared inputs, we have $x_{2j}^{(1)} = \alpha x_{2j}$, $x_{2j}^{(2)} = (1-\alpha)x_{2j}$, $x_{3j}^{(1)} = \beta x_{3j}$, and $x_{3j}^{(2)} = (1-\beta)x_{3j}$. The optimal solution for sub-process efficiencies may not be unique. Therefore, after finding $\theta^*$, we calculate the efficiency interval $[ \theta_{min}^{(p)}, \theta_{max}^{(p)} ]$ for each sub-process $p$ by solving secondary linear programs that minimize and maximize the sub-process efficiency while keeping the overall efficiency at $\theta^*$.
Enhanced Super-Efficiency Parallel Network DEA Model: To fully discriminate between efficient DMUs, we integrate the super-efficiency concept. The evaluated DMU$_0$ is excluded from the reference set. The model for calculating the super-efficiency $\theta_{super}^*$ is:
$$
\begin{align*}
\theta_{super}^* = & \max \sum_{r=1}^{s} \mu_r y_{r0} \\
\text{s.t.} & \sum_{r=1}^{s} \mu_r y_{rj} – \sum_{i=1}^{m} \nu_i x_{ij} \leq 0, \quad j=1,…,n; j \neq j_0 \\
& \sum_{r=1}^{s} \mu_r y_{rj}^{(p)} – \sum_{i=1}^{m} \nu_i x_{ij}^{(p)} \leq 0, \quad \text{for } p=1,2 \text{ and } j=1,…,n; j \neq j_0 \\
& \sum_{i=1}^{m} \nu_i x_{i0} = 1 \\
& \mu_r, \nu_i \geq 0, \quad \forall r,i
\end{align*}
$$
This model can yield efficiency scores greater than 1 for DMUs that remain efficient even when compared to a frontier constructed from all other units, enabling a complete ranking.
3. Solution Strategy for Shared Allocation Parameters
The parameters $\alpha$ and $\beta$ are critical but unknown. To comprehensively assess a civilian UAV across all plausible resource allocation strategies, we employ a grid search method. We define a step size $\epsilon$ (e.g., 0.05) and set $\alpha = k_1 \epsilon$, $\beta = k_2 \epsilon$, where $k_1, k_2 \in \{1, 2, …, (1/\epsilon)-1\}$. For each combination of ($\alpha$, $\beta$) on this grid, we solve the corresponding parallel network DEA model (both standard and super-efficiency versions). The final efficiency score for a DMU is taken as the arithmetic mean of all efficiency values obtained across the grid. This approach provides a robust and stable evaluation that is not dependent on a single, possibly arbitrary, allocation assumption.
Application and Case Study
To demonstrate the proposed methodology, we collected data for 30 different industry-grade civilian UAV models from major manufacturers. These DMUs represent a mix of rotorcraft and fixed-wing designs suitable for medium-range transport. The processed input and output data are summarized below.
| DMU | $I_1$ (m²) | $I_2$ (CNY) | $I_3$ (10k CNY) | $I_4$ (CNY) | $O_1$ (h) | $O_2$ (kg) | $O_3$ (km/h) | $O_4$ (km) | $O_5$ | $O_6$ | $O_7$ | $O_8$ (%) |
|---|---|---|---|---|---|---|---|---|---|---|---|---|
| 1 | 8.8 | 6.5 | 200 | 200 | 3.3 | 40.0 | 50 | 5 | 4 | 2 | 4 | 85 |
| 2 | 2.2 | 5.0 | 210 | 210 | 1.5 | 20.0 | 40 | 4 | 6 | 4 | 4 | 72 |
| 3 | 3.2 | 17.0 | 400 | 400 | 0.9 | 2.7 | 35 | 8 | 6 | 6 | 6 | 84 |
| 4 | 5.4 | 10.0 | 300 | 300 | 1.5 | 4.0 | 40 | 10 | 4 | 6 | 6 | 80 |
| 5 | 3.3 | 7.0 | 300 | 300 | 3.4 | 10.0 | 30 | 4 | 4 | 6 | 6 | 78 |
| … | … | … | … | … | … | … | … | … | … | … | … | … |
| 28 | 7.6 | 24.0 | 210 | 210 | 12.0 | 24.0 | 50 | 28 | 10 | 8 | 8 | 88 |
| 29 | 5.6 | 23.0 | 180 | 180 | 10.0 | 18.0 | 55 | 26 | 8 | 10 | 8 | 90 |
| 30 | 3.5 | 21.0 | 260 | 260 | 19.0 | 15.0 | 40 | 18 | 10 | 8 | 10 | 87 |
We applied three models to this dataset: (1) the classic CCR model, (2) the Parallel Network DEA model with improved shared allocation ($\epsilon=0.05$), and (3) the proposed Super-Efficiency Parallel Network DEA model ($\epsilon=0.05$). The key comparative results, showing the averaged efficiency scores, are presented in the following table.
| DMU | Classic CCR Overall Efficiency | Parallel Network DEA Overall Efficiency | Base Capability Sub-Efficiency | Adaptation Capability Sub-Efficiency (Min) | Adaptation Capability Sub-Efficiency (Max) | Super-Efficiency Parallel Network DEA Score |
|---|---|---|---|---|---|---|
| 1 | 1.000 | 0.992 | 1.000 | 0.708 | 0.969 | 1.480 |
| 2 | 1.000 | 1.000 | 1.000 | 1.000 | 1.000 | 1.839 |
| 3 | 0.764 | 0.516 | 0.478 | 0.544 | 0.544 | 0.516 |
| 4 | 0.803 | 0.743 | 0.750 | 0.706 | 0.737 | 0.743 |
| 5 | 1.000 | 0.882 | 0.811 | 0.936 | 0.936 | 0.882 |
| … | … | … | … | … | … | … |
| 16 | 1.000 | 1.000 | 1.000 | 1.000 | 1.000 | 1.512 |
| 17 | 1.000 | 0.968 | 0.799 | 1.000 | 1.000 | 1.030 |
| … | … | … | … | … | … | … |
| 28 | 1.000 | 1.000 | 1.000 | 1.000 | 1.000 | 1.074 |
| 29 | 1.000 | 1.000 | 1.000 | 1.000 | 1.000 | 1.189 |
| 30 | 1.000 | 1.000 | 1.000 | – | – | 1.902 |
Analysis of Results and Discussion
The results clearly demonstrate the progressive refinement offered by our proposed methodology. The classic CCR model identified 17 out of 30 civilian UAV models as fully efficient (score = 1.000), offering very low discriminatory power for selection. The introduction of the parallel network structure, which accounts for the internal capability decomposition, immediately provided greater differentiation. The number of efficient DMUs dropped to 10 when evaluated by the Parallel Network DEA model. More importantly, this model provides diagnostic insights. For instance, DMU 23 has an overall parallel network efficiency of 0.886. Its sub-process efficiencies reveal a Base Capability score of 0.929 but an Adaptation Capability score in the interval [0.537, 0.823]. This clearly indicates that its overall inefficiency is primarily driven by weaknesses in environmental adaptation, providing a clear direction for potential improvement or mission suitability assessment.
The final step, the application of the Super-Efficiency Parallel Network DEA model, achieved the primary goal of a full, discriminatory ranking of all civilian UAV models. All DMUs now have distinct scores. Notably, DMU 30, DMU 2, and DMU 16 emerge as the top three performers based on the super-efficiency score, despite all being rated as efficient by the classic model. This ranking incorporates the internal structure of the drones and evaluates their efficiency relative to a frontier from which they are excluded, a more stringent test. The proposed framework thus transforms a selection problem with many seemingly equal candidates into one with a clear, interpretable hierarchy.
This methodology offers significant advantages for the military evaluation and selection of civilian UAV technology. It is data-driven, transparent, and reduces reliance on purely subjective judgment. By decomposing capabilities, it not only ranks options but also explains why a particular civilian UAV model may be underperforming. The use of averaged results over a grid of shared-input allocations makes the evaluation robust against uncertainties in cost accounting. The final super-efficiency ranking provides a direct, actionable input for decision-makers tasked with identifying the most logistically efficient platform for island resupply missions.
Conclusion
In this research, we have developed and applied an enhanced Super-Efficiency Parallel Network DEA model to evaluate the island transport efficiency of commercial off-the-shelf civilian UAV models. The core innovation lies in moving beyond the “black box” assessment by explicitly modeling the parallel contributions of flight platform base capabilities and mission environment adaptation capabilities. The refinement of shared-input allocation and the integration of the super-efficiency concept address key limitations of traditional DEA models, namely the lack of diagnostic insight and the inability to discriminate between efficient units.
The case study involving 30 civilian UAV models validates the practical utility of the approach. The proposed model successfully generated a complete ranking with high discriminatory power, identified top-performing candidates like DMU 30 and DMU 2, and provided granular insights into the strengths and weaknesses of each platform’s internal capability structure. This methodological framework offers a powerful, rational, and explainable tool for decision-support in the military selection and application of civilian UAV technology for critical logistics operations in challenging insular environments. Future work will focus on refining the shared-input allocation mechanism and extending the model to dynamic or network-based operational scenarios.