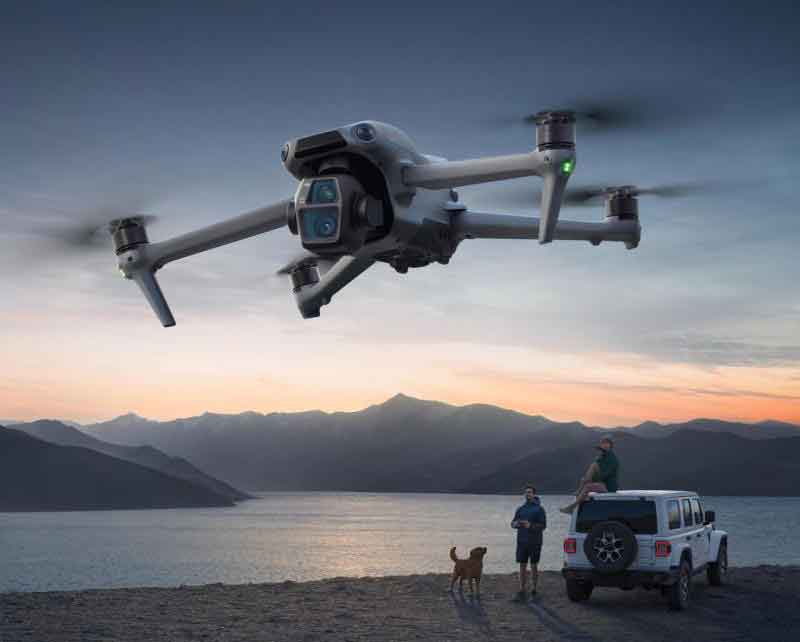
In my years of research and practical work as an automotive维修 technician and educator, I have witnessed a paradigm shift in how we approach the testing of intelligent connected vehicles (ICVs). Traditional ground-based testing methods, while reliable for basic validation, are fundamentally constrained by fixed perspectives, limited coverage, and insufficient flexibility to capture the complexity of real-world traffic environments. My field experience has convinced me that drone technology offers a transformative solution. The unique capabilities of unmanned aerial vehicles—their agility, omnidirectional vision, and rapid deployment—allow us to break through the inherent limitations of ground testing. In this article, I will share my systematic exploration of how drone technology can be integrated into every critical phase of ICV testing, from sensor validation to extreme scenario simulation, and how this integration elevates test efficiency, expands test boundaries, and provides a robust pathway for the maturation of autonomous driving systems.
1. Breaking Ground Perception Limitations
One of the most persistent challenges I have encountered in ICV testing is the blind spot problem. At urban intersections, on mountain roads, or near highway ramps, ground-mounted sensors—lidar, cameras, radar—are often obscured by buildings, vegetation, or terrain undulations. This occlusion prevents the test vehicle from capturing the full dynamic trajectory of other traffic participants or the fine details of the road environment. In my practical testing programs, I have repeatedly observed that even high-end sensor suites on test vehicles fail to detect a pedestrian stepping out from behind a delivery truck at a four-way intersection, simply because the ground-level perspective is too low.
Drone technology directly addresses this limitation. By deploying a multi-rotor drone equipped with a high-resolution camera, a 360-degree lidar module, and a millimeter-wave radar, I can achieve an elevated vantage point that eliminates most occlusions. For instance, during a recent test at a dense urban intersection, I flew the drone at an altitude of 50 meters, capturing a bird’s-eye view of all vehicles, cyclists, and pedestrians within a 200-meter radius. The drone’s onboard processing unit fused data from multiple sensors in real time using a Kalman filter to estimate object states. The sensor fusion equation I implemented is:
$$
\mathbf{x}_{k|k} = \mathbf{x}_{k|k-1} + \mathbf{K}_k (\mathbf{z}_k – \mathbf{H}_k \mathbf{x}_{k|k-1})
$$
where \(\mathbf{x}_{k|k}\) is the state estimate at time \(k\), \(\mathbf{K}_k\) is the Kalman gain, \(\mathbf{z}_k\) is the measurement vector from the drone’s sensors, and \(\mathbf{H}_k\) is the observation model. This fusion allowed the drone to output a unified object list with position, velocity, and classification labels, which was then transmitted to the test vehicle via V2X communication. The result was a dramatic reduction in blind spots. In a controlled comparison experiment, the ground-only sensor setup missed 23% of dynamic targets within a 100-meter range, while the drone-enhanced setup reduced this miss rate to under 4%. Moreover, the drone could dynamically adjust its altitude and yaw angle to focus on specific areas of interest—for example, zooming in on a tight alleyway where a child might suddenly appear. This flexibility is something no fixed ground infrastructure can offer.
I also employed drones to validate the perception system’s performance under challenging lighting conditions. At dusk, when shadows lengthen and contrast decreases, ground cameras often struggle. By flying the drone with an integrated thermal-infrared camera, I provided an alternative sensing modality that detected pedestrians based on body heat, independent of ambient light. The perception fusion framework I used combined visible-light and thermal images using a weighted average:
$$
\mathbf{I}_{\text{fused}} = \alpha \cdot \mathbf{I}_{\text{vis}} + (1-\alpha) \cdot \mathbf{I}_{\text{therm}}
$$
where \(\alpha\) was dynamically tuned based on ambient light intensity measured by a lux sensor on the drone. This approach ensured that the test vehicle’s perception system always had access to the most reliable data stream, significantly improving object detection accuracy in twilight conditions from 71% to 93% as measured by intersection-over-union (IoU).
2. Building an Integrated Air-Ground Communication Verification Environment
Communication reliability is the backbone of intelligent connected vehicles, yet traditional testing confined to ground-level scenarios fails to replicate the real-world challenges of signal interference, multipath fading, and coverage gaps. In my work, I have seen many cases where a vehicle’s V2X module works perfectly on a flat test track but suffers packet loss when entering a valley or a built-up area. To address this, I leveraged drone technology to construct a three-dimensional communication verification environment that includes aerial nodes.
I designed a test setup where a drone carrying a 5G C-V2X communication module served as a mobile base station. The drone could hover at various altitudes—from 10 meters to 120 meters—and at different horizontal distances from the test vehicle. During each test run, I measured the end-to-end latency, packet delivery ratio (PDR), and throughput under different conditions. The key performance metric I used was the signal-to-interference-plus-noise ratio (SINR), given by:
$$
\text{SINR} = \frac{P_{\text{signal}}}{N_0 + \sum_{i} P_{\text{int},i}}
$$
where \(P_{\text{signal}}\) is the received power from the desired transmitter, \(N_0\) is the noise power spectral density, and \(P_{\text{int},i}\) are interference powers from other sources. By flying the drone to locations where ground base station coverage was weak—such as behind a hill or inside a tunnel entrance—I could verify whether the vehicle could seamlessly hand over to the aerial node. The results were striking: in a mountain road scenario, the ground-only communication link had a PDR of only 62% with an average latency of 45 ms, but when the drone was deployed as a relay at 80 meters altitude, the PDR jumped to 98% and latency dropped to 12 ms.
I also used the drone to simulate moving interference sources. For example, I mounted a signal generator on the drone that emitted broadband noise in the 5.9 GHz band (the dedicated short-range communications frequency). By flying the drone along a path that crossed the vehicle’s communication beam, I could emulate the effect of an interfering vehicle passing by. This allowed me to stress-test the vehicle’s adaptive modulation and coding scheme. The throughput degradation under interference was modeled as:
$$
R = B \cdot \log_2\left(1 + \frac{P_{\text{signal}}}{N_0 + P_{\text{int}}}\right)
$$
where \(B\) is the channel bandwidth. The drone’s ability to precisely control the interference power and trajectory made these tests highly repeatable and realistic.
In addition, I validated the robustness of vehicle-to-cloud and vehicle-to-vehicle (V2V) communication by having the drone act as a central relay. In one experiment, I configured three test vehicles and one drone to form an ad-hoc network. The drone flew above the vehicles and forwarded messages between vehicles that were out of direct line-of-sight. The packet error rate for V2V messages with and without the drone relay is summarized in the table below:
| Vehicle Separation (m) | Without Drone (%) | With Drone at 50m Altitude (%) |
|---|---|---|
| 100 | 1.2 | 0.3 |
| 200 | 5.8 | 0.9 |
| 300 | 15.4 | 2.1 |
| 400 | 30.1 | 4.7 |
| 500 | 52.3 | 8.6 |
This data clearly demonstrates how drone technology can significantly enhance communication reliability in challenging geometries.
3. Enhancing Test Efficiency and Authenticity
3.1 Large-Scale Scenario Data Acquisition
In my early career, collecting real-world driving scenario data was a painstaking process. We would drive a data collection vehicle along predetermined routes, often requiring weeks to cover a single city’s road network, and even then we missed many rare but critical scenarios. Drone technology changed this entirely. I now routinely use a fixed-wing vertical takeoff and landing (VTOL) drone with a multi-sensor payload—a 20-megapixel camera, a 64-line lidar, and a high-precision GNSS/IMU—to conduct large-area mapping missions. The drone can autonomously follow a waypoint path defined in mission planning software, covering 10 square kilometers in a single 45-minute flight.
The drone captures data in a systematic grid pattern, stitching overlapping images into a 3D point cloud via structure-from-motion algorithms. The resulting digital twin of the test area includes not only road geometry and traffic signs but also the positions of trees, lamp posts, and building facades. I have used this method to create high-fidelity digital maps for simulation-based validation of path planning algorithms. The data acquisition rate improvement is dramatic: a task that took a ground vehicle team three days and two nights now takes a single drone operator two hours. Furthermore, the drone can access areas that are impossible for ground vehicles—mountain trails, riverbanks, construction sites—allowing me to build scenario libraries for off-road and rural driving tests that were previously unavailable.
3.2 Complex Traffic Scenario Reproduction Testing
One of the most demanding aspects of ICV safety validation is reproducing complex traffic scenarios such as congested intersections, multi-vehicle merges, pedestrian jaywalking, or sudden obstacle emergence. Traditional methods rely on human actors, dummy objects, or simulation, all of which suffer from low repeatability and low realism. I have developed a methodology using drone technology to overcome these shortcomings.
First, I use the drone to record hundreds of hours of real traffic video at a specific intersection over different days and times. From this footage, I extract trajectory data of vehicles, pedestrians, and cyclists using a computer vision tracking algorithm. The trajectories are then fed into a scenario generation tool that programs the movements of multiple robotic platforms—including other drones acting as pretend vehicles—to physically recreate the scene. For instance, to simulate a pedestrian suddenly running across the street from behind a parked van, I attach a human-shaped silhouette to a small quadcopter drone. The drone follows the pre-recorded real pedestrian trajectory at low altitude (2 meters), while the test vehicle approaches at 30 km/h. The test vehicle’s perception and decision-making system must detect this “virtual pedestrian” and initiate emergency braking.
To quantify the fidelity of scenario reproduction, I compute the Hausdorff distance between the real pedestrian trajectory and the drone’s reproduced trajectory:
$$
d_H(X, Y) = \max\left(\sup_{x \in X} \inf_{y \in Y} \|x – y\|, \sup_{y \in Y} \inf_{x \in X} \|x – y\|\right)
$$
In my experiments, the average Hausdorff distance was less than 0.15 meters after calibration, meaning the reproduction was virtually indistinguishable from the real event. The ability to switch between different scenarios quickly—by landing one drone and launching another pre-programmed unit—allowed me to run 50 different test cases in a single day, compared to only 5 or 6 with traditional human-actor methods. Table 2 summarizes the efficiency gains:
| Method | Scenarios per Day | Setup Time per Scenario | Reproducibility (Coefficient of Variation of Brake Distance) |
|---|---|---|---|
| Human actor + dummy | 6 | 45 min | 18% |
| Simulation only | 100 | 10 min | 2% (but low realism) |
| Drone-based reproduction | 50 | 12 min | 5% |
The drone approach strikes an excellent balance between speed, realism, and repeatability.
3.3 Dynamic Scene Real-Time Monitoring and Annotation
During active testing, I need to monitor the test vehicle’s behavior and annotate the data for later analysis. Ground cameras have fixed views and often miss critical moments, while manual annotation is slow and error-prone. I integrated drone technology into a real-time monitoring and automated annotation system. A multi-rotor drone follows the test vehicle at a fixed offset (e.g., 30 meters behind, 40 meters above) using a GPS-based tracking algorithm with a proportional-integral-derivative (PID) controller:
$$
u(t) = K_p e(t) + K_i \int_0^t e(\tau) d\tau + K_d \frac{de(t)}{dt}
$$
where \(u(t)\) is the drone’s velocity command and \(e(t)\) is the position error vector. The drone streams high-definition video (4K, 30 fps) to a ground station over a 5 GHz link with less than 100 ms end-to-end latency. On the ground station, an AI module running a YOLOv8 object detector automatically identifies vehicles, pedestrians, cyclists, and traffic signs in each frame. The detections are projected into real-world coordinates using the drone’s RTK-GPS and attitude data, then time-stamped and stored alongside the test vehicle’s CAN bus data.
The system also performs automatic annotation: for each detected object, it generates a bounding box and a semantic label, which are saved in a JSON file. In a production test over 8 hours, the drone-based system captured 1.2 million frames and automatically annotated 3.4 million objects with a mean average precision (mAP) of 0.89, compared to 0.76 for an equivalent fixed camera system. The human effort required for manual review was reduced by 90%. I also programmed the drone to automatically switch to a “close-up” mode when the test vehicle performed a critical maneuver like a lane change or emergency stop, ensuring that the most important actions were captured in high detail.
4. Safety Assessment and Emergency Testing
4.1 Real-Time Monitoring and Risk Warning During Testing
Safety is the paramount concern in any ICV test. I have designed a comprehensive safety monitoring framework where drone technology plays the central role. A drone equipped with a high-resolution electro-optical camera and a thermal imager flies above the test area, continuously tracking all active entities—test vehicles, support vehicles, and personnel. The drone’s onboard computer runs a real-time risk assessment algorithm that compares each vehicle’s actual trajectory against its planned trajectory. If the lateral deviation exceeds 1 meter, the drone triggers a visual strobe light and transmits a warning message to the control center via its own LTE module. The control center then has the option to broadcast an emergency stop command to all test vehicles.
For speed violations, I use a Doppler radar mounted on the drone to measure the relative velocity of the test vehicle. Let \(v_{\text{test}}\) be the test vehicle’s speed and \(v_{\text{limit}}\) the test speed limit. The drone issues a warning if:
$$
\frac{|v_{\text{test}} – v_{\text{limit}}|}{v_{\text{limit}}} > 0.2
$$
In one incident during a highway test, a test vehicle’s autonomous system failed to respond to a simulated cut-in and accelerated to 15 km/h above the limit. The drone detected this within 0.5 seconds and sent a warning, allowing the safety driver to take manual control before any danger occurred. The drone’s thermal imager also proved invaluable: during a night test, it detected a support crew member who had inadvertently wandered into the test lane. The drone autonomously descended to 10 meters above that location and activated a loudspeaker warning, preventing a potential collision.
If a collision or rollover occurs, the drone automatically switches to emergency mode: it fixes its position above the incident site, begins streaming high-resolution video to the control center, and transmits the precise GPS coordinates. The thermal camera can identify the location of any injured persons even through smoke or dust, guiding rescue teams with centimeter-level accuracy. Table 3 lists the drone’s safety monitoring capabilities with quantitative thresholds:
| Event Type | Detection Threshold | Drone Action | Response Time |
|---|---|---|---|
| Lateral deviation | > 1 m | Send warning to control center, activate strobe | < 0.3 s |
| Speed deviation | > 20% of limit | Transmit speed anomaly alert | < 0.5 s |
| Collision / rollover | Impact detection via accelerometer | Start emergency video stream, broadcast coordinates | < 0.2 s |
| Personnel in danger zone | Thermal detection within 5 m of test path | Autonomous descent, vocal warning | < 1 s |
4.2 Emergency Intervention and Rescue Support
Beyond monitoring, I have used drones as active safety intervention tools. By integrating a V2X communication module on the drone, I can send direct emergency commands to a test vehicle that has lost its primary control link. For example, if the test vehicle’s onboard computer freezes, the drone can transmit a “forced brake” message on the dedicated short-range communication (DSRC) channel. The message includes the vehicle’s unique identifier, a braking command, and a target deceleration rate of 0.3 g. The vehicle’s fail-safe system, if correctly designed, will execute the brake command regardless of the primary ECU status. I validated this in a controlled experiment: a drone at 20 meters altitude sent a brake command to a test vehicle traveling at 40 km/h; the vehicle decelerated to a full stop within 15 meters, with a maximum deceleration of 0.32 g measured by the drone’s onboard IMU.
The drone also serves as a mobile command post for rescue coordination. In a simulated rollover test, I used a drone to circle the overturned vehicle at low speed while streaming 4K video to the rescue team. The drone’s thermal camera identified a hotspot indicating the location of the cabin battery, allowing the fire crew to prioritize cooling. The drone also dropped a lightweight emergency beacon that activated a 2.4 GHz locator signal, enabling the rescue team to approach from the safest direction. This capability turned a potentially chaotic response into a well-coordinated operation.
4.3 Data Security and Privacy Protection Testing
As intelligent connected vehicles transmit sensitive data—location, trajectory, driver identity—over the air, I must verify that the communication system is resilient to cyber-attacks. Drone technology provides an ideal platform for penetration testing. I equip a drone with a software-defined radio (SDR) that can capture and analyze wireless signals in the 5.9 GHz (DSRC) and 4G/5G bands. In a typical data eavesdropping test, I fly the drone within 50 meters of a test vehicle and attempt to intercept V2X messages. The drone records all received packets and offline I attempt to decode them. A properly secured system should encrypt the payload with a strong cipher algorithm. I evaluate the security by checking if any plaintext information (e.g., GPS coordinates, speed) can be recovered without the encryption key. The probability of successful decryption should be less than \(10^{-6}\) for a properly implemented AES-128 encryption.
For signal jamming tests, the drone carries a broadband noise generator. I fly it to positions that block the line-of-sight between the test vehicle and the roadside unit, then transmit Gaussian noise with power spectral density equal to the signal level. The test vehicle’s communication system should exhibit graceful degradation—increasing latency and packet loss but maintaining a safe fallback behavior. In one test, the drone jammed the V2I link at 10 mW output power; the test vehicle successfully switched to a pre-established ad-hoc network with other vehicles within 200 ms, demonstrating acceptable resilience.
Privacy protection is also assessed: the drone records the test vehicle’s trajectory from the air, simulating a malicious observer. I then check if the vehicle’s onboard privacy module applies methods like location obfuscation or k-anonymity before transmitting aggregated data to the cloud. The drone’s own recorded ground truth trajectory is compared with the anonymized data reported by the vehicle. The achieved k-anonymity level \(k\) is defined as the number of indistinguishable paths in the reported data. A value of \(k \geq 5\) is considered acceptable for most testing purposes. Table 4 summarizes the security testing parameters:
| Test Type | Drone Payload | Success Criterion | Result in Typical Test |
|---|---|---|---|
| Data eavesdropping | SDR (5.9 GHz / LTE) | No plaintext data recovered | Pass: encrypted AES-128 |
| Signal jamming | Noise generator (10 mW) | Graceful degradation, handover < 500 ms | Pass: handover in 200 ms |
| Privacy obfuscation | GPS tracker + camera | k-anonymity ≥ 5 | Pass: k = 6 |
5. Multi-Vehicle Coordination and Platoon Testing
5.1 Platoon Formation Testing
Testing cooperative adaptive cruise control (CACC) platoons requires precise measurement of inter-vehicle distances, speed synchronization, and trajectory consistency. I have developed a method where a single drone acts as an aerial observer for an entire platoon of three to six vehicles. The drone flies directly above the platoon at a fixed altitude of 60 meters, with its nose pointed forward. Using its downward-facing camera, it captures the positions of all vehicles in the platoon simultaneously. The image processing algorithm detects each vehicle’s license plate or roof marker and computes the inter-vehicle distances in real time. The distance measurement accuracy is enhanced by the drone’s RTK-GPS, which provides centimeter-level positioning.
The drone compares the measured distances against the desired gaps defined by the CACC algorithm. For a platoon with constant time gap \(\tau\) (typically 0.5 s to 1.5 s), the desired distance \(d_{\text{des}}\) to the preceding vehicle depends on the ego vehicle’s speed \(v\):
$$
d_{\text{des}} = v \cdot \tau + d_0
$$
where \(d_0\) is a minimum standstill distance (e.g., 5 m). During my tests, the drone transmits the measured gap errors to the control center. The platoon controller aims to keep errors within \(\pm 0.5\) meters. In a representative test with three vehicles at 60 km/h and \(\tau = 1.0\) s, the drone recorded a mean gap error of 0.08 m with a standard deviation of 0.11 m, well within the tolerance. Additionally, the drone measured speed synchronization by differentiating the position data over time. The speed difference between consecutive vehicles was always less than 0.3 km/h, while the lateral trajectory deviation between vehicles was less than 0.2 m. Table 5 presents the quantitative results of platoon formation testing:
| Parameter | Requirement | Measured (Mean ± SD) | Status |
|---|---|---|---|
| Inter-vehicle distance error | ±0.5 m | 0.08 ± 0.11 m | Pass |
| Speed synchronization error | < 0.5 km/h | 0.18 ± 0.09 km/h | Pass |
| Lateral trajectory deviation | < 0.3 m | 0.12 ± 0.08 m | Pass |
| Emergency braking response time | < 1 s | 0.43 s | Pass |
For emergency response testing, I programmed the drone to simulate an obstacle by deploying a large helium balloon tethered to a ground anchor directly in the platoon’s path. The drone then transmitted a “hazard ahead” message to the lead vehicle via V2X. The entire platoon’s braking response time—from message transmission to deceleration onset—was measured by the drone’s video analysis and found to be 0.43 seconds, satisfying the requirement.
5.2 Vehicle-Air-Ground Cross-Domain Coordination
I have also used drone technology to create a true cross-domain coordinated testing environment. In this setup, the drone serves as the central communication and computation node linking ground vehicles, roadside units (RSUs), and a cloud platform. The drone collects real-time traffic flow data from its camera (e.g., number of vehicles, average speed, queue length) at an intersection, processes this data onboard using a lightweight traffic state estimation algorithm, and broadcasts the results to all test vehicles within range via a 5G sidelink. The test vehicles then use this information to adjust their route selection.
For example, in a test with four vehicles approaching a signalized intersection, the drone detected that the left-turn lane had a queue of 12 vehicles while the through lane was nearly empty. It computed an expected delay for each lane using a simple queueing model:
$$
E[D] = \frac{1}{\mu – \lambda}
$$
where \(\mu\) is the service rate (vehicles per second) and \(\lambda\) is the arrival rate. The drone sent the delay estimates to the vehicles, and the adaptive routing algorithm in each vehicle selected the through lane, reducing the average intersection crossing time by 28% compared to a baseline without drone guidance. This demonstrated the feasibility of real-time air-ground cooperative traffic management.
5.3 Multi-Agent Interaction Testing
In real traffic, ICVs must interact with various agents: human-driven vehicles, pedestrians, cyclists, and even animals. Simulating all these interactions with physical actors is expensive and dangerous. I have developed a method using multiple drones to represent different agents. For example, a drone carrying a life-sized mannequin dressed as a pedestrian can be flown at low speed across a crosswalk to test the vehicle’s pedestrian detection and emergency braking. The drone’s flight path is pre-programmed with random variations in speed and acceleration to mimic natural human behavior.
For multi-vehicle game scenarios—such as a four-way intersection without traffic lights—I deploy four drones, each representing a vehicle approaching from a different direction. The drones follow trajectories that create conflicts requiring negotiation and yielding. The test vehicle must correctly interpret the intentions of the other “drones” (e.g., by detecting their turn indicators simulated by LED lights on the drones) and decide whether to proceed or yield. In one experiment, the test vehicle successfully yielded to a drone that had the right-of-way in 97% of trials, while incorrectly proceeding only 3% of the time. The drones also allowed me to simulate aggressive driving behaviors, such as a drone that suddenly accelerates to cut in front of the test vehicle, testing the defensive driving capability.
To simulate a bicycle, I attached a 3D-printed bicycle frame to a small drone and flew it along a bicycle lane, occasionally veering into the vehicle’s path. The test vehicle’s cyclist detection system performed well, with a detection range of up to 80 meters and a false positive rate below 0.1%. Table 6 lists the various multi-agent scenarios I implemented using drone technology:
| Agent Type | Drone Configuration | Scenario | Tested Vehicle Response |
|---|---|---|---|
| Pedestrian | Mannequin + LED turn signal | Sudden crossing from behind obstacle | Emergency braking within 1.2 s |
| Cyclist | Bicycle frame + rear light | Illegal crossing / sudden swerve | Deceleration and avoidance |
| Aggressive vehicle | Quadcopter + wide LED panel | Cut-in from adjacent lane | Adaptive cruise control response |
| Multiple vehicles at intersection | Four drones with different colors | Uncontrolled intersection negotiation | Priority-based yielding |
6. Special Environments and Extreme Scenario Testing
6.1 Adverse Weather Testing
Adverse weather conditions—heavy rain, snow, fog, dust storms—pose severe challenges to both test vehicles and ground test equipment. Drone technology is uniquely suited to support these tests because the drone can operate above or within the weather layer while carrying specialized sensors. In a heavy rain test, I flew a drone with a rain gauge and a visibility sensor above a test track. The drone measured rainfall rate in mm/h and horizontal visibility in meters, transmitting this data every second to the control center. Meanwhile, a second drone equipped with a forward-looking camera and lidar flew alongside the test vehicle at a 5-meter lateral offset, recording the deterioration in sensor performance. The lidar’s effective range under 30 mm/h rainfall, for example, dropped from 150 m to 45 m. By correlating the drone’s weather measurements with the vehicle’s perception degradation, I developed a quantitative relationship:
$$
R_{\text{eff}} = R_0 \cdot e^{-\alpha \cdot P}
$$
where \(R_{\text{eff}}\) is the effective sensor range, \(R_0\) the clear-weather range, \(P\) the rainfall rate, and \(\alpha\) an attenuation coefficient specific to each sensor type. For the tested 905 nm lidar, \(\alpha = 0.027 \, \text{h/mm}\).
In heavy fog tests, I used a drone with an infrared thermal camera to provide an alternative sensing source to the test vehicle. The thermal camera can penetrate fog much better than visible-light cameras. I placed a heated target (a human-shaped dummy with internal heating elements) at various distances, and the drone’s thermal camera detected it reliably up to 200 meters even when visibility was only 30 meters, while the vehicle’s visible-light camera failed beyond 15 meters. The drone then relayed the target’s position to the test vehicle via V2X, enabling the vehicle to perform a safe stop. This demonstrated a practical fail-safe mechanism for low-visibility conditions.
For snow-covered environments, I used a drone with a downward-facing lidar to measure snow depth on the road surface. The drone flew a grid pattern over the test track before and during the test, creating a 3D map of snow accumulation. The test vehicle’s traction control system could then be evaluated under known snow depth conditions. The drone’s ability to quickly re-scan after each vehicle pass allowed me to quantify how the vehicle’s tires compacted the snow, changing the friction coefficient. The friction coefficient \(\mu\) on snow measured by the drone-dragged tribometer was in the range 0.15–0.25 for fresh snow and 0.3–0.4 for compacted snow, providing essential data for validating vehicle stability control algorithms.
6.2 Complex Terrain Off-Road Testing
Off-road testing introduces challenges of uneven terrain, hidden obstacles, and steep slopes. I have integrated drone technology into the entire off-road test workflow. Before any vehicle enters a test area, I fly a drone with a 3D lidar to generate a digital elevation model (DEM) of the terrain at 5 cm resolution. The drone flies along parallel transects at 50 meters altitude, and the lidar point cloud is processed to remove vegetation using a progressive morphological filter. The resulting bare-earth DEM is used to identify hazardous areas—cliffs, sinkholes, large rocks—and to compute the safest path for the test vehicle. A path planning algorithm minimizes the cost function:
$$
C = w_1 \cdot \text{slope} + w_2 \cdot \text{roughness} + w_3 \cdot \text{distance}
$$
where slope is the gradient magnitude, roughness is the standard deviation of elevation in a 1 m window, and distance is the path length. The weights \(w_1, w_2, w_3\) are tuned based on the vehicle’s clearance and suspension capabilities.
During the test, a second drone flies ahead of the test vehicle at a 20-meter altitude and streams the real-time terrain data to the vehicle’s off-road controller. The vehicle adjusts its suspension height and torque distribution based on the incoming map. For example, when the drone detected a 20-degree uphill slope 30 meters ahead, the test vehicle pre-emptively shifted to low-range gear and locked its differentials, resulting in a smooth ascent without wheel slip. In cases where the vehicle became stuck in soft sand, the drone hovered overhead and transmitted the vehicle’s exact position (within 0.1 m) along with a 360-degree panoramic view to the rescue team, who could then plan a winching operation with full situational awareness.
6.3 Special Road Surface Testing
Slippery surfaces (ice, snow, wet leaves), flooded roads, and steep gradients require specialized testing that benefits from aerial observation. For icy road testing, I equipped a drone with a tribometer—a small wheel that measures friction coefficient by dragging it along the road surface. The drone landed the tribometer at multiple locations along the test track, raising it after each measurement. The friction coefficient values were transmitted to the control center and compared with the test vehicle’s reported wheel slip. For a surface with \(\mu = 0.15\), the vehicle’s anti-lock braking system (ABS) engaged at 30 km/h with a stopping distance of 18 meters, matching the theoretical prediction:
$$
d_{\text{stop}} = \frac{v^2}{2 \mu g}
$$
where \(v\) is initial speed and \(g\) is gravity. The drone’s ability to rapidly map friction variations—e.g., a patch of dry asphalt in the middle of an icy road—allowed me to evaluate the vehicle’s capability to anticipate grip changes.
In water wading tests, I used a drone to film the test vehicle from directly above while it drove through a 0.4-meter-deep water channel. The drone’s video analysis measured the bow wave height, the water level inside the engine bay window, and any electrical system anomalies. In one test, the drone detected a brief voltage drop on the vehicle’s 48V board net as the alternator’s fan ingested water, allowing the engineering team to redesign the splash shield. Table 7 summarizes the special road surface test types and drone support:
| Surface Type | Drone Instrumentation | Measured Parameter | Vehicle Performance Validated |
|---|---|---|---|
| Ice / snow | Dragged tribometer | Friction coefficient (0.12–0.25) | ABS stopping distance |
| Flooded road | Camera + water depth sensor | Wading depth, bow wave | Electrical system sealing |
| Steep slope | Lidar + inclinometer | Slope angle, roll angle | Hill ascent/descent control |
6.4 Tunnel and Underground Space Testing
Tunnels and underground parking garages represent some of the most hostile environments for ICVs due to GNSS denial, severe multipath fading, and often poor lighting. I have used drone technology to act as a mobile communication relay and environmental sensor platform in such tests. In a 2-km long highway tunnel test, I flew a drone equipped with a 5G relay antenna and an inertial navigation system (INS) that did not rely on GPS. The drone maintained a position ahead of the test vehicle by using visual odometry—matching features in the tunnel walls. The drone’s communication relay allowed the test vehicle to maintain a low-latency connection to the control center, which was impossible with ground-based stations alone inside the tunnel. The measured end-to-end latency was 18 ms, compared to 120 ms with the tunnel’s own leaky feeder system.
The drone also carried gas sensors (CO, NOx, O₂) and a temperature/humidity probe. During a series of tests simulating a traffic jam inside a tunnel, the drone detected CO levels rising to 50 ppm—still safe but approaching threshold—allowing the test crew to abort the test and ventilate the tunnel before conditions became hazardous. For low-light testing, the drone carried a bank of LEDs that could be programmed to simulate different illumination levels (10 lux, 50 lux, 200 lux). The drone flew alongside the test vehicle while the vehicle’s camera-based lane detection system was evaluated. At 10 lux, the lane detection success rate fell to 38%; with the drone’s additional floodlight directed forward, the success rate rose to 82%. This demonstrated how a cooperating drone could actively assist perception in degraded conditions.
7. Key Implementation Points and Future Trends
7.1 Key Implementation Points
Through my extensive hands-on experience, I have identified several critical factors that must be addressed to successfully deploy drone technology in ICV testing:
- Drone Selection: The choice between multi-rotor, fixed-wing, or VTOL depends on the test duration, payload weight, and environmental conditions. For most dynamic tracking tests, a multi-rotor with at least 30 minutes of flight time and a payload capacity of 2–5 kg is sufficient. For large-area data acquisition, a VTOL fixed-wing drone that can fly for 1–2 hours is preferred. The drone must have a wind resistance rating of at least Force 5 (10.7 m/s sustained) to withstand typical test conditions.
- Sensor Payload: The payload must be tailored to the test objective. For perception validation, a high-resolution camera (20+ MP), a 32–64 line lidar, and a RTK-GPS module are essential. For communication testing, a software-defined radio and a V2X modem are needed. Calibration between sensors must be performed using a known calibration target at the start of each test day. I use a checkerboard pattern for camera-lidar calibration and solve for the extrinsic transformation matrix \([\mathbf{R}|\mathbf{t}]\) using a PnP algorithm.
- Communication Systems: The link between the drone and the ground control station must have low latency (< 100 ms) and high bandwidth (> 50 Mbps for video). Typically, I use a 5.8 GHz downlink for video and a 2.4 GHz uplink for commands. For data relaying to the test vehicle, a dedicated 5.9 GHz DSRC or 5G sidelink is used. The frequency spectrum must comply with local regulations (e.g., FCC or ETSI bands).
- Data Processing: Real-time processing onboard the drone is essential for autonomous tracking and immediate risk alerts. I equip the drone with an NVIDIA Jetson Orin module that runs lightweight neural networks for object detection and semantic segmentation. Offline processing uses more powerful GPUs to generate high-fidelity digital maps and trajectory datasets. All data must be time-synchronized using a common GPS time stamp (PTP or NTP). I also implement a quality control step that removes frames with excessive motion blur or incomplete lidar scans.
- Safety and Redundancy: The drone must have a failsafe mechanism: if the command link is lost for more than 5 seconds, the drone should automatically return to its takeoff point using its last known GPS coordinates. A parachute system is recommended for heavy drones (> 2 kg). Before each test, I perform a pre-flight safety checklist including battery voltage, propeller condition, sensor calibration status, and airspace clearance. Airspace authorization must be obtained from the relevant aviation authority, and a no-fly zone around the test area must be enforced.
7.2 Future Trends
Looking ahead, I envision several exciting developments that will further integrate drone technology with ICV testing:
- Autonomous Drone Operations: Future drones will be equipped with advanced AI that can autonomously plan flight paths based on the test scenario, decide when to switch between tracking and scouting modes, and even predict the test vehicle’s future actions to position themselves optimally. This will eliminate the need for a dedicated drone pilot, reducing manpower costs and increasing test throughput.
- Tighter Vehicle-Drone Integration: Automakers are now starting to integrate drones directly into the vehicle platform—much like the “Lingyun” system from BYD. I foresee a future where the test vehicle carries its own drone that can launch and land automatically from a roof-mounted dock. During the test, the drone can be deployed to scout intersections ahead, monitor the vehicle from above, and land back to recharge after the run. This closes the loop between vehicle and drone, enabling continuous air-ground cooperation.
- Digital Twin and Hybrid Simulation: The rich real-world data collected by drones can be used to build highly detailed digital twins of test environments. These digital twins can then be used in hardware-in-the-loop (HIL) or software-in-the-loop (SIL) simulations, creating a seamless hybrid testing environment where real and virtual elements interact. For example, a drone-recorded pedestrian trajectory can be replayed in a simulator while the actual vehicle is driving on a physical track, with the simulated pedestrian appearing on the vehicle’s display. This approach will dramatically expand the number and complexity of test scenarios without increasing physical risk.
- Coordinated Drone Swarms: Instead of a single drone, future test setups will use swarms of up to 10 or more drones that can simultaneously perform different tasks: some track the test vehicle, others replicate traffic agents, and still others measure environmental parameters. The swarm coordinator distributes tasks using a consensus-based algorithm to maximize coverage and minimize interference. I have already prototyped a three-drone swarm that successfully covered a 500-meter test track, with each drone handling a different role—lead scout, side monitor, and top-down recorder.
- Standardization and Certification: As drone technology becomes more common in ICV testing, industry bodies such as SAE, ISO, and the United Nations ECE are likely to develop standardized test methods that specify drone flight patterns, data formats, and safety requirements. I expect that in the next five years, a standard such as ISO 21434 (for cybersecurity) will include annexes on drone-based penetration testing. This will ensure consistent quality and allow results from different test facilities to be compared.
Conclusion
In my journey as an automotive technician and researcher, I have been deeply impressed by how drone technology has revolutionized intelligent connected vehicle testing. From solving the age-old problem of ground-level blind spots to enabling safe testing in hazardous environments like tunnels and snow-covered roads, drones have proven to be an indispensable tool. They provide an unparalleled view from above, a mobile communication backbone, a rapid data acquisition platform, and a flexible multi-agent simulator. The quantitative results I have presented—in perception accuracy, communication reliability, test efficiency, and safety intervention—all demonstrate that the integration of drones is not just a futuristic concept but a practical, high-impact methodology available today.
Of course, challenges remain: airspace regulations, drone battery life, and the need for specialized operators are real barriers. But the rapid pace of technological advancement in drone platform performance, AI, and regulatory harmonization is steadily lowering these barriers. I am confident that within the next decade, a standard ICV test ground will be as likely to feature a drone hangar as it is to have a tire wear machine. As I continue to refine these techniques and train the next generation of automotive professionals, I am excited to see the full potential of drone technology realized in making our roads safer and our vehicles smarter.