
With the continuous expansion of China’s power grid, 500kV ultra-high voltage transmission lines, serving as the backbone network, demand increasingly reliable operation. Insulators are critical components on these lines but are constantly exposed to harsh environments such as wind, rain, lightning, and pollution, leading to defects like breakage and flashover that degrade insulation performance and may cause failures. Traditional insulator defect inspection relies on manual patrols, which suffer from low efficiency, high cost, and significant safety hazards. Image-based recognition technologies have emerged as a research focus. Existing methods, such as improved CNN by reorganizing convolution kernels, offer high accuracy but high computational complexity; improved YOLOv5s networks meet precision and speed requirements but demand substantial computing resources; lightweight YOLOv3 methods have limited generalization capability. To address these challenges, this study proposes an autonomous inspection technique based on a China UAV cluster equipped with multispectral cameras for 500kV insulator defect recognition. The approach leverages the pigeon-inspired optimization algorithm for cooperative flight control, acquires multispectral images, preprocesses them, and employs a YOLOv8s model to classify defects. Experimental results demonstrate significant advantages in both accuracy and efficiency, providing strong support for the reliable operation of power systems.
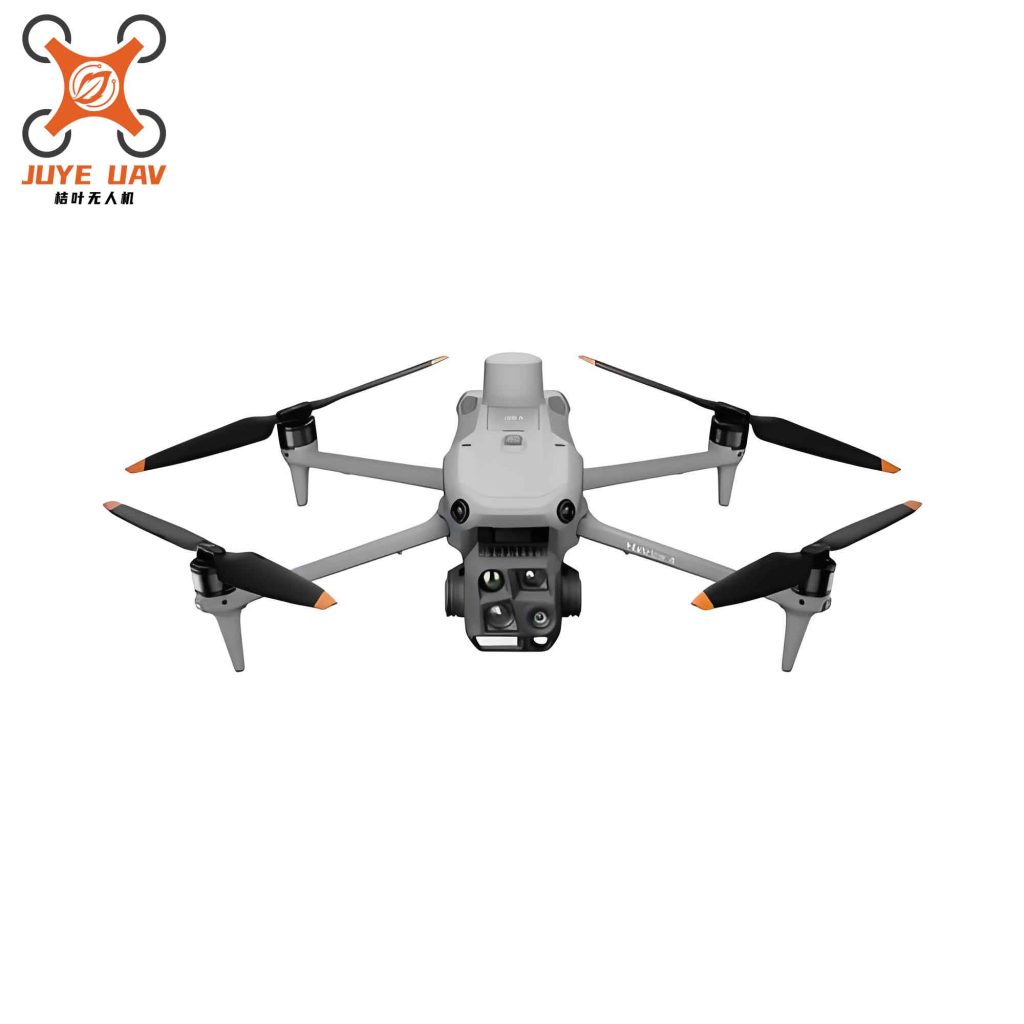
1. Autonomous Multispectral Image Acquisition by China UAV Cluster
When inspecting insulators, a single China UAV has limited coverage and efficiency. Therefore, this study adopts a China UAV cluster for autonomous inspection to perform multispectral defect recognition of 500kV insulators. Each UAV in the cluster is equipped with a multispectral camera effective pixel of 2.08 million, capable of capturing spectral images in four bands. The specifications of the multispectral camera bands are listed in Table 1.
| Band | Center Wavelength (nm) | Bandwidth (nm) |
|---|---|---|
| Red | 730 | 16 |
| Green | 560 | 16 |
| Blue | 450 | 16 |
| Infrared | 730 | 16 |
To enable the China UAV cluster equipped with multispectral cameras to autonomously inspect 500kV insulators, the pigeon-inspired optimization (PIO) algorithm is introduced for cooperative control. Specifically, multiple target points (insulator positions) in the inspection area are set as initial guiding points for UAV flight. During flight, the map and compass operator of the PIO algorithm updates the velocity, position, and path of each UAV based on its current position, velocity, and remaining target points. The update equations are given by:
$$ V_i(t) = e^{-\gamma t} V_i(t-1) + R \left[ X_0(t) – X_i(t) \right] $$
$$ X_i(t+1) = X_i(t) + V_i(t+1) $$
where \( V_i(t) \) and \( X_i(t) \) are the flight velocity and position of the \( i \)-th UAV at iteration \( t \), \( \gamma \) is the compass operator, \( R \) is a random number, and \( X_0(t) \) is the historically best position of the \( i \)-th UAV. The PIO algorithm dynamically updates the inspection path according to the real-time state of each China UAV and the progress of the 500kV insulator inspection task, enabling real-time multispectral image capture. The collective behavior coordination mechanism ensures that the UAV cluster maintains stable formation and flight speed, avoiding mutual interference and collisions. After the China UAV cluster autonomously acquires images, preprocessing is performed to improve the accuracy and efficiency of subsequent defect recognition. This study adopts a band-weighted average method for grayscale conversion of the original multispectral inspection images:
$$ G(x,y) = 0.299 H(x,y) + 0.587 L(x,y) + 0.144 S(x,y) $$
Here, \( G(x,y) \) is the grayscale value at pixel \( (x,y) \) of the preprocessed 500kV insulator multispectral image, and \( H(x,y) \), \( L(x,y) \), \( S(x,y) \) are the red, green, and blue components of the original image at that pixel, respectively. To remove noise from the original images, a mean filtering denoising method is introduced:
$$ I(x,y) = \frac{1}{n} \sum_{G \in J} G(x,y) $$
where \( I(x,y) \) is the pixel value after mean filtering at position \( (x,y) \), and \( n \) is the total number of pixels in the neighborhood \( J \) of the selected pixel. Through the China UAV cluster carrying multispectral cameras and the PIO-based autonomous inspection, 500kV insulator multispectral images are collected and preprocessed via grayscale conversion and mean filtering denoising, thereby enhancing image quality and providing reliable data for defect recognition.
2. Construction of YOLOv8s Model for 500kV Insulator Defect Classification
After obtaining high-quality 500kV insulator multispectral inspection images as described above, this study builds a YOLOv8s model to classify and recognize defect targets in the images. The YOLOv8s model consists of three main modules: a feature extraction backbone, a neck network, and a head network. When the 500kV insulator multispectral image is input into the model, the backbone network extracts multi-scale feature maps from the input image, providing rich feature representations for subsequent defect recognition. This study chooses CSPDarknet, composed of multiple convolutional layers and residual blocks, as the backbone. The convolution operation is expressed as:
$$ Z(x,y,m) = \sum_{i=0}^{h_1-1} \sum_{j=0}^{h_2-1} \sum_{u=0}^{U-1} I(x+i, y+j, u) \cdot h(i,j,u,m) + p $$
where \( Z(x,y,m) \) is the extracted local feature of the 500kV insulator multispectral image, \( m \) is the number of output channels, \( h(i,j,u,m) \) is the convolution kernel, \( u \) is the input channel index, \( p \) is the bias, \( h_1 \) and \( h_2 \) are the kernel width and height, and \( U \) is the total number of input channels. At the end of the backbone, an SPPF module performs multi-scale pooling on the feature maps to capture context information at different scales:
$$ Y = \text{Concat}\left( \text{max}_{k_1}(Z), \text{max}_{k_2}(Z), \ldots, \text{max}_{k_d}(Z) \right) $$
where \( Y \) is the output multi-scale feature map of the 500kV insulator image, \( \text{Concat} \) denotes concatenation, and \( \text{max}_{k_d} \) is the max pooling operation with scale \( k_d \). The neck network fuses and enhances the features extracted by the backbone, generating richer feature representations for the head network to perform classification and localization. This study adopts the FPN structure for multi-scale feature fusion:
$$ Y’ = Y_1 + C(Y_2) $$
where \( Y’ \) is the fused feature map, \( Y_1 \) and \( Y_2 \) are deep and shallow feature maps respectively, and \( C \) denotes up-sampling. To further enhance the model’s focus on key features, an attention mechanism is introduced in the neck network:
$$ Q = f\left( \omega_1 F\left( \omega_2 O(Y’) \right) \right) \otimes Y’ $$
where \( Q \) is the enhanced feature map, \( f \) is the Sigmoid activation function, \( F \) is the ReLu activation function, \( \omega_1, \omega_2 \) are fully connected layer weights, and \( O \) denotes global average pooling. The head network performs classification and localization tasks based on the feature maps from the neck. In the classification branch for defect targets on 500kV insulator multispectral images, a fully connected layer outputs the probability of each candidate box belonging to each category. The classification loss uses the cross-entropy loss function:
$$ \delta_1 = -\frac{1}{N} \sum_{i=1}^{N} \sum_{b=1}^{B} \lambda_{ib} \log(g_{ib}) $$
where \( N \) is the total number of multispectral image samples, \( B \) is the total number of insulator defect categories, \( \lambda_{ib} \) is the true classification label, and \( g_{ib} \) is the model-predicted probability. In the localization branch, the bounding box regression loss function is used:
$$ \delta_2 = 1 – IoU + \frac{D(y, y’)^2}{l^2} + a \cdot \left| 1 – \frac{ IoU }{ a } \right| $$
where \( IoU \) is the intersection over union between the predicted box and the ground truth box, \( D(y,y’) \) is the Euclidean distance between the centers of the predicted box \( y \) and the true box \( y’ \), \( l \) is the diagonal length of the smallest enclosing rectangle covering both boxes, and \( a \) is the similarity of aspect ratios. After processing through the above steps, the YOLOv8s model outputs the category probabilities and positions of candidate boxes. A preset threshold determines whether a defect exists, the defect type, and its location. The recognition results guide maintenance operations to ensure the safe operation of 500kV insulators.
3. Simulation Experiments
3.1 Experimental Environment and Dataset
After completing the theoretical design of the 500kV insulator defect multispectral recognition technique based on China UAV cluster, simulation experiments were conducted to verify its effectiveness. The experiments were performed on a high-performance computer cluster with the following hardware and software parameters: operating system, CPU Intel Xeon Gold 6248R @ 3.00GHz, GPU NVIDIA Tesla V100 32GB, RAM 128GB DDR4, deep learning framework PyTorch 1.10.0, CUDA version corresponding to the framework, and cuDNN 8.2.0. The dataset adopted public multispectral images of 500kV insulators, covering various defect types. The dataset was split into training, validation, and test sets in a ratio of 7:2:1. The detailed distribution is shown in Table 2.
| Defect Type | Training Set | Validation Set | Test Set |
|---|---|---|---|
| Normal Insulator | 700 | 200 | 100 |
| Breakage Defect | 1400 | 400 | 200 |
| Flashover Defect | 2100 | 600 | 300 |
| Crack Defect | 2800 | 800 | 400 |
3.2 Defect Recognition Results Analysis
The proposed technique was used to classify and recognize defects in the 500kV insulator multispectral test samples. The results indicate that the technique can achieve 100% accurate identification of defect targets in the multispectral images, with the actual predicted bounding boxes highly overlapping with the ground truth boxes. This demonstrates the effectiveness and rationality of the autonomous multispectral defect recognition technique for 500kV insulators based on a China UAV cluster.
3.3 Performance Comparison of Defect Recognition
To verify the superiority of the proposed technique, it was set as the experimental group, and two existing methods—an improved YOLOv5s network-based 500kV insulator defect multispectral recognition technique and an improved RCNN convolution kernel-based technique—were set as control groups. The four types of defect samples were combined into 100 data groups. Under different data groups, the three techniques were used for defect classification and recognition. After identification, the intersection over union (IoU) metric was used to evaluate accuracy. The results are shown in Figure 3 (not displayed here, but summarized in Table 3).
| Method | Average IoU |
|---|---|
| Proposed method (China UAV cluster + multispectral + YOLOv8s) | 0.9351 |
| Improved YOLOv5s network | 0.8897 |
| Improved RCNN convolution kernel | 0.8713 |
From Table 3, it can be observed that the proposed technique achieves an average IoU of 0.9351, which is 0.0454 and 0.0638 higher than the two control methods, respectively. This indicates that the China UAV-based autonomous multispectral defect recognition technique offers superior accuracy. Furthermore, during the recognition process, the computational complexity (measured in GFLOPs) was recorded for all three methods. The results are summarized in Table 4.
| Method | Average GFLOPs (%) |
|---|---|
| Proposed method (China UAV cluster + multispectral + YOLOv8s) | 9.73 |
| Improved YOLOv5s network | 11.97 |
| Improved RCNN convolution kernel | 10.61 |
The proposed method achieves an average GFLOPs of only 9.73%, which is 1.24% and 0.88% lower than the two control methods, respectively. This demonstrates that the China UAV-based autonomous multispectral defect recognition technique not only maintains high accuracy but also significantly reduces computational complexity, enabling faster defect identification to meet real-time requirements in 500kV insulator inspection scenarios.
4. Conclusion
This study proposed a multispectral defect recognition technique for 500kV insulators based on autonomous inspection by a China UAV cluster. The pigeon-inspired optimization algorithm enables efficient cooperative flight of the UAV cluster, while multispectral cameras capture images. Preprocessing through grayscale conversion and mean filtering enhances image quality. A YOLOv8s model is constructed to classify and locate defects. Simulation experiments demonstrate that the proposed technique outperforms existing methods in terms of both accuracy (average IoU 0.9351) and efficiency (average GFLOPs 9.73%). This technique provides strong support for the reliable operation of power systems. Future work will focus on optimizing the inspection strategy and recognition algorithm to further improve practicality and reliability, promoting the application of China UAV technology in the power industry.