The rapid advancement of unmanned aerial vehicle (UAV) technology has revolutionized the field of topographic mapping, particularly in riverine environments where traditional survey methods face significant challenges. Among various UAV platforms, the fixed-wing UAV stands out due to its high speed, long endurance, and capability to cover extensive areas in a single flight. This paper presents a comprehensive study on the application of fixed-wing UAV aerial survey technology for 1:1,000 scale topographic mapping of the Huaihe River, focusing on the entire workflow from flight planning to accuracy assessment. Through a detailed case study, we demonstrate the feasibility and advantages of using fixed-wing UAV systems for efficient and accurate river topographic surveys.
0 Introduction
With the rapid development of UAV technology, the use of UAVs for river supervision and topographic mapping has become widespread in the water resources sector. UAV platforms can be categorized into fixed-wing UAVs, rotary-wing UAVs, unmanned airships, parawing UAVs, and ornithopters. Among these, fixed-wing UAVs are the most widely used due to their superior speed, endurance, suitability for high-altitude long-distance flights, and ability to carry various payloads. In this project, we employed a Zongheng CW-15II fixed-wing UAV equipped with a CA103+ rotating oblique platform ortho-camera to acquire digital orthophoto images and three-dimensional (3D) model data for a 1:1,000 scale topographic map of the Huaihe River. This paper systematically analyzes the accuracy of the resulting topographic map and discusses the feasibility of applying fixed-wing UAV technology to river surveying, providing a technical reference for similar projects.
1 Overview of Fixed-Wing UAV Technology
The continuous advancement of aviation technology, electronics, and materials science has significantly improved the performance, reliability, and application scope of fixed-wing UAVs. In the 21st century, the integration of artificial intelligence, big data, and the Internet of Things has created new opportunities for fixed-wing UAV development. As an unmanned aerial vehicle that generates lift through fixed wings, fixed-wing UAVs offer distinct advantages over rotary-wing UAVs, including higher flight efficiency, longer endurance, and faster cruise speeds. These characteristics make fixed-wing UAVs particularly suitable for large-area survey tasks such as river corridor mapping, where the ability to cover long linear distances efficiently is critical.
2 Application of Fixed-Wing UAV in River Topographic Mapping
The application of fixed-wing UAVs in river topographic mapping generally involves two main phases: data acquisition and data processing. During the data acquisition phase, flight routes and altitudes are planned according to the specific survey requirements. The fixed-wing UAV then follows the predetermined flight path, using onboard high-resolution cameras or LiDAR sensors to capture images or point cloud data of the river area. In the data processing phase, three main steps are performed: image processing, point cloud processing, and terrain modeling. Through photogrammetry, terrain information is extracted from the acquired images. Point cloud processing involves filtering and classification of LiDAR data to generate accurate terrain point clouds. Finally, digital elevation models (DEM) and digital orthophoto maps (DOM) are constructed, providing fundamental geographic information for river management. In practice, a typical fixed-wing UAV river topographic mapping system consists of a UAV platform, mission payload, ground control station, and data processing software. System integration must ensure compatibility and coordination among these components to guarantee efficient survey missions.
3 Case Study
To validate the practical application of fixed-wing UAV aerial survey technology in river topographic mapping, we selected a typical section of the Huaihe River for empirical study.
3.1 Project Area Overview
The Huaihe River has historically served as the natural boundary between northern and southern China. It originates in the Tongbai Mountains of Henan Province, with a relatively steep gradient in the upper reaches and a gentle gradient in the middle and lower reaches. The main river channel is flanked by numerous lakes and depressions, and there are many tributaries, forming an asymmetric fan-shaped drainage pattern. The Anhui section of the Huaihe River lies in the middle reaches, stretching approximately 418 km with a basin area of 66,900 km², accounting for 35.8% of the total Huaihe River basin area. The survey area includes topographic features such as roads, power lines, communication lines, ponds, and buildings. The floodplain on both banks is flat, the river channel is relatively straight, and the levee tops are paved, making the area suitable for aerial photogrammetry.
3.2 Survey Workflow
The main survey workflow included the following steps: layout and acquisition of image control points, flight route planning, image acquisition, post-processed differential (PPK) data processing, aerial triangulation, 2D orthophoto production, 3D model production, digital line graphic (DLG) drawing, and accuracy verification. Among these, the key tasks were 3D model production and DLG generation.
3.2.1 Control Point Layout
Since the survey area is a strip-shaped region, we adopted a Z‑shaped control point layout, with two control points placed perpendicular to the strip boundaries and one control point in the middle of the strip. Additional control points were placed at turning points of the flight area and across wider floodplains. To ensure the accuracy of the 3D model, the spacing between control points was kept between 0.8 and 1.0 km. When selecting control points, we chose locations at intersections of linear features or at corners of distinct objects that were flat, stable, and clearly identifiable. In areas with few features, painted ground markers were used on hard surfaces, while fixed targets were deployed on non‑hard surfaces. The markers were larger than 70 cm in size. A total of 27 image control points were collected, with accuracy meeting the figure‑ground quality level. Their spatial positions and elevations were measured using GNSS RTK.
3.2.2 Aerial Photography Implementation and Image Acquisition
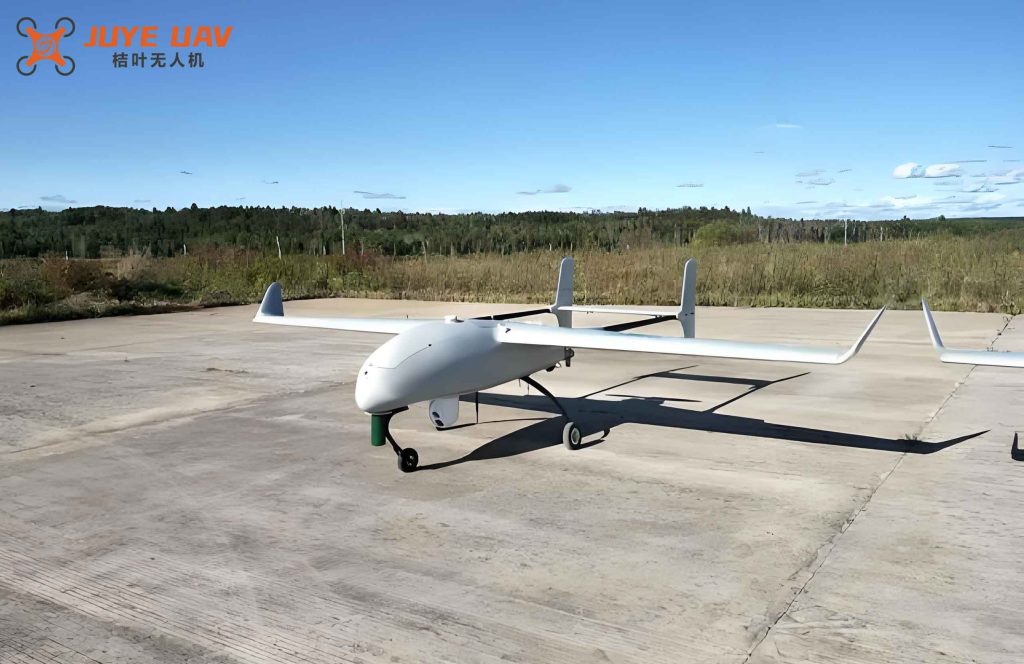
The total survey area was 11.71 km², with flat terrain. The flight was performed using a Zongheng CW‑15II vertical takeoff and landing (VTOL) fixed-wing UAV and its dedicated base station. The camera model was a CA103 full‑frame camera with an effective resolution of approximately 42.4 megapixels, a sensor size of 35.9 mm × 24.0 mm, and a lens focal length of 35 mm. To achieve the target 1:1,000 mapping accuracy and complete the survey in two flights, we selected a relative flight altitude of 300 m, a forward overlap of 70%, a side overlap of 65%, and a ground sampling interval (GSD) of 0.032 m. The figure below shows the fixed-wing UAV used in this project.
| Parameter | Value |
|---|---|
| UAV Model | Zongheng CW‑15II (fixed-wing UAV) |
| Camera | CA103 full‑frame (42.4 MP) |
| Focal Length | 35 mm |
| Relative Flight Altitude | 300 m |
| Forward Overlap | 70% |
| Side Overlap | 65% |
| Ground Sampling Interval (GSD) | 0.032 m |
| Number of Flights | 2 |
3.2.3 DOM and 3D Model Production
After the field flight, we downloaded the base station data, POS data, and mobile station data, and used the JOPPS software (provided by Zongheng) for PPK data processing. Once the POS data were processed, aerial triangulation was performed using DJI Terra software. After verification, the image control points were imported, and parameters for 2D orthophoto and 3D model generation were set. Finally, an optimization calculation was executed to produce the 2D orthophoto in TIFF format and the 3D model in OSGB format.
3.2.4 Digital Line Graphic (DLG) Drawing
The DLG was drawn using Cass_3D software, a plug‑in module for the South CASS platform developed by Guangdong South Digital Technology Co., Ltd. After the 3D model was built, we first used check points to verify the planimetric and elevation accuracy. Upon passing the check, we opened or created a .dwg file in South CASS, loaded the .xml model file via the “Open3D” icon in Cass_3D, and then used CASS drawing tools to directly collect the spatial coordinates and elevation information of terrain features to generate the digital line map.
3.3 Accuracy Analysis
3.3.1 Aerial Triangulation Quality Report
Aerial triangulation is the core step in photogrammetry. It establishes geometric constraints between images to compute 3D coordinates without relying on ground control points. In this project, we used the bundle block adjustment method, which is based on the least‑squares optimization algorithm. By adjusting camera positions, orientations, and 3D point coordinates, the reprojection error was minimized, thus improving the accuracy of the aerial triangulation. The measured ground control points were used to calibrate the results. From the output, the model had no voids or missing parts, and the texture was clear. The residuals of the ground control points were: dx = 0.008699 m, dy = 0.012098 m, dz = 0.007295 m. These results indicated that the planimetric and vertical mean errors of the aerial triangulation were within acceptable limits, and the model continuity met the requirements.
3.3.2 Accuracy Assessment
To ensure data reliability, we measured multiple check points in different terrain types using GNSS RTK. For each check point, five smooth measurements were taken in RTK fixed mode, and the average value was taken as the final measured coordinate. The differences between the field‑measured coordinates and the corresponding points extracted from the model were then analyzed. The mean square errors (MSE) were calculated using the following formulas:
$$
M_{xy} = \sqrt{\frac{1}{n}\sum_{i=1}^{n} \left( \Delta x_i^2 + \Delta y_i^2 \right)}
$$
$$
M_h = \sqrt{\frac{1}{n}\sum_{i=1}^{n} \Delta h_i^2}
$$
where $\Delta x_i$, $\Delta y_i$, and $\Delta h_i$ are the differences between the measured and model coordinates for the i‑th check point, and $n$ is the number of check points. Table 2 presents the check points and their disparities, while Table 3 summarizes the resulting mean errors.
| Point ID | Measured X (m) | Measured Y (m) | Measured H (m) | Model X (m) | Model Y (m) | Model H (m) | ΔX (m) | ΔY (m) | ΔH (m) |
|---|---|---|---|---|---|---|---|---|---|
| 1 | 3,603,515.40 | 463,567.61 | 21.29 | 3,603,515.40 | 463,567.60 | 21.31 | 0.00 | 0.01 | −0.02 |
| 2 | 3,603,546.08 | 463,808.42 | 21.68 | 3,603,546.08 | 463,808.42 | 21.73 | 0.00 | 0.00 | −0.05 |
| 3 | 3,603,430.08 | 464,014.67 | 29.40 | 3,603,430.07 | 464,014.68 | 29.41 | 0.01 | −0.01 | −0.01 |
| 4 | 3,603,604.71 | 464,231.05 | 21.68 | 3,603,604.73 | 464,231.03 | 21.69 | −0.02 | 0.02 | −0.01 |
| 5 | 3,605,138.79 | 468,264.57 | 21.47 | 3,605,138.79 | 468,264.57 | 21.42 | 0.00 | 0.00 | 0.05 |
| 6 | 3,602,803.36 | 464,993.36 | 22.31 | 3,602,803.37 | 464,993.38 | 22.30 | −0.01 | −0.02 | 0.01 |
| 7 | 3,603,328.45 | 466,820.05 | 28.00 | 3,603,328.44 | 466,820.06 | 28.03 | −0.01 | −0.01 | −0.03 |
| 8 | 3,604,102.37 | 465,432.18 | 23.15 | 3,604,102.38 | 465,432.16 | 23.18 | −0.01 | 0.02 | −0.03 |
| 9 | 3,605,784.56 | 467,098.73 | 25.62 | 3,605,784.55 | 467,098.74 | 25.59 | 0.01 | −0.01 | 0.03 |
| 10 | 3,602,540.21 | 464,512.89 | 20.95 | 3,602,540.20 | 464,512.87 | 20.98 | 0.01 | 0.02 | −0.03 |
| Component | Mean Square Error (m) |
|---|---|
| Planimetric (Mxy) | 0.021 |
| Vertical (Mh) | 0.032 |
From the statistical results, all ΔX and ΔY values were within 0.02 m, and all ΔH values were within 0.05 m. The computed planimetric mean square error was 0.021 m, and the vertical mean square error was 0.032 m, both of which satisfy the requirements for 1:1,000 scale topographic mapping (typically 0.25 m for planimetry and 0.15 m for elevation under Chinese national standards). This confirms that the fixed-wing UAV aerial survey technology can deliver the necessary accuracy for large‑scale river topographic mapping.
4 Discussion
The application of fixed-wing UAV technology in this project demonstrated several advantages. First, the fixed-wing UAV efficiently covered a linear strip area of 11.71 km² in just two flights, significantly reducing field labor time and operator workload compared to traditional ground survey methods. Second, the data acquisition was intuitive and comprehensive, with dense point clouds and high‑resolution imagery enabling detailed feature extraction. Third, the accuracy analysis confirmed that the obtained 3D models and DLGs met the required standards for 1:1,000 topographic mapping of hard‑surface open terrain. However, some limitations were noted. In areas with dense tree cover along the riverbanks or heavy vegetation on the floodplain, the fixed-wing UAV’s optical camera could not penetrate the canopy, requiring supplementary field surveys (patch surveys or manual mapping). Additionally, in complex terrain (e.g., steep slopes or urban structures), the accuracy of the 3D model may degrade due to occlusions or poor image matching. Future research could explore the fusion of fixed-wing UAVs with oblique photogrammetry, multispectral imaging, or LiDAR to overcome these limitations and enhance the diversity and value of survey products. Furthermore, the establishment of comprehensive regulations and standards for UAV operations will provide institutional support for the widespread adoption of fixed-wing UAVs in river topographic mapping.
5 Conclusion
This study systematically analyzed the application of fixed-wing UAV aerial survey technology in the topographic mapping of the Huaihe River and evaluated the resulting accuracy. The results demonstrate that the 3D model and digital line graphic produced using this technology are feasible and meet the accuracy requirements for 1:1,000 scale topographic mapping. The fixed-wing UAV approach significantly reduces field work time and labor intensity, improves efficiency, and shortens the production cycle. Data acquisition is intuitive and comprehensive, with fewer external disturbances. After engineering validation, the technique can satisfy the mapping requirements for exposed hard‑surface terrain at 1:1,000 scale. Nevertheless, for areas with large forested riverbanks and dense floodplain vegetation, supplementary measurements through patch surveys and sketching are necessary. Future work should focus on integrating fixed-wing UAVs with oblique photography, multispectral sensors, and LiDAR to further improve data accuracy under complex conditions and to expand the application value. The continued development of UAV regulations will pave the way for broader operational use of fixed-wing UAVs in river corridor surveys.