
In the global context of addressing climate change, the targets of “carbon peak and carbon neutrality” are accelerating the transition of the energy structure towards cleaner sources. Photovoltaic (PV) power generation, as a pivotal technology, is witnessing rapid deployment worldwide, increasingly in topographically complex areas such as mountainous and hilly regions. Managing construction progress in these environments presents significant challenges, including inefficient manual inspection, insufficient data accuracy, prominent safety risks, and imbalanced resource allocation. Based on my practical experience in overseeing a large-scale PV project in Xinjiang, I will elaborate on how we integrated UAV drone aerial photogrammetry, three-dimensional reality modeling, and spatial data analysis to establish a comprehensive digital management system, effectively overcoming these obstacles.
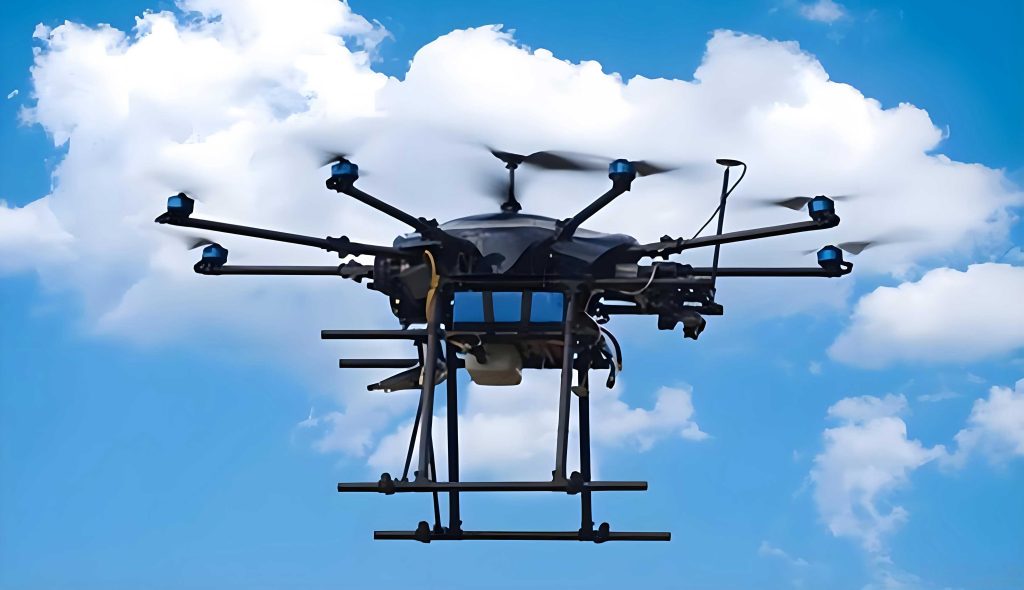
The core challenges in mountainous PV construction are systemic. Traditional survey and layout methods become highly inefficient; at our site, a single point measurement could take over 2 minutes. With over a million pile foundation points, manual surveying would require an enormous workforce and an impractical timeframe. Furthermore, multiple processes like piling, structure installation, and module laying often proceed concurrently in a fragmented manner across vast areas (management radii exceeding 20 km), making coordinated progress tracking and resource scheduling through periodic manual inspections nearly impossible. Data updates were lagging by a week or more, leading to decisions based on outdated information.
Limitations of Traditional Progress Management Modes
The “fragmented operation, multi-dimensional constraints” nature of mountainous PV construction exacerbates the drawbacks of traditional methods. Our analysis, supported by industry benchmarks, reveals several critical systemic defects:
- Efficiency Bottleneck: Manual inspection is severely limited by terrain. On slopes exceeding 25°, a single inspector can cover less than 0.3 km² per day. For a gigawatt-scale project, a full-coverage inspection could take over 45 days, failing to meet real-time monitoring needs. The cost of maintaining large inspection teams with off-road vehicles is prohibitive, and the data collection cycle remains fundamentally mismatched with the pace of construction.
- Data Accuracy Deficit: Reliance on paper-based records and manual entry leads to error rates typically between 8% and 15%. Miscounts in installed structures or modules directly translate to inaccurate progress reports, causing misguided procurement and logistical decisions that result in schedule delays and financial losses.
- Prominent Safety Risks: Complex terrain poses significant hazards to inspection personnel. Industry statistics indicate that inspection-related accidents account for a substantial portion of total incidents on such sites, including risks of falls, landslides, and vehicle accidents, especially in areas with geological fault zones.
- Extensive Resource Allocation: Resource scheduling based on lagging and inaccurate data inevitably leads to imbalances. Common issues include high machinery idle rates (often above 35%), excessive material re-handling (over 20%), and frequent work stoppages, all of which inflate project costs.
The UAV Drone-Based 3D Modeling Technology System
To address these challenges, we developed and implemented a UAV drone-centric technology system that integrates aerial photogrammetry, Geographic Information Systems (GIS), and 3D modeling algorithms. This system creates a closed-loop management process from “physical site” to “digital twin” to “decision support.”
Technical Framework and Key Modules
The system operates on three interconnected layers:
- Data-Driven Layer: UAV drones are deployed as the primary data acquisition tool. Flight parameters are meticulously planned and adjusted based on altitude and terrain to ensure data quality and operational safety. Data from UAV drones is synchronized with other sources like BIM design models and satellite imagery for macro-environmental context.
- Model Construction Layer: The imagery captured by UAV drones is processed using specialized software (e.g., DJI Terra) to generate high-precision 3D reality models. The process involves aerial triangulation, dense point cloud generation, mesh reconstruction, and texture mapping.
- Analysis and Decision Layer: The as-built 3D reality model is imported into a GIS platform (e.g., ArcMap) and compared against the as-designed BIM model. This enables automated calculation of key progress indicators and generation of visual analytics for management.
A critical operational aspect is configuring the UAV drones for different altitude zones, as performance varies with atmospheric conditions. The following table summarizes our adaptive strategy:
| Parameter | Zone A (1140-1400m) | Zone B (1400-1700m) | Rationale for Adjustment |
|---|---|---|---|
| Flight Altitude | 120 m | 100 m | Reduced lift in thinner air at higher altitude. |
| Cruise Speed | 10 m/s | 8 m/s | Enhanced stability against gusts (≥8 level). |
| Endurance per Sortie | 45 min (@0°C) | 35 min (@-5°C) | Battery capacity degrades at low temperatures. |
| Minimum Return Battery | 20% | 30% | Increased power consumption for return against wind. |
| Camera Shutter Speed | 1/500 s | 1/1000 s | Prevents overexposure from snow/module reflection. |
| Positioning Mode | Network RTK | Network RTK + Local Base | Reduces signal drift caused by ionospheric interference. |
The core output of this stage is a georeferenced 3D reality model. Its accuracy is paramount and is governed by the following relationship during processing. The overall model error ($E_{model}$) is a function of the georeferencing error ($E_{geo}$), the photogrammetric reconstruction error ($E_{photo}$), and the alignment error during BIM comparison ($E_{align}$):
$$E_{model} = \sqrt{E_{geo}^2 + E_{photo}^2 + E_{align}^2}$$
Our target was to maintain $E_{model}$ within ±3 cm planimetrically and ±5 cm vertically. To achieve this, we controlled $E_{geo}$ through RTK positioning, minimized $E_{photo}$ with high overlap rates and robust bundle adjustment, and reduced $E_{align}$ by using precise coordinate transformation parameters.
Key Technical Processes in Model Generation
The workflow from UAV drone imagery to an analyzable 3D model involves several steps: Image Import → Aerial Triangulation → Point Cloud Generation → Mesh Reconstruction → Texture Mapping → Model Optimization. Critical control points include:
- Aerial Triangulation: Using bundle adjustment to ensure control point errors are within 1/10,000 (planimetric) and 1/5,000 (vertical) of the flying height.
- Point Cloud Density: A minimum of 200 points per square meter is required to clearly discern details like structure columns and module frames.
- Model Attributes: The BIM design model must be enriched with specific attributes to enable intelligent comparison. Essential attributes are listed below.
| Component Type | Key Attributes | Required Data Precision |
|---|---|---|
| Mounting Structure | Type, Quantity, Coordinates | Coordinate error ≤ 10 cm |
| PV Module | Specification, String Configuration, Tilt Angle | Angle error ≤ 0.5° |
| Foundation/Pile | Diameter, Length, Coordinates | Coordinate error ≤ 3 cm |
Application Workflow for Construction Progress Management
1. Preliminary Planning and Model Preparation
Success hinges on meticulous planning. We designed a differentiated UAV drone inspection plan:
- Inspection Frequency: Dynamically adjusted based on the construction phase – daily for critical pile foundation work, every two days for structure installation, twice weekly for module laying, and weekly during final commissioning.
- Accuracy Targets: We established clear benchmarks: ≥95% automatic recognition rate for structures, ≥97% for modules, and ≥90% for foundations.
- Data Management: A cloud-based database with a “Time-Space-Activity” architecture was established for efficient storage and retrieval of all UAV drone-derived data.
2. On-site Data Acquisition and Model Generation
The operational loop begins with UAV drone deployment. A single inspection mission involves:
- Pre-flight: Site reconnaissance, obstacle mapping, and equipment check. Camera settings (ISO, shutter speed) are tuned for prevailing light conditions.
- In-flight: Execution of pre-planned “lawnmower” pattern flights with high image overlap (80% frontal, 70% side). Real-time monitoring of image feed and UAV drone status.
- Post-flight: Quick field check of image coverage and quality, followed by secure data transfer to processing servers.
The collected imagery is then processed to generate the current state’s 3D reality model, which is sliced and organized by sub-array for easier handling.
3. Progress Analysis and Dynamic Adjustment
This is where the value of UAV drone data is fully realized. In the GIS platform, we perform a multi-dimensional comparison:
- Spatial Comparison: The as-built 3D model is overlaid with the as-designed BIM model. Spatial difference analysis automatically highlights unbuilt areas. The progress status for each sub-array is calculated and visualized on a heat map, where color indicates deviation from schedule (e.g., red for >3 days behind).
- Temporal Comparison: Sequential 3D models from different weeks are compared. By calculating the volume or area difference of point clouds representing installed components, we quantify weekly progress increments. This allows for trend analysis and forecasting.
- Quantitative Analysis: The progress deviation ($D$) for a component type (e.g., modules) in a sub-array can be calculated as:
$$D = \frac{Q_{planned}(t) – Q_{actual}(t)}{Q_{planned}(t)} \times 100\%$$
where $Q_{planned}(t)$ is the cumulative planned quantity by day $t$, and $Q_{actual}(t)$ is the quantity identified from the latest UAV drone model. Based on $D$ and the project’s critical path, we can predict the impact on the overall deadline and estimate the required resource injection to recover. For instance, the additional labor ($L_{add}$) needed can be approximated by:
$$L_{add} = \frac{Q_{behind}}{P_{std} \times T_{rec}}$$
where $Q_{behind}$ is the backlog quantity, $P_{std}$ is the standard productivity rate per worker per day, and $T_{rec}$ is the desired recovery period.
Based on the analysis, we implemented a three-tiered response mechanism for dynamic resource adjustment:
- Level 1 (Alert: ≤3 days behind): Optimize within the sub-array (e.g., extend work hours).
- Level 2 (Urgent: 4-7 days behind): Mobilize resources from adjacent sub-arrays (e.g., redeploy installation teams).
- Level 3 (Critical: >7 days behind): Re-sequence sub-array construction schedule and allocate central reserve resources.
Quality Control and Safety Management
Ensuring the reliability of the UAV drone-based process is non-negotiable. We established stringent quality standards for both data and analysis.
| Quality Aspect | Standard Requirement | Verification Method |
|---|---|---|
| Image Quality | Ground Sampling Distance ≤ 3 cm/pixel, Shadow area < 15% | Software auto-detection + manual sampling |
| Geolocation Accuracy | Planimetric RMSE ≤ 5 cm, Vertical RMSE ≤ 8 cm | Comparison with RTK-surveyed ground control points |
| 3D Model Accuracy | Planimetric error ≤ 3 cm, Vertical error ≤ 5 cm | Measurement from model vs. field survey |
| Progress Analysis Accuracy | Automatic recognition rate ≥ 95% (structures), ≥ 97% (modules) | Manual audit of a statistically significant sample |
Safety and environmental sustainability were integral to our approach:
- UAV Drone Operational Safety: All operations complied with relevant aviation regulations. Pilots were certified, and strict protocols were followed for pre-flight checks, airspace awareness, and emergency procedures.
- Environmental Benefits: The use of electric UAV drones significantly reduced the carbon footprint compared to traditional fuel-powered inspection vehicles. We estimate a reduction of approximately 43.2 tonnes of CO₂ over the project lifecycle. Furthermore, precise progress management minimized material waste and re-handling, leading to savings of hundreds of tonnes of steel and other materials. Most importantly, UAV drone inspections drastically reduced the need for personnel to traverse sensitive terrain, cutting vegetation disturbance by an estimated 75% compared to traditional methods.
Conclusion and Future Outlook
In conclusion, the application of UAV drones, integrated with 3D modeling and spatial analytics, has proven transformative for managing construction progress in complex PV projects. The system we implemented delivered high-precision monitoring (with errors under 2.3%), enabled dynamic resource optimization, and enhanced safety and environmental stewardship. The tangible outcomes included potential project duration shortening by 15-20%, cost reductions of 12-18%, and a dramatic increase in management efficiency.
Looking forward, the potential for this technology is vast. The next evolution involves:
- Intelligent Enhancement: Integrating Artificial Intelligence and deep learning algorithms to push automatic component recognition accuracy closer to 99% and enable predictive analytics for even more proactive management.
- Multi-Technology Fusion: Creating a true “Sky-Ground” integrated digital twin by combining UAV drone data with IoT sensors (e.g., RFID for material tracking, smart meters) and satellite data streams for comprehensive project oversight.
- Sustainable Evolution: Advancing towards solar-powered UAV drones for extended, zero-emission inspection missions, further aligning the construction process with the green goals of the PV industry itself.
The digital management model centered on UAV drones provides a quantifiable and replicable solution, paving the way for smarter, more efficient, and more sustainable development in the global renewable energy sector.