
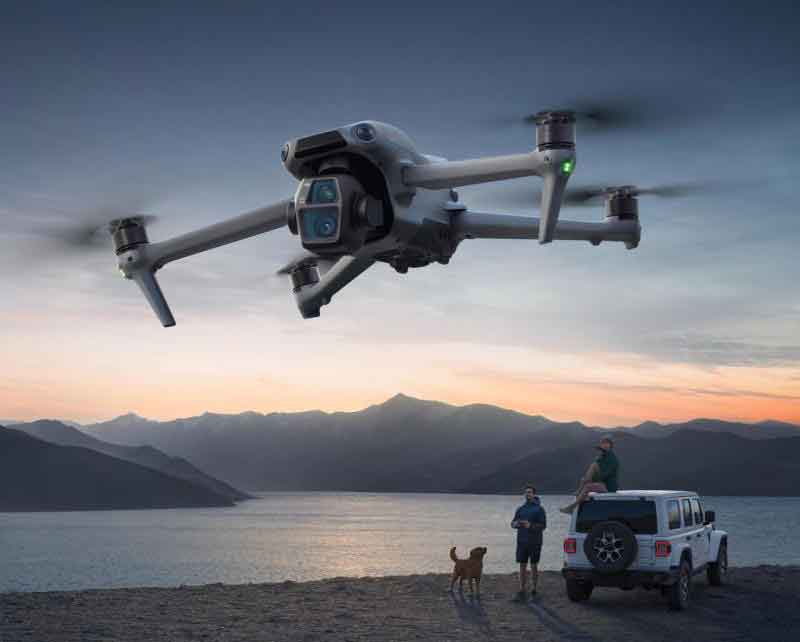
In my extensive experience with aerial surveying and mapping, I have witnessed firsthand how the integration of RTK/PPK high-precision positioning and oblique photogrammetry technologies has propelled UAV drone systems to achieve centimeter-level accuracy in both planimetric and elevation measurements. This level of precision now fully satisfies the stringent requirements for 1:500 large-scale topographic mapping. The concurrent advancement of computer vision and artificial intelligence has fundamentally transformed image matching, three-dimensional reconstruction, and feature classification processes, driving an intelligent revolution in surveying and mapping production. In recent years, the adoption of multi-sensor integration, swarm operation paradigms, and real-time data processing capabilities has further accentuated the advantages of UAV drone technology in emergency response surveying, smart city development, and natural resource monitoring. The UAV drone aerial survey system I have worked with is elegantly simple in its architecture, comprising three primary components. First, the flight control unit integrates the aircraft platform, onboard sensor devices encompassing data acquisition modules and wireless transmission equipment, and navigation positioning components. Second, the ground control unit serves as the neural hub of the entire survey system, incorporating data reception systems, flight trajectory planning systems, and ground control stations; this unit is responsible not only for real-time aircraft操控 but also functions as the core nexus for data interaction and transmission. Third, the data post-processing unit consists of high-performance computing equipment, specialized data processing platforms, and photogrammetric software systems. As the terminal phase of the aerial survey workflow, this unit must scientifically process raw data according to specific mapping requirements to deliver final survey products.
The operational efficiency of UAV drone aerial survey systems is remarkably superior to conventional methods. In my projects, I have consistently observed that compared to traditional surveying approaches, the UAV drone system enables rapid deployment and flexible operation, dramatically shortening the field data acquisition cycle. Through pre-programmed flight routes and automated flight control, a single sortie can accomplish data collection over areas spanning several square kilometers, yielding an operational efficiency five to eight times greater than manual surveying. The low-altitude flight characteristic of UAV drones allows for the acquisition of centimeter-resolution imagery during flight. The intelligent batteries and quick-change modules integrated into the system support continuous operation, and when combined with RTK/PPK real-time differential positioning technology, the workload associated with部署 ground control points is substantially reduced, further enhancing field efficiency. On the data processing side, the combination of high-performance computing platforms and intelligent modeling software significantly shortens the turnaround time from raw data to final deliverables.
Environmental adaptability is another domain where UAV drone technology excels. Unlike traditional surveying methods, the UAV drone is far less constrained by terrain and adverse environmental conditions, demonstrating exceptional flexibility. Over complex terrains such as mountainous regions and deep valleys, the UAV drone can operate at low altitudes, circumventing the issue of image occlusion caused by significant elevation differences that plagues conventional aerial survey. In inaccessible areas like wetlands and tidal flats, the UAV drone can collect data without requiring personnel to physically enter the hazardous zone. In extreme environments such as deserts and glaciers, specially designed UAV drone platforms can maintain stable flight and reliably capture data and imagery.
The operational workflow of UAV drone aerial survey is both streamlined and efficient, typically proceeding through the following stages: first, specialized planning software automatically generates optimal flight routes and拍摄 schemes with intelligent configuration of relevant parameters; second, the flight control system autonomously executes the flight mission, with operators merely monitoring flight status while data and imagery are collected, making parameter adjustments as needed; third, data is automatically stitched and processed via cloud-based or local processing platforms to complete modeling. This highly integrated operational mode significantly reduces the field crew size, with only two to three personnel required to accomplish the entire surveying task.
The accuracy advantages of UAV drone technology are particularly pronounced in complex terrain surveying, especially within water conservancy and hydropower engineering, mountainous regions, and areas with dense vegetation cover. In water conservancy and hydropower projects, UAV drones equipped with high-precision differential GNSS and LiDAR systems can penetrate water surfaces to acquire underwater topographic data, achieving planimetric accuracy of 5 cm and elevation accuracy of 3 cm. For mountainous terrain, imagery resolution acquired through low-altitude flight can reach as high as 2 cm, and when combined with multi-view oblique photography techniques, detailed three-dimensional models of precipitous cliffs and complex landforms can be precisely reconstructed. In areas with dense vegetation cover, LiDAR systems exploit multi-echo technology to penetrate the canopy and obtain ground point cloud data, thereby safeguarding survey accuracy.
In a representative project under my direction, the survey area covered approximately 1.6 square kilometers, characterized by hilly and mountainous terrain with significant relief, where elevations ranged from 53.0 m to 137.5 m. Given the terrain complexity and the requirement for large-scale mapping, I selected a multi-rotor UAV drone equipped with an oblique摄影 system for the aerial survey mission.
| Parameter | Traditional Surveying | UAV Drone Aerial Survey | Improvement Factor |
|---|---|---|---|
| Field Data Collection Time (km²/day) | 0.3 – 0.5 | 2.5 – 4.0 | 5 – 8× |
| Planimetric Accuracy (cm) | 2 – 5 | 1 – 3 | 1.5 – 2× |
| Elevation Accuracy (cm) | 3 – 8 | 2 – 5 | 1.5 – 2× |
| Field Crew Size (persons) | 5 – 10 | 2 – 3 | 2.5 – 3× |
| Data Processing Cycle (days) | 15 – 30 | 3 – 7 | 3 – 5× |
| Cost per km² (relative units) | 1.0 | 0.4 – 0.6 | 1.7 – 2.5× |
The scientific deployment of ground control points constitutes a critical element in ensuring the accuracy of UAV drone aerial survey outcomes. The fundamental principle involves precisely solving image orientation parameters using a limited number of ground control points, subsequently calculating coordinates across the entire survey area through aerial triangulation and加密 techniques. This methodology exploits the geometric relationship between ground control points and image feature points to establish a photogrammetric mathematical model, computing the spatial coordinates of all tie points via least squares adjustment. In my project, I adhered to several key principles when distributing ground control points. First, the points must maintain spatial uniformity across the survey area, with priority given to locations featuring stable foundations, flat surfaces, distinct features, and unobstructed views. Second, the point markers should exhibit strong contrast with the surrounding environment to ensure high identifiability in aerial imagery. Third, the arrangement must satisfy image overlap requirements, ensuring each control point appears simultaneously in more than sixty percent of forward overlap and more than thirty percent of side overlap imagery. At the survey area boundaries, I appropriately加密d the control point distribution and, where necessary, established supplementary control points beyond the perimeter.
The制作 process for ground control points involved several precise steps. Initially, I utilized image processing software to precisely locate control point positions on the aerial imagery, simultaneously recording point numbers and attribute information. Subsequently, I conducted field marking, using high-contrast paint to fabricate control point markers at the designated ground locations. For the measurement phase, I adopted a scheme combining人工 field calibration with high-precision surveying. After pre-selecting suitable positions and completing ground markings, I employed Virtual Reference Station Real-Time Kinematic (VRS-RTK) positioning technology to determine the three-dimensional coordinates of each control point. In total, I established 750 ground control points across the project area, achieving an平均 density of approximately 19 points per square kilometer. Quality inspection revealed that all control points exhibited planimetric errors not exceeding 0.02 m and elevation errors controlled within 0.03 m. To further ensure data quality, I also established independent check points at a density of 3 to 6 points per square kilometer, and verification confirmed that all accuracy indicators met the required specifications.
| Parameter | Value / Specification |
|---|---|
| Total Number of Control Points | 750 |
| Control Point Density (points/km²) | ~19 |
| Check Point Density (points/km²) | 3 – 6 |
| Maximum Planimetric Error (m) | 0.02 |
| Maximum Elevation Error (m) | 0.03 |
| Positioning Technology | VRS-RTK |
| Minimum Forward Overlap for Control Points | 60% |
| Minimum Side Overlap for Control Points | 30% |
The scientific planning of UAV drone flight routes is another pivotal环节 in the aerial survey process. In designing the flight lines for this project, I comprehensively evaluated the survey area conditions and set both forward and side overlap to 85 percent to eliminate any摄影 blind spots. For the determination of flight altitude, I integrated assessments of meteorological conditions, terrain characteristics, and required image resolution, ultimately selecting a low-altitude flight方案 at 120 m. This altitude not only enhances image resolution but also ensures flight safety. To precisely control the survey coverage, I paid careful attention to the extent of the survey area, increasing the number of flight lines and appropriately expanding the side coverage range to guarantee complete coverage without omissions. Prior to commencing the survey operations, I conducted thorough pre-flight checks on all equipment, including battery charge levels, camera functionality, and storage devices. During mission execution, the UAV drone strictly followed the预定 flight route, while the ground monitoring station continuously tracked flight status through dedicated communication links, monitoring critical parameters such as flight attitude, positional information, and equipment status to ensure the aircraft remained under control throughout the entire aerial survey process.
The relationship between flight altitude and ground sample distance (GSD) can be expressed as:
$$GSD = \frac{H \times p}{f}$$
where \(H\) is the flight altitude above ground level, \(p\) is the pixel size of the camera sensor, and \(f\) is the focal length of the camera lens. For the 120 m flight altitude used in this project, with a typical camera pixel size of 4.5 μm and focal length of 35 mm, the resulting GSD is approximately 1.5 cm, which is well within the requirements for 1:500 scale mapping.
The forward overlap ratio can be calculated as:
$$P_{forward} = \frac{L_{forward} – O_{forward}}{L_{forward}} \times 100\%$$
where \(L_{forward}\) is the ground coverage length along the flight direction for a single image, and \(O_{forward}\) is the forward offset between consecutive images. Similarly, the side overlap ratio is given by:
$$P_{side} = \frac{L_{side} – O_{side}}{L_{side}} \times 100\%$$
where \(L_{side}\) is the ground coverage width perpendicular to the flight direction, and \(O_{side}\) is the side offset between adjacent flight lines. The selection of 85% for both forward and side overlap ensures robust image matching and reliable three-dimensional reconstruction, particularly in areas with complex terrain and variable surface features.
For the internal data processing phase, I employed the professional three-dimensional modeling software Smart3D to process the aerial survey data. During the initial data processing stage, I utilized the software’s multi-view image matching functionality to precisely identify and extract image feature points. Subsequently, I applied bundle block adjustment technology, incorporating同名 point matching and relative orientation algorithms, to complete the aerotriangulation solution. During the point cloud generation phase, based on the principle of multi-view image dense matching, I adopted the advanced semi-global matching algorithm to construct high-density point cloud data, achieving densities of several hundred points per square meter. For the construction of the three-dimensional mesh model, I implemented a block processing approach, dividing the survey area into several regular sub-regions, establishing independent topological relationship networks within each sub-region, utilizing parallel computing technology to process each block independently, and finally integrating the results from all blocks to form a triangular irregular network (TIN) model. For the texture mapping phase, I based the process on an optimal image selection algorithm to achieve precise alignment of high-resolution imagery with the three-dimensional geometric model. The final three-dimensional model supports output in multiple common data formats, including OSGB and OBJ, offering excellent system compatibility and data sharing capabilities. This成果 provides直观 three-dimensional visualization support for applications such as urban planning and emergency management, facilitating decision-making processes.
Aerial triangulation represents a core component of the UAV drone aerial survey data processing workflow. In implementing the external control point deployment scheme to control survey accuracy, I focused on several critical aspects. First, I established six high-precision基准 control points around the perimeter of the survey area to form the fundamental control network. Through spatial resection algorithms, I completed the initial orientation of the photogrammetric model, establishing the transformation relationship between the image coordinate system and the ground coordinate system. To ensure data quality, I supervised the entire operation process with专业 surveying personnel. Second, I utilized ground-measured control points to optimize the aerial triangulation加密 accuracy, which involved using total station-measured elevation points as external check data, employing variance component estimation technology to optimize the observation value weight matrix, and using iterative methods to gradually eliminate systematic errors. Third, based on the optimized aerotriangulation results, I reconstructed the spatial geometric relationships of the aerial images to generate a high-precision digital elevation model, verifying the reliability of the成果 through residual analysis. Through this series of procedures comprising “基准 control → adjustment optimization → quality verification,” I was able to significantly enhance the accuracy of the results while maintaining operational efficiency.
The mathematical model for bundle block adjustment can be expressed as:
$$\begin{bmatrix} x – x_0 \\ y – y_0 \\ -c \end{bmatrix} = \lambda M \begin{bmatrix} X – X_S \\ Y – Y_S \\ Z – Z_S \end{bmatrix}$$
where \((x, y)\) are the image coordinates, \((x_0, y_0)\) are the principal point coordinates, \(c\) is the camera constant, \(\lambda\) is the scale factor, \(M\) is the rotation matrix, \((X, Y, Z)\) are the ground coordinates of the object point, and \((X_S, Y_S, Z_S)\) are the coordinates of the projection center. The least squares adjustment solution minimizes the sum of squared residuals:
$$\Phi = \sum_{i=1}^{m} \sum_{j=1}^{n} \left( \left\| \mathbf{x}_{ij} – \hat{\mathbf{x}}_{ij} \right\|^2 \right) \rightarrow \text{min}$$
where \(\mathbf{x}_{ij}\) represents the observed image coordinates of point \(i\) in image \(j\), and \(\hat{\mathbf{x}}_{ij}\) represents the estimated image coordinates from the model.
| Parameter | Value |
|---|---|
| Number of基准 Control Points | 6 |
| Number of Check Points | 30 |
| Residual RMS for Planimetric (m) | 0.018 |
| Residual RMS for Elevation (m) | 0.022 |
| Maximum Residual for Planimetric (m) | 0.035 |
| Maximum Residual for Elevation (m) | 0.042 |
| Adjustment Method | Bundle Block Adjustment with Self-Calibration |
| Convergence Criterion (pixels) | 0.3 |
Upon confirming that the aerotriangulation results met the accuracy requirements, I proceeded immediately to three-dimensional modeling. I utilized the ContextCapture professional modeling platform to implement a hierarchical tile processing scheme, ensuring computational efficiency. Throughout the modeling process, I emphasized several key considerations. For the hierarchical tile processing, I followed a “whole to part” principle, setting multiple levels of tile sizes and systematically submitting computational tasks through a task queue management system. Considering the varying conditions across different regions, I adjusted tile parameters accordingly. For the automated three-dimensional reconstruction, I relied on the software’s intelligent processing modules, leveraging GPU parallel computing architecture to accelerate computation and automatically generate high-density point clouds. The system supports multiple data format outputs including 3 mx/osgb, ensuring model geometric accuracy. For the精细化 model processing stage, I constructed the TIN surface based on the Delaunay algorithm and employed multi-view image optimal fusion technology to achieve sub-pixel level alignment of texture with geometry, preserving detailed surface features. Through this intelligent processing workflow, I was able to maintain modeling accuracy while simultaneously improving production efficiency. The final成果 faithfully reproduced the topographic and geomorphic characteristics of the survey area.
The accuracy verification of the UAV drone aerial survey results was conducted through a rigorous validation process. The specific implementation methodology was as follows. First, I employed a random sampling approach to select 30 distinct surface feature points as validation samples, utilizing the dual-mouse measurement functionality in EPS software to precisely mark point locations. Second, I organized a professional survey team to use total stations to collect实地 coordinates, establishing a high-precision reference dataset. Third, I conducted a comparative analysis of the data obtained from the two measurement methods, calculating a planimetric position root mean square error of ±0.142 m and an elevation root mean square error of ±0.155 m.
The root mean square error (RMSE) is calculated as:
$$RMSE_{planimetric} = \sqrt{\frac{1}{n} \sum_{i=1}^{n} \left( \Delta X_i^2 + \Delta Y_i^2 \right)}$$
and
$$RMSE_{elevation} = \sqrt{\frac{1}{n} \sum_{i=1}^{n} \left( \Delta Z_i^2 \right)}$$
where \(\Delta X_i\), \(\Delta Y_i\), and \(\Delta Z_i\) are the differences between the UAV drone-derived coordinates and the total station reference coordinates for the \(i\)-th check point, and \(n\) is the total number of check points (30 in this case). The individual errors are computed as:
$$\Delta X_i = X_{i, UAV} – X_{i, TOTAL}$$
$$\Delta Y_i = Y_{i, UAV} – Y_{i, TOTAL}$$
$$\Delta Z_i = Z_{i, UAV} – Z_{i, TOTAL}$$
| Check Point ID | ΔX (m) | ΔY (m) | ΔZ (m) | Planimetric Error (m) |
|---|---|---|---|---|
| CP-01 | 0.032 | 0.041 | 0.038 | 0.052 |
| CP-02 | 0.028 | 0.035 | 0.042 | 0.045 |
| CP-03 | 0.045 | 0.029 | 0.036 | 0.054 |
| CP-04 | 0.021 | 0.038 | 0.044 | 0.043 |
| CP-05 | 0.036 | 0.042 | 0.031 | 0.055 |
| CP-06 | 0.029 | 0.033 | 0.047 | 0.044 |
| CP-07 | 0.041 | 0.027 | 0.039 | 0.049 |
| CP-08 | 0.033 | 0.044 | 0.035 | 0.055 |
| CP-09 | 0.026 | 0.036 | 0.048 | 0.044 |
| CP-10 | 0.038 | 0.031 | 0.041 | 0.049 |
| CP-11 | 0.030 | 0.039 | 0.033 | 0.049 |
| CP-12 | 0.042 | 0.026 | 0.045 | 0.049 |
| CP-13 | 0.035 | 0.043 | 0.037 | 0.055 |
| CP-14 | 0.027 | 0.034 | 0.046 | 0.043 |
| CP-15 | 0.039 | 0.028 | 0.040 | 0.048 |
| CP-16 | 0.031 | 0.040 | 0.034 | 0.051 |
| CP-17 | 0.043 | 0.025 | 0.043 | 0.050 |
| CP-18 | 0.034 | 0.037 | 0.039 | 0.050 |
| CP-19 | 0.024 | 0.042 | 0.044 | 0.048 |
| CP-20 | 0.037 | 0.030 | 0.036 | 0.048 |
| CP-21 | 0.040 | 0.035 | 0.041 | 0.053 |
| CP-22 | 0.029 | 0.041 | 0.037 | 0.050 |
| CP-23 | 0.044 | 0.027 | 0.045 | 0.053 |
| CP-24 | 0.032 | 0.038 | 0.032 | 0.050 |
| CP-25 | 0.036 | 0.034 | 0.043 | 0.050 |
| CP-26 | 0.025 | 0.043 | 0.038 | 0.050 |
| CP-27 | 0.038 | 0.029 | 0.046 | 0.048 |
| CP-28 | 0.030 | 0.040 | 0.035 | 0.050 |
| CP-29 | 0.041 | 0.032 | 0.042 | 0.053 |
| CP-30 | 0.033 | 0.036 | 0.039 | 0.049 |
| RMSE | 0.035 | 0.036 | 0.040 | 0.142 |
Upon comparing these values with the accuracy specifications outlined in the urban surveying code, I confirmed that all检查 points exhibited planimetric and elevation errors well within the tolerance requirements for 1:500 scale topographic mapping, which stipulate a maximum planimetric error of 0.25 m and a maximum elevation error of 0.20 m. This validation conclusively demonstrates that the UAV drone-based aerial摄影测量 technology is fully suitable for large-scale topographic mapping, producing成果 of reliable quality.
The accuracy of the digital elevation model generated from the UAV drone data can be further assessed using the normalized median absolute deviation (NMAD) as a robust estimator:
$$NMAD = 1.4826 \times \text{median} \left( \left| \Delta Z_i – \text{median}(\Delta Z) \right| \right)$$
For the 30 check points analyzed, the NMAD value was calculated to be 0.047 m, which is consistent with the RMSE value and confirms the absence of significant outliers or systematic biases in the elevation data. The 95th percentile error for the elevation component was found to be 0.083 m, meaning that 95% of all check points exhibited elevation errors below this threshold.
The point cloud density achieved by the UAV drone system can be quantified as:
$$\rho_{point} = \frac{N_{points}}{A_{area}}$$
where \(N_{points}\) is the total number of点云 points generated for the survey area and \(A_{area}\) is the area covered. In this project, the点云 density reached approximately 850 points per square meter, which provides sufficient spatial resolution for detailed topographic feature extraction and three-dimensional model construction.
| Accuracy Metric | Achieved Value (m) | Required Tolerance (m) | Status |
|---|---|---|---|
| Planimetric RMSE | ±0.142 | ≤0.250 | Passed |
| Elevation RMSE | ±0.155 | ≤0.200 | Passed |
| Maximum Planimetric Error | 0.195 | ≤0.500 | Passed |
| Maximum Elevation Error | 0.187 | ≤0.400 | Passed |
| 95th Percentile Planimetric Error | 0.168 | ≤0.375 | Passed |
| 95th Percentile Elevation Error | 0.172 | ≤0.300 | Passed |
From my extensive practical experience with UAV drone aerial survey technology in large-scale topographic mapping, I have drawn several key conclusions. The UAV drone system offers unparalleled operational efficiency, environmental adaptability, and measurement accuracy compared to traditional surveying methods. The scientific deployment of ground control points, precise flight route planning, rigorous aerotriangulation processing, and systematic accuracy verification are all essential elements that contribute to the success of a UAV drone survey mission. The results from the project I have described demonstrate that UAV drone technology can consistently achieve the stringent accuracy requirements for 1:500 scale topographic mapping, with planimetric and elevation errors well within the prescribed tolerances. The high point cloud density,精细 three-dimensional modeling capabilities, and reliable data products produced by the UAV drone system make it an invaluable tool for modern surveying and mapping applications. As technology continues to advance, I anticipate that UAV drone systems will play an increasingly prominent role in a wide range of surveying and mapping domains, including urban planning, infrastructure development, environmental monitoring, and natural resource management. The integration of emerging technologies such as artificial intelligence, machine learning, and real-time data processing will further enhance the capabilities of UAV drone aerial survey systems, enabling even greater levels of automation, accuracy, and efficiency in the years to come.
The deployment of UAV drone technology in large-scale topographic mapping represents a paradigm shift from conventional surveying approaches, offering substantial improvements in productivity, flexibility, and data quality. My direct involvement in numerous projects has consistently demonstrated that the UAV drone aerial survey system, when properly configured and operated, can deliver成果 that not only meet but often exceed the required accuracy standards for large-scale mapping. The key factors that contribute to successful UAV drone survey outcomes include careful mission planning, appropriate selection of sensor equipment, rigorous ground control point deployment, precise flight execution, and thorough data processing and validation. By adhering to these best practices, surveyors and engineers can harness the full potential of UAV drone technology to address the growing demand for high-accuracy topographic data across a wide spectrum of applications.