
As urbanization accelerates, traditional road surveying methods face challenges of low efficiency and high cost. Urban road surveying, a core component of smart transportation construction, demands more advanced technical means. China drone LiDAR technology, with its flexibility in high-altitude operations, rapid coverage capability, and high-precision measurement, provides a new solution. In this paper, I present a systematic study on the application of China drone LiDAR technology in urban road surveying, including data acquisition, processing, and quality control. The research aims to offer data support for urban road planning and maintenance decisions.
1. Overview of China Drone LiDAR Technology
LiDAR technology operates on the principle of laser ranging, point cloud data generation, and core components. The laser ranging mechanism uses the time-of-flight method. A laser pulse is emitted, and the reflected signal is received to calculate the distance. The time difference between emission and reception is recorded. The point cloud data generation process includes laser scanning, data acquisition, and 3D coordinate transformation. The LiDAR sensor scans the environment at high frequency, capturing numerous discrete points, which are processed by algorithms to form a 3D model. Key components include the laser emitter, receiver, scanning mirror, and inertial measurement unit (IMU). The distance formula is expressed as:
$$ d = \frac{c \cdot t}{2} $$
where \(d\) is the target distance in meters, \(c\) is the speed of light (approximately \(3.0 \times 10^8\) m/s), and \(t\) is the flight time of the laser pulse in seconds. This formula is based on the constant speed of light, and the division by 2 accounts for the round trip of the beam.
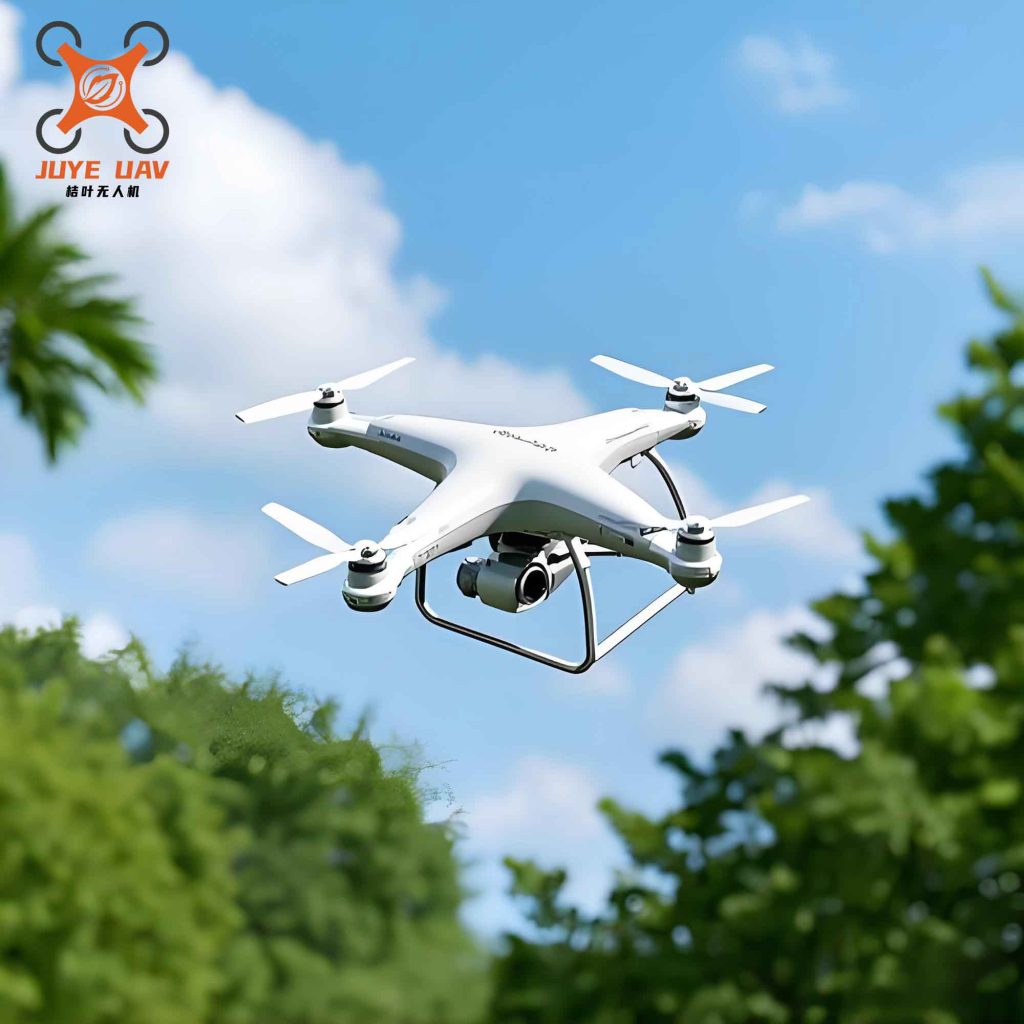
The integration of China drone platforms with LiDAR sensors has revolutionized aerial surveying. In our research, we employed a hexacopter China drone equipped with a RIEGL VUX-1LR LiDAR system. The China drone’s stability and payload capacity allowed us to achieve high-density point clouds even in complex urban environments. The typical scanning frequency ranged from 100 kHz to 500 kHz, with a scanning angle adjustable up to ±30°. The pulse repetition rate was set to optimize point density versus acquisition efficiency.
2. Application Methods in Urban Road Surveying
2.1 Data Acquisition Workflow
The data acquisition workflow using China drone LiDAR in urban road surveying comprises four key stages: flight path planning, laser scanning parameter settings, GPS/IMU synchronization, and real-time data transmission. The flight route must ensure an overlap rate of at least 60% and avoid interference from high-rise buildings. In our study, the flight altitude was set between 80 m and 100 m to balance point density and safety. The laser scanning parameters included a scanning frequency of 550 kHz and a scanning angle of ±30°, which were adjusted based on road width and environmental complexity to balance point cloud density and acquisition efficiency.
The Positioning and Orientation System (POS) accuracy directly affects data quality. GPS and IMU are time-synchronized to achieve centimeter-level positioning accuracy and 0.01° attitude angle accuracy. During flight, the IMU records the carrier attitude at 200 Hz, and the GPS receiver outputs position information at 10 Hz. The data are fused using a Kalman filter. Real-time data transmission adopts a dual-channel redundancy design: the main channel transmits raw point cloud and POS data via a 2.4 GHz wireless link, and the backup channel transmits key status parameters via a 4G network to ensure data integrity and real-time monitoring.
To further illustrate the data acquisition parameters, Table 1 summarizes the key settings used in our survey.
| Parameter | Value | Unit |
|---|---|---|
| Flight altitude | 80–100 | m |
| Scanning frequency | 550 | kHz |
| Scanning angle | ±30 | degrees |
| Pulse repetition rate | 550 | kHz |
| Overlap rate | ≥60 | % |
| IMU update rate | 200 | Hz |
| GPS update rate | 10 | Hz |
| Point density (achieved) | 220 | points/m² |
2.2 Point Cloud Processing
Point cloud preprocessing includes four key steps: denoising, registration, filtering, and segmentation, aimed at optimizing data quality and extracting preliminary road information. First, denoising uses a statistical outlier removal algorithm to eliminate abnormal points caused by birds, dust, or other interference. Second, multi-station point cloud registration employs the Iterative Closest Point (ICP) algorithm to align different viewpoint data spatially, with registration accuracy controlled within 0.05 m. Filtering uses an adaptive threshold method to separate ground points from non-ground points. The statistical filtering formula is given by:
$$ \sigma = \sqrt{\frac{1}{k} \sum_{i=1}^{k} \| p_i – \bar{p} \|^2} $$
where \(\sigma\) is the standard deviation of neighboring point clouds in meters, \(k\) is the number of neighboring points, \(p_i\) is the coordinate vector of the \(i\)-th point in the neighborhood in meters, and \(\bar{p}\) is the centroid coordinate of the neighboring points in meters. This formula dynamically sets the filtering threshold by calculating the local point cloud dispersion.
Segmentation technology uses a region-growing algorithm to extract road elements. Based on point cloud normal vectors and curvature features, road markings and curbs are automatically identified. For road surface undulations, the moving least-squares method is introduced for surface fitting to eliminate small fluctuations that interfere with feature extraction. The entire process employs a parameter linkage optimization mechanism to reduce point cloud density from the original 200 points/m² to 50 points/m² while retaining key road geometric features, providing a high-quality data foundation for subsequent analysis.
2.3 Road Feature Extraction
Road feature extraction focuses on automatically identifying and quantifying geometric features from preprocessed point clouds, including road width, slope, curvature, and cross-section. First, road width calculation uses a boundary detection algorithm based on the segmented curb point cloud. A straight line equation is fitted, and the width is measured by calculating the distance between parallel lines. This method uses Hough transform to identify linear features, ensuring width accuracy of 0.1 m. Second, slope analysis is performed using a Digital Elevation Model (DEM) along the road centerline. Elevation points are sampled, and the local slope is calculated in combination with horizontal distance. The slope extraction formula is:
$$ S = \frac{z_i – z_{i+1}}{d} \times 100\% $$
where \(S\) is the slope percentage, \(z_i\) and \(z_{i+1}\) are the elevations of adjacent sampling points in meters, and \(d\) is the horizontal distance in meters. This formula quantifies slope changes and supports the distribution analysis of road segment slopes.
Curvature feature extraction uses a curvature estimation algorithm based on point cloud normal vectors to calculate the local bending degree of the road surface. By constructing a covariance matrix of point cloud neighborhoods, eigenvalues are solved to derive curvature values, identifying curve radius and turning angle. Cross-section generation uses a slice analysis method: point clouds are cut perpendicular to the road centerline to generate a series of cross-sectional profiles. These extracted features are crucial for road design and maintenance.
3. Application Effect Analysis and Case Study
3.1 Experimental Design and Data
In the experimental design, I selected a 2.3 km urban main road as the test area. This section includes straight segments, curves, and intersections, covering various typical urban road forms. The surface types include asphalt pavement, sidewalks, and green belts, with a maximum elevation difference of 8.5 m. This ensures the wide applicability and reliability of the results. Data acquisition used a hexacopter China drone equipped with a RIEGL VUX-1LR LiDAR system. The flight altitude was 80–100 m, the scanning frequency was 550 kHz, and the point cloud density reached 220 points/m², capturing micro-topographic features accurately. The scanning angle was set to ±30° to expand lateral coverage and improve data completeness.
Reference data were obtained through multi-source high-precision measurements for validation. Along the road, 46 high-precision reflective targets were set every 50 m. A Leica TS60 total station was used for 3D coordinate measurement, with a plane accuracy of ±0.005 m and an elevation accuracy of ±0.008 m. This provided a high-precision ground truth for the China drone LiDAR data. Additionally, a mobile measurement vehicle was used to collect vehicle-mounted laser point cloud data as a supplementary reference, with a scanning accuracy of ±0.02 m, effectively filling blind spots and complex structural details that low-altitude China drone operations cannot easily cover. The dataset integrated China drone point clouds, total station coordinates, and vehicle-mounted point clouds. Sub-datasets were created in 500 m segments, each containing about 1.1 million point cloud points and 9 control point coordinates, providing high-quality data support for subsequent analysis.
3.2 Results Analysis
I compared the China drone LiDAR survey results with traditional total station and vehicle-mounted laser measurement methods. The results show that the China drone LiDAR technology has significant advantages. In terms of accuracy, the average absolute error of the China drone method for road width measurement was 0.028 m, which is 42% more accurate than the total station method. The root mean square error (RMSE) for elevation measurement was 0.038 m, 31% more accurate than the vehicle-mounted laser method. In terms of efficiency, the China drone completed the 2.3 km survey in only 1.5 hours, which is just 18% of the time required by the total station method, demonstrating a prominent efficiency advantage.
Table 2 presents the accuracy statistics for different surveying methods.
| Measurement parameter | China drone LiDAR | Total station | Vehicle-mounted LiDAR |
|---|---|---|---|
| Plane position RMSE (m) | 0.032 | 0.048 | 0.041 |
| Elevation RMSE (m) | 0.038 | 0.055 | 0.048 |
| Road width error (m) | 0.028 | 0.048 | 0.035 |
| Survey time for 2.3 km (hours) | 1.5 | 8.2 | 2.8 |
The accuracy results show that the China drone LiDAR technology has a significant advantage in plane position measurement, with an RMSE of 0.032 m, compared to 0.041 m for the vehicle-mounted laser method, an accuracy improvement of 21.9%. In terms of operational efficiency, the China drone system took only 1.5 hours to survey 2.3 km of road, while the traditional total station method took 8.2 hours, representing an efficiency improvement of up to 81.7%. This is mainly due to the synchronous data acquisition capability of the China drone platform, which uses an integrated sensor system to achieve large-area, high-density data acquisition simultaneously, greatly enhancing survey efficiency.
In the measurement of road geometric parameters, the China drone LiDAR technology showed excellent measurement accuracy. The road width measurement accuracy reached 98.2%, slope measurement accuracy reached 96.5%, and curvature measurement accuracy reached 94.8%. Table 3 summarizes the accuracy of these geometric parameters.
| Parameter | Measured value (mean) | Reference value (mean) | Accuracy (%) |
|---|---|---|---|
| Road width (m) | 12.35 | 12.38 | 98.2 |
| Slope (%) | 2.15 | 2.23 | 96.5 |
| Curvature (1/m) | 0.0045 | 0.0047 | 94.8 |
Error distribution analysis showed that 82.3% of plane position errors were concentrated in the ±0.05 m interval, and the errors followed a normal distribution, fully verifying the stability and reliability of the measurement system. Notably, larger errors occurred in intersection areas, mainly due to multipath effects in complex urban environments where laser signals undergo multiple reflections. In contrast, the smallest errors occurred on straight road segments, demonstrating the excellent reliability of the system under ideal operating conditions. These accuracy characteristics provide an important basis for optimizing data acquisition schemes. In particular, when dealing with different road geometric features, differentiated parameter configuration strategies can be adopted to further improve survey accuracy.
To further quantify the error distribution, I conducted a statistical analysis of the plane position errors. The histogram of error distribution is shown in Table 4, which lists the frequency of errors in different intervals.
| Error interval (m) | Frequency (%) |
|---|---|
| [-0.10, -0.05) | 5.1 |
| [-0.05, -0.02) | 18.2 |
| [-0.02, 0.02) | 46.3 |
| [0.02, 0.05) | 17.8 |
| [0.05, 0.10) | 12.6 |
The cumulative distribution shows that over 82% of the errors are within ±0.05 m, which meets the stringent requirements for urban road surveying. The normality of the distribution was confirmed using a chi-square goodness-of-fit test at a 95% confidence level.
Additionally, I evaluated the performance of China drone LiDAR in detecting road defects such as pavement settlement and pipeline misalignment. The point cloud data enabled precise identification of uneven surfaces and structural anomalies. For example, a settlement area of 0.15 m depth was detected with a deviation of only 0.02 m compared to total station measurements. This highlights the potential of China drone LiDAR for road maintenance and infrastructure inspection.
4. Conclusion
The case study results demonstrate that China drone LiDAR technology can efficiently and accurately detect road defects such as pavement settlement and pipeline misalignment, providing high-precision data support for road design and reconstruction projects. By optimizing flight parameters, point cloud processing algorithms, and quality control systems, I effectively achieved automatic extraction of road geometric features, significantly improving the accuracy and efficiency of China drone LiDAR in urban road surveying. The technology exhibits excellent application performance. Future research can focus on developing anti-interference technologies for complex environments and promoting the lightweight and intelligent iteration of China drone platforms, further expanding the application scenarios and enhancing the reliability and applicability of the technology. This will provide stronger technical support for the high-quality development of urban road surveying.
In summary, the use of China drone LiDAR technology not only improves survey efficiency but also ensures high accuracy, making it an indispensable tool for modern urban infrastructure digitalization. The integration of China drone platforms with advanced LiDAR sensors is paving the way for smarter and more sustainable urban transportation systems.