
The aerodynamic design and optimization of modern vertical take-off and landing (VTOL) unmanned aerial vehicles present significant challenges, particularly for hybrid configurations that combine rotary-wing and fixed-wing capabilities. Among these, the quad tilting rotor (QTR) configuration, often referred to as a sophisticated type of quadrotor drone, has garnered considerable interest. This quadrotor drone architecture utilizes four rotors that can tilt from a vertical position for hover and VTOL to a horizontal position for efficient, high-speed forward flight. This transition enables a unique blend of capabilities, including stationary surveillance and long-range cruise, making it ideal for applications like logistics, communication relay, and environmental monitoring in areas with limited infrastructure.
However, the aerodynamic interaction between components in a quadrotor drone with this “H” or “工”-shaped layout is highly complex and detrimental to overall performance. During cruise flight, the rear rotors operate within the combined slipstream of the forward rotors and the wake generated by the central wing. This interference leads to non-uniform inflow, altered local angles of attack, and ultimately, a degradation in the aerodynamic efficiency and thrust generation of the rear rotors. This can precipitate issues such as increased power demand beyond motor specifications and compromised flight stability. Understanding these interference mechanisms is therefore critical for the optimal design and performance prediction of such a quadrotor drone.
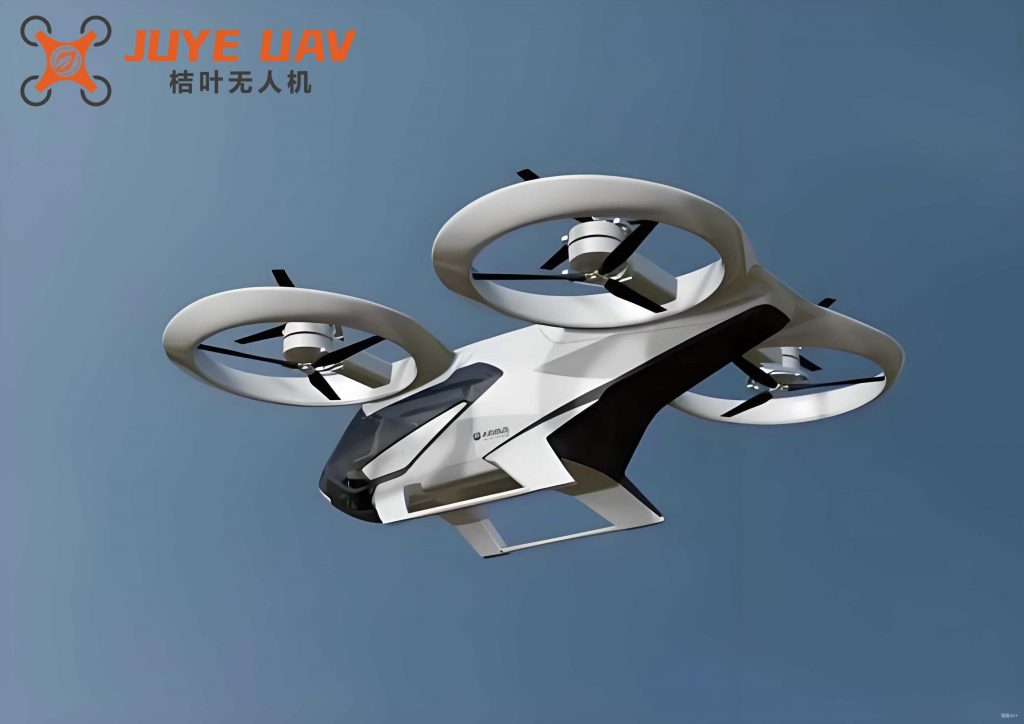
Previous research into tilt-rotor aerodynamics has laid important groundwork. Studies have confirmed that a wing can improve propeller efficiency under certain conditions. Investigations using simplified methods like the momentum source have analyzed the effects of rotor rotation direction, lateral spacing, and forward speed on overall aerodynamic characteristics. Other work has focused on defining transition corridors and analyzing power requirements. A common thread in many studies is the analysis of interactions in a propeller-wing configuration. However, the QTR quadrotor drone typically features a propeller-wing-propeller sequence on each side. The aerodynamic characteristics of this specific layout, especially under varying operational parameters like rotor collective pitch and wing geometry, remain less explored. Furthermore, many analyses assume fixed parameters, neglecting how changes in wing thickness or blade pitch angle alter slipstream characteristics and wing wake, thereby affecting the interference environment.
To address these gaps, this study employs high-fidelity Computational Fluid Dynamics (CFD) to conduct a comprehensive aerodynamic interference analysis of a quadrotor drone in its fixed-wing cruise mode. The primary objective is to elucidate the variation laws of rotor aerodynamic characteristics by systematically investigating the influence of key parameters, including forward flight speed, wing airfoil relative thickness, and rotor collective pitch angle.
Geometric Model and Numerical Methodology
Configuration and Parameters
The model of the quadrotor drone under investigation features a symmetrical “H” layout. The fuselage is positioned centrally, with a wing connecting the two sides. Two rotors are located on each side: one forward (T1, T3) and one aft (T2, T4) of the wing, all aligned along the same chordwise axis. To minimize aerodynamic interference from the tail surfaces with the complex rotor-wing flow field, a T-tail configuration is adopted. The primary geometric and operational parameters defining this quadrotor drone model are summarized in Table 1.
| Parameter | Value | Parameter | Value |
|---|---|---|---|
| Fuselage Length | 2.6 m | Rotor Radius | 0.28 m |
| Wingspan | 2.2 m | Rotor Twist Angle | 5° |
| Wing Incidence Angle | 6° | Rotor Collective Pitch | 10°, 15°, 20° |
| Rotor Solidity | 0.084 | Design Rotational Speed | 535 rps |
| Chordwise Rotor Spacing | 0.9 m | Lateral Rotor Spacing | 1.5 m |
The rotors employ the SIKORSKY SC1095 airfoil, common in rotorcraft applications. To assess the impact of wing geometry on the interference, three different NACA 4-series airfoils are used for the wing: NACA4412, NACA4415, and NACA4418, corresponding to relative thicknesses of 12%, 15%, and 18%, respectively.
Numerical Simulation Approach
To simulate the steady-state flow field around the rotating propellers within a static mesh framework, the Multiple Reference Frame (MRF) model is employed. The computational domain is divided into stationary regions (for the fuselage, wing, and empennage) and rotating regions enclosing each of the four rotors. An unstructured mesh is generated, with significant refinement applied within the rotating cylindrical domains to accurately capture the steep gradients in the rotor flow while maintaining computational efficiency. The interfaces between rotating and stationary zones are treated as frozen rotor interfaces, allowing for the transfer of flow properties.
The three-dimensional Reynolds-Averaged Navier-Stokes (RANS) equations are solved using the commercial CFD software ANSYS Fluent. The fluid is treated as incompressible air. The realizable k-ε turbulence model is selected for its robustness and accuracy in predicting complex flows with rotation and strong shear. The governing equations for turbulent kinetic energy (k) and its dissipation rate (ε) are:
$$ \rho \frac{Dk}{Dt} = \frac{\partial}{\partial x_i} \left[ \left( \mu + \frac{\mu_t}{\sigma_k} \right) \frac{\partial k}{\partial x_i} \right] + G_k + G_b – \rho \varepsilon – Y_M $$
$$ \rho \frac{D\varepsilon}{Dt} = \frac{\partial}{\partial x_i} \left[ \left( \mu + \frac{\mu_t}{\sigma_\varepsilon} \right) \frac{\partial \varepsilon}{\partial x_i} \right] + C_{1\varepsilon} \frac{\varepsilon}{k} (G_k + C_{3\varepsilon}G_b) – C_{2\varepsilon} \rho \frac{\varepsilon^2}{k} $$
where $\rho$ is the fluid density, $\mu$ is the molecular viscosity, $\mu_t$ is the turbulent viscosity, $G_k$ represents the generation of turbulent kinetic energy due to mean velocity gradients, $G_b$ is the generation due to buoyancy (neglected here), $Y_M$ represents the contribution of fluctuating dilatation, and $\sigma_k$, $\sigma_\varepsilon$, $C_{1\varepsilon}$, $C_{2\varepsilon}$, $C_{3\varepsilon}$ are model constants.
The key aerodynamic coefficients for analyzing rotor performance are defined as follows. The thrust coefficient $C_T$, torque coefficient $C_M$, and power coefficient $C_P$ are non-dimensional parameters given by:
$$ C_T = \frac{T}{\frac{1}{2} \rho n^2 D^4} $$
$$ C_M = \frac{M}{\rho n^2 D^5} $$
$$ C_P = \frac{P}{\rho n^3 D^5} = 2\pi C_M $$
where $T$ is rotor thrust, $n$ is rotational speed in revolutions per second, $D$ is rotor diameter, $M$ is rotor torque, $P$ is power, and $\rho$ is air density. The propeller efficiency $\eta$, which is the ratio of useful power to input power, is defined for forward flight as:
$$ \eta = \frac{T V_0}{P} $$
where $V_0$ is the forward flight speed.
Analysis of Rotor Aerodynamic Characteristics
Influence of Forward Flight Speed and Collective Pitch
After the transition from VTOL mode, the quadrotor drone operates in a high-speed cruise condition. The rotors are at their design rotational speed, and the collective pitch is set to maintain the required thrust for level flight. Simulations were conducted across a range of forward speeds ($V_0$) from hover (0 m/s) to 40 m/s, for three different collective pitch angles: 10°, 15°, and 20°.
The thrust coefficient $C_T$ for both front and rear rotors (e.g., T1 and T4 on one side) exhibits a clear trend of decreasing with increasing forward speed, as shown in the representative data in Table 2. This is expected, as the axial inflow through the rotor disk increases with forward speed, reducing the angle of attack and hence the lift produced by each blade element. Furthermore, at a constant rotational speed, increasing the collective pitch directly increases the blade angle of attack, leading to a higher thrust coefficient across all speeds, as evidenced by the higher values for the 20° pitch case.
| $V_0$ (m/s) | $C_{T1}$ (10°) | $C_{T1}$ (20°) | $C_{T4}$ (10°) | $C_{T4}$ (20°) |
|---|---|---|---|---|
| 0 | 9.8 | 24.5 | 9.1 | 22.8 |
| 10 | 7.2 | 18.1 | 6.5 | 16.3 |
| 20 | 5.1 | 12.8 | 4.3 | 10.9 |
| 30 | 3.4 | 8.6 | 2.8 | 7.0 |
| 40 | 2.1 | 5.3 | 1.6 | 4.1 |
A critical observation is that the thrust coefficient of the rear rotor (T4) is consistently lower than that of the corresponding front rotor (T1) on the same side, especially at higher collective pitches. This deficit is a direct manifestation of the aerodynamic interference. The rear rotor operates in a perturbed flow field consisting of the accelerated and swirling slipstream from the front rotor, superimposed on the wing wake. This combined inflow degrades the aerodynamic performance of the rear rotor blades.
Impact of Wing Airfoil Relative Thickness
The wing, situated between the front and rear rotors, plays a significant role in modulating the flow field encountered by the rear rotor. To isolate this effect, simulations were conducted with three wing airfoils of increasing relative thickness (12%, 15%, 18%) while keeping the collective pitch fixed at 20°.
The results, summarized in Table 3, demonstrate a clear trend: increasing the wing thickness adversely affects the thrust coefficient of the rear rotor ($C_{T4}$). For instance, at a forward speed of 20 m/s, increasing the thickness from 12% to 18% (a 6% increase in relative thickness) results in a decrease in $C_{T4}$ from approximately $11.5 \times 10^{-3}$ to $9.5 \times 10^{-3}$, corresponding to a reduction of about 17.4%.
| $V_0$ (m/s) | NACA4412 (12%) | NACA4415 (15%) | NACA4418 (18%) | % Reduction (12% to 18%) |
|---|---|---|---|---|
| 10 | 17.1 | 16.3 | 15.2 | -11.1% |
| 20 | 11.5 | 10.9 | 9.5 | -17.4% |
| 30 | 7.5 | 7.0 | 6.0 | -20.0% |
| 40 | 4.5 | 4.1 | 3.4 | -24.4% |
The physical mechanism behind this can be understood by examining the pressure fields. A thicker airfoil generally generates a stronger pressure field and a more pronounced wake due to increased displacement and pressure drag. The rear rotor ingests this thickened, low-energy wake, which contains regions of higher turbulence and reversed flow. This deteriorates the quality of the inflow to the rear rotor disk, particularly over its upper sections. The non-uniform inflow leads to sections of the rear rotor blades operating at less effective angles of attack, reducing their lift production and increasing profile drag. The net effect is a lower net thrust and higher required torque for the rear rotor of the quadrotor drone.
Quantification of Front Rotor Slipstream Interference
To directly quantify the level of interference exerted by the front rotor on the rear rotor, a differential thrust coefficient $\Delta C_T$ is defined. This parameter represents the thrust deficit of the rear rotor compared to the front rotor on the same side, normalized to account for speed and geometric effects:
$$ \Delta C_T = C_{T,\text{front}} – C_{T,\text{rear}} $$
Where $C_{T,\text{front}}$ and $C_{T,\text{rear}}$ are the thrust coefficients of the front and rear rotors on one side (e.g., T1 and T4). A larger $\Delta C_T$ indicates stronger adverse interference on the rear rotor. The variation of $\Delta C_T$ with forward speed for the three wing configurations is a key indicator of the interference dynamics, as shown in Table 4.
| $V_0$ (m/s) | NACA4412 | NACA4415 | NACA4418 |
|---|---|---|---|
| 0 | 1.70 | 1.72 | 1.75 |
| 9 | 2.55 | 2.48 | 2.42 |
| 18 | 5.35 | 5.25 | 5.10 |
| 27 | 4.80 | 4.72 | 4.65 |
| 36 | 2.10 | 2.05 | 2.00 |
The data reveals a non-monotonic trend. At very low speeds (near hover), $\Delta C_T$ is relatively small. As forward speed increases to a moderate range (peaking around 18 m/s in this study), $\Delta C_T$ reaches its maximum value, around $5.3 \times 10^{-3}$. This indicates that the interference effect is most severe in this speed regime. This phenomenon can be explained by the competing effects of slipstream geometry and dynamic pressure. At low speeds, the front rotor’s slipstream contracts significantly and is strongly deflected downward, partially missing the rear rotor disk. As speed increases, the slipstream becomes more aligned with the freestream and its cross-section expands, enveloping a larger portion of the rear rotor. Simultaneously, the swirl component from the front rotor imparts a tangential velocity to the inflow of the rear rotor, altering its effective blade angles of attack. The combination of these accelerated, swirling, and non-uniform inflows peaks in its detrimental effect at a specific forward speed.
At higher cruise speeds (beyond ~22 m/s), $\Delta C_T$ decreases sharply. This is because the relative magnitude of the slipstream-induced velocities becomes smaller compared to the high freestream velocity. The rear rotor operates increasingly in a flow field dominated by the clean freestream, with the slipstream perturbation becoming a smaller fraction of the total inflow. Consequently, the differential performance between the front and rear rotors diminishes.
Rotor Efficiency in Cruise
The ultimate metric for a propulsion system in cruise is its efficiency. The propeller efficiency $\eta$ for both front and rear rotors was calculated across the speed range. The results, presented in Table 5, show a characteristic trend: efficiency is very low at hover (where $V_0=0$ makes the useful power term zero), rises to a peak at a specific forward speed, and then gradually declines.
| $V_0$ (m/s) | Front Rotor $\eta$ (%) | Rear Rotor $\eta$ (%) |
|---|---|---|
| 8 | 35.2 | 33.1 |
| 18 | 52.8 | 49.5 |
| 28 | 58.6 | 56.8 |
| 38 | 55.0 | 53.9 |
The peak efficiency for the front rotor in this configuration occurs at approximately 28 m/s, reaching 58.6%. The rear rotor’s peak efficiency is slightly lower (56.8%) and may occur at a marginally different speed, reflecting the penalty due to interference. The initial rise in efficiency is due to the increasing useful power ($T V_0$) as speed increases from zero, while the power absorbed $P$ does not increase as rapidly. The subsequent decline at higher speeds is attributed to the increasing dominance of profile power losses and the fact that the rotor is operating at an off-design, low-thrust condition where induced power is low but profile power remains significant. The speed at which peak efficiency occurs represents the optimal cruise speed for the propulsion system of this quadrotor drone, balancing thrust requirement and power loss mechanisms.
Discussion and Design Implications
The comprehensive analysis presented highlights the complex, multi-parameter nature of aerodynamic interference in a tilt-rotor quadrotor drone. The findings have direct implications for the design and operation of such vehicles.
Firstly, the identification of a speed regime where front-rotor slipstream interference is maximized is crucial. For the studied configuration, operating in the speed range of 15-22 m/s leads to the largest performance disparity between front and rear rotors. This could have consequences for control allocation and motor sizing. Designers might choose to size the rear motors with a higher power margin or implement control strategies that account for the asymmetric thrust capabilities. Alternatively, mission profiles could be planned to minimize prolonged operation in this sensitive speed band during transition or low-speed cruise.
Secondly, the strong negative influence of wing thickness on rear rotor performance suggests a trade-off in wing design. While a thicker wing may offer structural benefits (e.g., fuel volume, spar depth) or better low-speed aerodynamic characteristics (higher maximum lift coefficient), it comes at the cost of propulsive efficiency for the rear rotors. In the design of a quadrotor drone prioritizing cruise efficiency, thinner airfoils or aerodynamic shaping to minimize wake strength (e.g., careful contouring, winglets) would be beneficial for the rear rotor stations.
Finally, the data on rotor efficiency pinpoints the optimal cruise speed for the propulsion system. To maximize the overall endurance and range of the quadrotor drone, the flight control and mission planning systems should aim to maintain level flight close to this peak efficiency speed, which for this model is around 28-30 m/s. Operating significantly faster or slower will incur an efficiency penalty, reducing flight time or payload capacity.
Conclusion
This study has conducted a detailed numerical investigation into the rotor aerodynamic interference characteristics of a tilt-rotor quadrotor drone during high-speed cruise flight. By employing the MRF method and systematically varying key parameters—forward flight speed, rotor collective pitch, and wing airfoil relative thickness—the following principal conclusions are drawn:
1. The thrust coefficient for all rotors decreases with increasing forward flight speed. Under identical conditions, the rear rotors consistently generate less thrust than the front rotors due to aerodynamic interference, with the deficit being more pronounced at higher collective pitch angles.
2. The geometry of the intervening wing significantly impacts rear rotor performance. Increasing the wing airfoil relative thickness strengthens the wing wake, which degrades the quality of inflow to the rear rotor. An increase in relative thickness from 12% to 18% was found to reduce the rear rotor thrust coefficient by approximately 17-24%, depending on forward speed.
3. The interference effect from the front rotor slipstream, quantified by the thrust coefficient difference $\Delta C_T$, varies non-linearly with forward speed. It is relatively low at hover, increases to a maximum at a moderate forward speed (around 18 m/s for this model), and then decreases rapidly at higher cruise speeds. This indicates that the most severe interference occurs during the early acceleration phase of cruise, not at maximum speed.
4. The propeller efficiency curve for this quadrotor drone configuration exhibits a clear peak. The front rotor achieved a maximum efficiency of 58.6% at approximately 28 m/s, while the rear rotor efficiency was slightly lower due to interference losses. This peak defines the most efficient cruise speed for the propulsion system.
These findings provide valuable insights for the aerodynamic design, performance prediction, and operational optimization of advanced hybrid quadrotor drone configurations. Future work could extend this analysis to dynamic transition phases, investigate the effects of rotor rotation direction pairing, and explore active flow control strategies to mitigate the adverse interference effects on the rear rotors.