
In the era of intelligent agriculture, we are witnessing a transformative shift towards data-driven farming practices. Among the pivotal technologies, agricultural Unmanned Aerial Vehicles (UAVs), commonly known as drones, have emerged as a cornerstone for enhancing efficiency, precision, and sustainability in crop production. In this paper, we explore the extensive applications of agricultural UAVs in farmland mapping and crop growth monitoring, drawing from our research and field experiences. We systematically examine the technological frameworks, operational workflows, and analytical methods that underpin these applications, emphasizing the integration of multi-sensor data and advanced processing algorithms. Our aim is to provide a comprehensive overview that highlights the capabilities of agricultural UAVs while addressing current challenges and future directions. We believe that the widespread adoption of agricultural UAVs is instrumental in building robust digital agriculture management systems, enabling farmers and agronomists to make informed decisions based on real-time, high-resolution spatial information.
The advent of agricultural UAVs has revolutionized traditional approaches to land surveying and crop assessment. Historically, farmers relied on manual scouting, satellite imagery with limited resolution, or ground-based sensors that were often time-consuming and labor-intensive. These methods frequently resulted in delayed insights and incomplete spatial coverage, hindering timely interventions. In contrast, agricultural UAVs offer a paradigm shift: they enable rapid, cost-effective, and high-frequency data acquisition over vast and inaccessible areas. We have observed that the flexibility of UAV platforms—whether multi-rotor, fixed-wing, or hybrid designs—allows for tailored deployments based on field size, terrain complexity, and specific monitoring needs. By leveraging technologies such as high-precision Global Navigation Satellite Systems (GNSS), inertial measurement units (IMUs), and a suite of imaging sensors, agricultural UAVs facilitate detailed mapping of field boundaries, topography, and crop health parameters. This paper delves into these aspects, beginning with an overview of the technological ecosystem of agricultural UAVs, followed by in-depth discussions on mapping and monitoring applications. We also incorporate tabular summaries and mathematical formulations to crystallize key concepts, ensuring that the content is both informative and actionable for stakeholders in the agricultural sector.
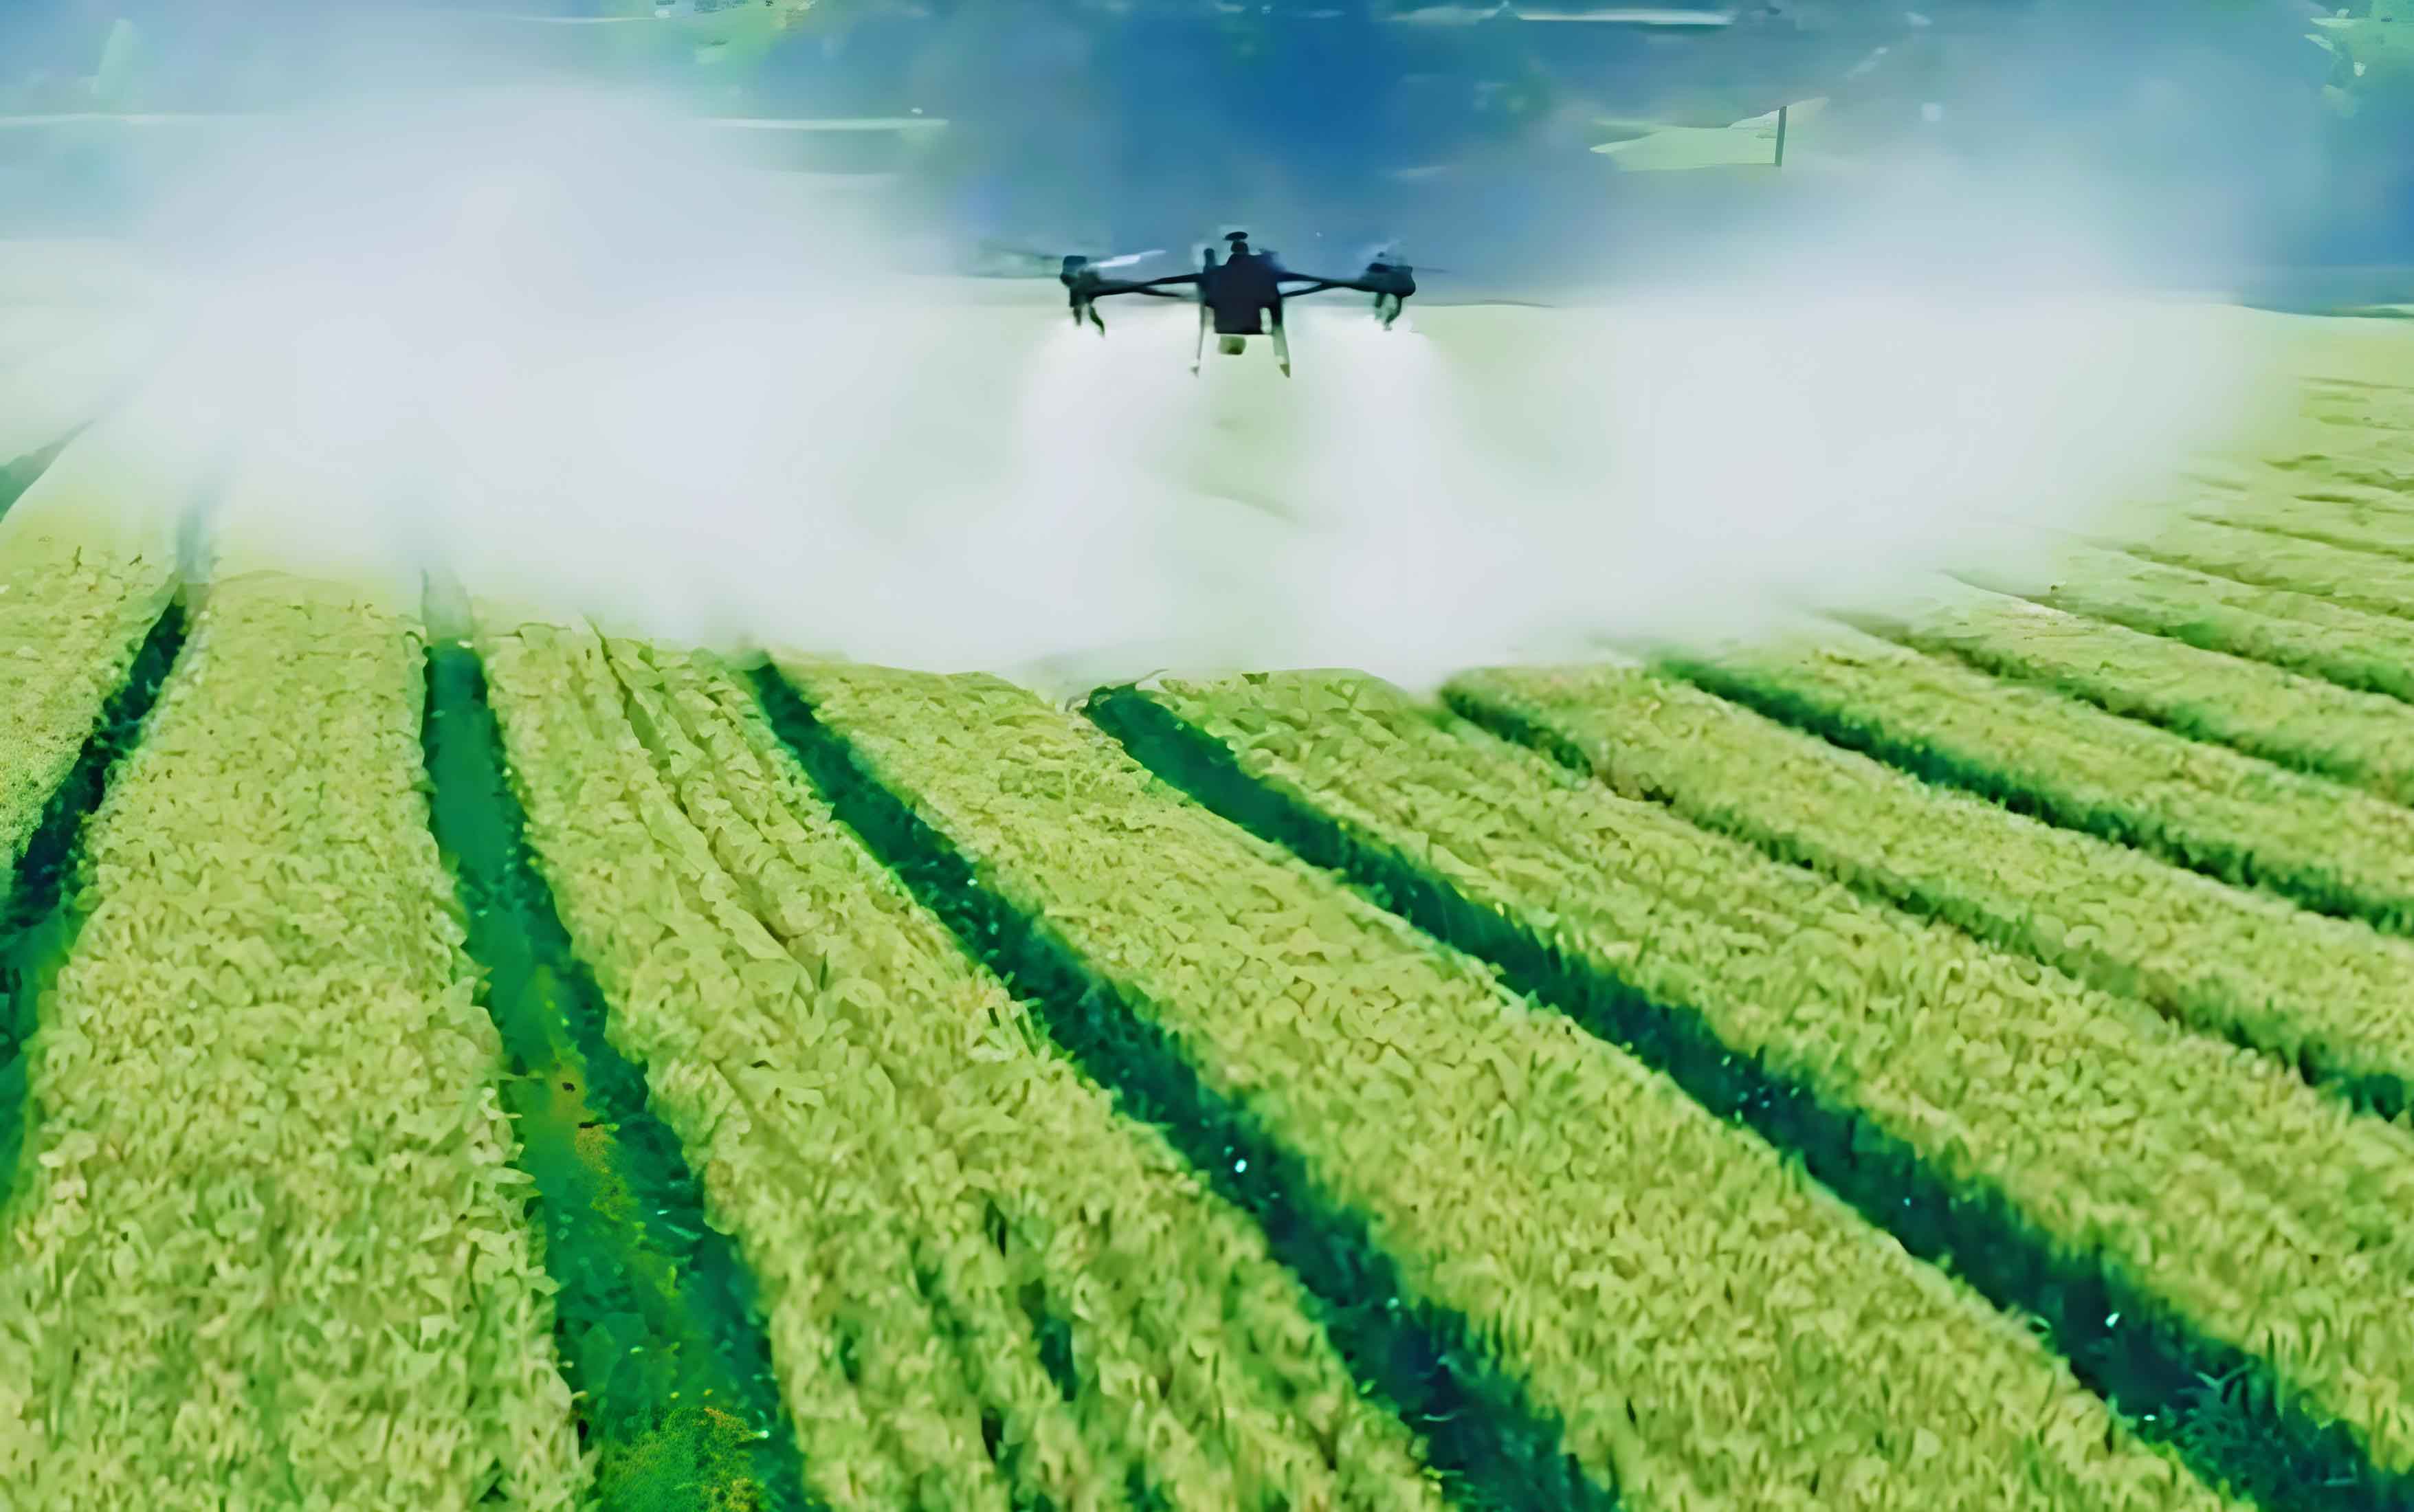
To fully appreciate the role of agricultural UAVs, we must first understand their technical configurations and operational foundations. Agricultural UAVs are broadly categorized into three primary types, each with distinct advantages suited to different agricultural tasks. Multi-rotor UAVs, typically equipped with four to eight rotors, are renowned for their vertical take-off and landing (VTOL) capabilities, hover stability, and maneuverability. We find them ideal for small to medium-sized fields, detailed crop inspections, and targeted applications such as spot spraying. Fixed-wing UAVs, resembling miniature airplanes, excel in covering large expanses due to their longer flight endurance and higher speeds. In our operations, we deploy fixed-wing agricultural UAVs for extensive mapping missions over hundreds of hectares in a single flight, making them cost-effective for regional surveys. Hybrid or vertical take-off and landing (VTOL) UAVs combine the benefits of both, offering vertical launch and landing with efficient forward flight, thus bridging the gap between flexibility and range. The choice of platform depends on factors like field size, resolution requirements, and budget, but all share the common goal of enhancing data collection efficiency.
Beyond the airframe, the payload of sensors defines the utility of an agricultural UAV. We equip these platforms with various imaging devices to capture diverse agronomic data. The table below summarizes the primary sensor types, their functionalities, and typical application scenarios in agriculture.
| Sensor Type | Primary Function | Key Applications in Agriculture |
|---|---|---|
| Visible Light (RGB) Camera | Captures high-resolution red, green, and blue band images for visual interpretation. | Field boundary delineation, crop stand counting, visual assessment of plant health, and documentation of field conditions. |
| Multispectral Camera | Measures reflectance across specific narrow bands (e.g., red, green, blue, red-edge, near-infrared). | Calculation of vegetation indices (e.g., NDVI, NDRE), nutrient status monitoring, early stress detection, and yield prediction. |
| Thermal Infrared Camera | Detects surface temperature variations by capturing long-wave infrared radiation. | Identification of water stress zones, irrigation scheduling optimization, detection of disease hotspots, and monitoring of microclimates. |
| Hyperspectral Camera | Acquires reflectance data across hundreds of contiguous narrow spectral bands. | Detailed biochemical analysis (e.g., chlorophyll, nitrogen content), species discrimination, and detection of subtle physiological changes. |
| Light Detection and Ranging (LiDAR) | Generates precise 3D point clouds by emitting laser pulses and measuring return times. | High-resolution digital elevation model (DEM) generation, canopy height measurement, biomass estimation, and terrain analysis for drainage planning. |
We emphasize that the integration of these sensors on a single agricultural UAV platform enables multi-faceted data collection, often in a single flight mission. For instance, a UAV can simultaneously capture RGB, multispectral, and thermal imagery, providing a holistic view of crop status. The data from these sensors are complementary; while multispectral data reveal photosynthetic activity, thermal data indicate transpiration rates, together offering insights into plant water use efficiency. In our work, we frequently use such multi-sensor setups to correlate different stress factors, thereby improving diagnostic accuracy.
The operational workflow for deploying agricultural UAVs in mapping and monitoring is systematic and involves several critical stages. We outline a generalized process that we follow in our projects:
- Mission Planning: We use ground control software to define the survey area, set flight parameters, and plan autonomous flight paths. Key parameters include flight altitude (H), which directly influences ground sampling distance (GSD), and overlap rates. For robust image stitching and 3D reconstruction, we typically set forward overlap (Of) between 70% and 80% and side overlap (Os) between 60% and 70%. The flight altitude is calculated based on desired GSD using the formula:
$$ \text{GSD} = \frac{H \times \text{sensor pixel size}}{\text{focal length}} $$
For example, to achieve a GSD of 5 cm with a camera having a pixel size of 4.4 µm and a focal length of 10 mm, the flight altitude H would be approximately 114 meters. We also incorporate ground control points (GCPs) or use Real-Time Kinematic (RTK)/Post-Processed Kinematic (PPK) GNSS systems to achieve geolocation accuracy within centimeters. - Automated Flight and Data Acquisition: The agricultural UAV executes the pre-programmed flight autonomously, capturing images or sensor data at specified intervals. Onboard GNSS and IMU systems record precise position and orientation data for each capture, essential for subsequent georeferencing. We ensure that environmental conditions—such as wind speed, lighting, and cloud cover—are within operational limits to maintain data quality.
- Data Processing and Analysis: Post-flight, we process the raw data using specialized software like Pix4Dfields, Agisoft Metashape, or DJI Terra. The processing pipeline includes image alignment, point cloud generation, orthomosaic production, and digital surface model (DSM) creation. For multispectral data, we calculate vegetation indices. A fundamental index is the Normalized Difference Vegetation Index (NDVI), expressed as:
$$ \text{NDVI} = \frac{\text{NIR} – \text{Red}}{\text{NIR} + \text{Red}} $$
where NIR and Red represent the reflectance in near-infrared and red bands, respectively. NDVI values range from -1 to 1, with higher values indicating healthier, denser vegetation. We also derive other indices like the Soil Adjusted Vegetation Index (SAVI) to minimize soil background effects:
$$ \text{SAVI} = \frac{(\text{NIR} – \text{Red}) \times (1 + L)}{\text{NIR} + \text{Red} + L} $$
where L is a soil brightness correction factor, typically set to 0.5 for agricultural settings. - Interpretation and Decision Support: The processed outputs—orthomosaics, DEMs, and index maps—are imported into Geographic Information System (GIS) platforms for spatial analysis. We generate prescription maps for variable rate application (VRA) of inputs like fertilizers and pesticides, directly linking UAV-derived insights to farm machinery. This closes the loop from data collection to actionable intelligence, a core tenet of precision agriculture.
In the realm of farmland mapping, agricultural UAVs have set new benchmarks for accuracy, efficiency, and detail. We identify several key technical requirements that these systems must meet to be effective. First, high spatial resolution and geodetic precision are paramount. For tasks such as land parcel registration, boundary disputes, or precision planting, centimeter-level accuracy is often necessary. We achieve this by employing RTK/PPK-enabled agricultural UAVs, which reduce reliance on numerous GCPs while maintaining positional errors within ±5 cm. Second, operational efficiency must be high to cover large areas swiftly. A fixed-wing agricultural UAV can typically survey 100–200 hectares per hour, depending on flight altitude and speed, drastically reducing time compared to terrestrial surveys. Third, automated data processing is essential to handle the voluminous imagery generated. We leverage cloud-based platforms and machine learning algorithms to accelerate tasks like image stitching and feature extraction. Lastly, the ability to fuse multi-source data—combining optical, thermal, and LiDAR datasets—enables comprehensive land characterization, from surface conditions to subsurface drainage patterns.
The mapping workflow with agricultural UAVs is meticulous and can be encapsulated in a step-by-step procedure. We illustrate this with a focus on boundary extraction and area computation, critical for land management and subsidy administration. After acquiring high-resolution orthomosaics, we extract field boundaries using either manual digitization in GIS software or automated algorithms. For automation, we employ edge detection techniques like the Canny algorithm or deep learning models such as U-Net for semantic segmentation. Once boundaries are delineated as vector polygons, we calculate the area using the shoelace formula for polygons with n vertices (xi, yi):
$$ A = \frac{1}{2} \left| \sum_{i=1}^{n} (x_i y_{i+1} – x_{i+1} y_i) \right| $$
where (xn+1, yn+1) = (x1, y1). This formula provides precise area measurements even for irregularly shaped fields. We validate accuracy by comparing UAV-derived areas with ground truth measurements, typically finding discrepancies of less than 1%, which is acceptable for most administrative and agronomic purposes.
Three-dimensional terrain modeling is another forte of agricultural UAVs, particularly beneficial for drainage planning and soil conservation. By processing overlapping images with Structure from Motion (SfM) algorithms or using LiDAR data, we generate digital elevation models (DEMs) that reveal subtle topographic variations. From a DEM, we compute slope (θ) and aspect, which influence water flow and erosion risk. The slope in degrees at any point is derived from the partial derivatives of elevation (z) with respect to x and y coordinates:
$$ \theta = \tan^{-1} \left( \sqrt{ \left( \frac{\partial z}{\partial x} \right)^2 + \left( \frac{\partial z}{\partial y} \right)^2 } \right) $$
We often classify slopes into categories (e.g., 0–2% for flat, 2–5% for gentle) to guide land use decisions. For drainage analysis, we apply hydrological tools in GIS to delineate watersheds, identify flow accumulation areas, and design optimal drainage channels. This proactive approach mitigates waterlogging risks and enhances irrigation efficiency. The table below contrasts UAV-based 3D modeling with traditional survey methods, underscoring the advantages of agricultural UAVs.
| Aspect | UAV-Based 3D Modeling | Traditional Surveying (e.g., Total Station) |
|---|---|---|
| Data Collection Speed | Very high; covers hectares per hour. | Slow; labor-intensive point-by-point measurement. |
| Spatial Resolution | High; can achieve sub-centimeter detail. | Low to medium; limited by point density. |
| Output Types | Orthomosaic, DEM, DSM, 3D point cloud. | Primarily 2D coordinates or contour lines. |
| Cost Efficiency | High for large areas; lower per-unit-area cost. | High for small areas; cost scales with area. |
| Adaptability to Terrain | Excellent; easily covers rough or inaccessible terrain. | Poor; requires physical access to points. |
Multi-temporal monitoring with agricultural UAVs enables the tracking of land use and crop dynamics over time. By conducting repeated flights at different growth stages or across seasons, we capture changes in vegetation cover, cropping patterns, and even illegal land conversions. We analyze time series of NDVI or other indices to assess crop phenology, detect anomalies, and evaluate the impact of management practices. For instance, a sudden drop in NDVI might indicate pest infestation or nutrient deficiency, prompting immediate scouting. We also employ change detection algorithms, such as image differencing or classification comparison, to quantify alterations in field boundaries or crop types. This capability is invaluable for compliance monitoring, yield forecasting, and adapting to climate variability. In our projects, we have used multi-temporal UAV data to map the expansion of irrigation systems or the recovery of degraded lands, providing evidence for sustainable land management.
Transitioning to crop growth monitoring, agricultural UAVs equipped with remote sensing sensors offer unparalleled insights into plant physiology and health. The principle hinges on the interaction of electromagnetic radiation with plant tissues. Healthy leaves, rich in chlorophyll, absorb most red light (around 660 nm) for photosynthesis but reflect strongly in the near-infrared (NIR, 700–900 nm) due to leaf internal structure. This contrast forms the basis of vegetation indices like NDVI, as mentioned earlier. However, we extend beyond NDVI to more sophisticated indices tailored to specific crops and conditions. For example, the Red-Edge Chlorophyll Index (CIred edge) is sensitive to chlorophyll content and less saturated at high biomass:
$$ \text{CI}_{\text{red edge}} = \frac{\text{NIR}}{\text{Red-edge}} – 1 $$
where Red-edge is reflectance around 720 nm. Similarly, for water stress assessment, we use the Crop Water Stress Index (CWSI) derived from thermal imagery, which normalizes canopy temperature against air temperature and vapor pressure deficit. These indices, when calibrated with ground truth data (e.g., leaf area index, soil moisture), enable quantitative monitoring of crop status.
We deploy agricultural UAVs for routine scouting to identify spatial variability within fields. By generating zonation maps based on vegetation vigor or stress indicators, we guide variable rate applications, ensuring that inputs are placed where they are most needed. This not only optimizes resource use but also minimizes environmental impact. For instance, in a case study on wheat fields, we used UAV-derived NDVI maps to create prescription maps for nitrogen fertilization, resulting in a 15% reduction in fertilizer usage while maintaining yield. Additionally, thermal imaging from agricultural UAVs helps pinpoint irrigation inefficiencies. We often detect “hot spots” in fields where plants are under water stress, allowing for targeted irrigation adjustments. The integration of multispectral and thermal data further refines stress diagnosis; for example, combined low NDVI and high canopy temperature may confirm drought stress, whereas low NDVI with normal temperature might indicate nutrient deficiency or disease.
Despite these advancements, we recognize that the deployment of agricultural UAVs faces several technical and operational bottlenecks. First, data management and processing remain challenging due to the large volumes of high-resolution imagery. While software tools have improved, processing times can be lengthy, and the expertise required for analysis may be a barrier for end-users. We are addressing this by developing automated pipelines that leverage cloud computing and artificial intelligence (AI) to streamline workflows. Second, sensor calibration and data standardization are critical for consistent multi-temporal analysis. Variations in illumination, atmospheric conditions, and sensor performance can introduce noise. We advocate for the use of radiometric calibration targets and robust normalization techniques to enhance data comparability. Third, regulatory frameworks and flight restrictions in some regions limit operational scope, especially near airports or populated areas. Engaging with authorities to establish clear guidelines for agricultural UAV operations is essential. Lastly, battery life and payload capacity constrain flight duration and the number of sensors that can be carried simultaneously. We are optimistic about advancements in battery technology and hybrid power systems that will extend flight times.
Looking ahead, we foresee several trends shaping the future of agricultural UAVs. Integration with other data sources, such as satellite imagery and Internet of Things (IoT) soil sensors, will create multi-scale monitoring systems. AI and machine learning will play a growing role in automated feature recognition, predictive modeling, and decision support. For example, deep learning algorithms can be trained to detect specific weeds or diseases directly from UAV imagery, enabling real-time alerts. Moreover, the development of swarm robotics, where multiple agricultural UAVs collaborate autonomously, could revolutionize large-scale farming operations. Standardization efforts for data formats and interoperability will facilitate the creation of agricultural digital twins—virtual replicas of farms that simulate outcomes under different management scenarios. We believe that as costs decrease and user-friendliness improves, agricultural UAVs will become ubiquitous tools for farmers worldwide, democratizing access to precision agriculture technologies.
In conclusion, our exploration underscores the transformative potential of agricultural UAVs in modern farming. These platforms have proven indispensable for high-precision farmland mapping, offering efficient solutions for boundary delineation, topographic modeling, and change detection. In crop growth monitoring, they provide rich, spatially explicit data on plant health, water status, and stress factors, enabling proactive and precise management. While challenges related to data processing, standardization, and regulations persist, ongoing technological innovations are steadily overcoming these hurdles. We are confident that agricultural UAVs will continue to evolve, integrating more seamlessly with farm management systems and contributing to the overarching goals of sustainable intensification and food security. By embracing these tools, the agricultural sector can harness the power of data to optimize productivity, conserve resources, and build resilience against environmental uncertainties. The journey toward fully autonomous, intelligent farming is well underway, with agricultural UAVs at its forefront.