In recent years, the frequent occurrence of natural disasters such as earthquakes, landslides, and tsunamis worldwide has highlighted the critical need for efficient emergency response systems. In disaster-stricken areas, communication and transportation links are often severed, making traditional ground or air transport methods challenging and hazardous. Vertical Take-Off and Landing (VTOL) unmanned aerial vehicles (UAVs) have emerged as a vital solution for rapid disaster relief and material delivery, owing to their ability to operate independently of runways and navigate over complex terrains like mountains, forests, rivers, and contaminated zones. These VTOL UAVs can transport concentrated supplies directly to affected points, ensuring timely aid. However, the performance of VTOL UAVs is heavily constrained by aerodynamic efficiency, particularly in terms of drag reduction, stability, and energy consumption during high-speed forward flight. To address these challenges, we focus on the aerodynamic design and optimization of a four-axis VTOL jet-powered UAV, utilizing computational fluid dynamics (CFD) simulations to analyze and enhance its aerodynamic characteristics. This study aims to develop a VTOL UAV with improved maneuverability, payload capacity, and dynamic response, ultimately reducing operational costs and increasing mission effectiveness in demanding environments.
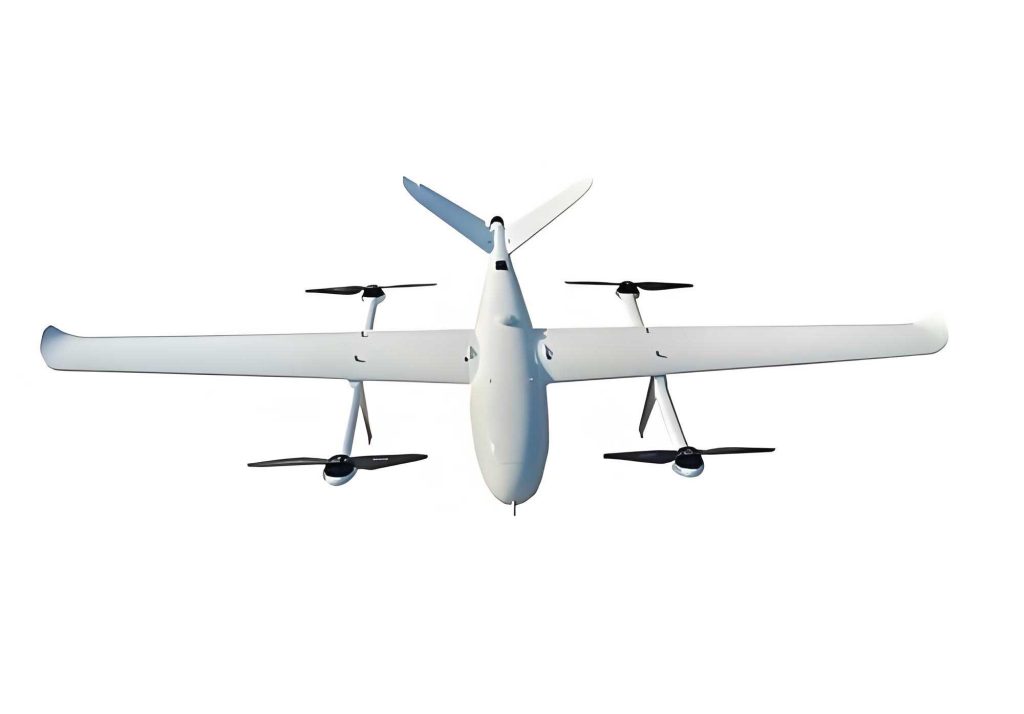
The VTOL UAV designed in this research is a novel four-axis jet-powered aircraft intended for high-load, high-mobility transport applications. Its structure integrates four key modules: a propulsion module driven by four micro brushless turbojet engines arranged in a quad configuration and mounted on jet支架; a pose control module using servos and a four-link mechanism to adjust the nozzle direction of弧形喷管 for thrust vector control, enabling precise attitude and directional adjustments; a fuel storage and delivery module housed within the fuselage, comprising a fuel tank, pump, and ECU controller for extended flight endurance; and an aerodynamic streamlining module that employs an air-guiding exterior design supported by an internal frame to enhance flight stability and reduce energy consumption. The overall parameters of the VTOL UAV are summarized in the table below, highlighting its specifications for efficient operation.
| Parameter | Value |
|---|---|
| Overall Length | 1.32 m |
| Overall Width | 0.73 m |
| Overall Height | 0.32 m |
| Total Mass | 20 kg |
| Maximum Forward Speed | 10 m/s |
| Vertical Ascent Speed | 2 m/s |
| Effective Payload Mass | 60 kg |
| Maximum Flight Time | 30 min |
| Nozzle Rotation Angle | 60° |
| Single Engine Thrust | 21 kg |
To facilitate aerodynamic analysis, the VTOL UAV model was simplified by removing non-essential features such as the landing gear, which has a negligible impact on flight dynamics when retracted. The simplified geometry, treated as a single cohesive body, ensures accurate CFD simulations without compromising the representation of key aerodynamic surfaces. This approach streamlines the mesh generation process and enhances computational efficiency while preserving the essential flow characteristics around the VTOL UAV.
The aerodynamic performance of the VTOL UAV was evaluated using CFD simulations based on the fundamental equations of fluid mechanics and turbulence modeling. For incompressible flow at constant density, the governing equations include the continuity equation, momentum equations, and Bernoulli’s equation, expressed as:
Continuity equation:
$$\frac{\partial v_x}{\partial x} + \frac{\partial v_y}{\partial y} + \frac{\partial v_z}{\partial z} = 0$$
Momentum equations (Navier-Stokes):
$$\frac{\partial \mathbf{v}}{\partial t} + (\mathbf{v} \cdot \nabla) \mathbf{v} = \mathbf{f} – \frac{1}{\rho} \nabla p + \nu \nabla^2 \mathbf{v}$$
where $\mathbf{v}$ is the velocity vector, $\rho$ is density, $p$ is pressure, $\nu$ is kinematic viscosity, and $\mathbf{f}$ represents body forces.
Bernoulli’s equation for steady, incompressible flow along a streamline:
$$g z + \frac{p}{\rho} + \frac{v^2}{2} = \text{constant}$$
where $g$ is gravitational acceleration, $z$ is elevation, and $v$ is flow speed.
Given the high Reynolds number (on the order of $10^6$) characteristic of the VTOL UAV in flight, turbulence effects are significant. We employed the standard $k$-$\varepsilon$ turbulence model, which solves transport equations for turbulent kinetic energy $k$ and its dissipation rate $\varepsilon$. The equations are:
$$\frac{\partial (\rho k)}{\partial t} + \frac{\partial (\rho k u_i)}{\partial x_i} = \frac{\partial}{\partial x_j} \left[ \left( \mu + \frac{\mu_t}{\sigma_k} \right) \frac{\partial k}{\partial x_j} \right] + G_k + G_b – \rho \varepsilon – Y_M + S_k$$
$$\frac{\partial (\rho \varepsilon)}{\partial t} + \frac{\partial (\rho \varepsilon u_i)}{\partial x_i} = \frac{\partial}{\partial x_j} \left[ \left( \mu + \frac{\mu_t}{\sigma_\varepsilon} \right) \frac{\partial \varepsilon}{\partial x_j} \right] + C_{1\varepsilon} \frac{\varepsilon}{k} (G_k + C_{3\varepsilon} G_b) – C_{2\varepsilon} \rho \frac{\varepsilon^2}{k} + S_\varepsilon$$
Here, $\rho$ is fluid density, $t$ is time, $u_i$ are velocity components, $\mu$ is dynamic viscosity, $\mu_t$ is turbulent viscosity, $\sigma_k$ and $\sigma_\varepsilon$ are turbulent Prandtl numbers for $k$ and $\varepsilon$, $G_k$ represents generation of $k$ due to mean velocity gradients, $G_b$ is generation due to buoyancy, $Y_M$ accounts for compressibility effects, $S_k$ and $S_\varepsilon$ are user-defined source terms, and $C_{1\varepsilon}$, $C_{2\varepsilon}$, $C_{3\varepsilon}$ are empirical constants. This model effectively captures the turbulent flow features around the VTOL UAV, essential for accurate drag and pressure predictions.
The computational domain for the VTOL UAV simulation was defined as a “virtual wind tunnel” to balance accuracy and computational cost. Based on typical wind tunnel blockage ratios of 5–8%, a hexahedral domain with dimensions 5.0 m (length, X-direction), 2.5 m (width, Y-direction), and 1.0 m (height, Z-direction) was established, resulting in a blockage ratio of 7.2% relative to the UAV’s frontal area of 0.18 m². The domain boundaries included an inlet face with prescribed velocity, an outlet face with pressure outlet conditions, and four wall faces with slip conditions. The VTOL UAV surface was treated as a no-slip wall to simulate viscous effects.
Mesh generation was performed using ICEM CFD software, employing a hybrid unstructured strategy to handle the complex geometry of the VTOL UAV. The surface mesh comprised triangular elements on the domain boundaries and quadrilateral elements on the UAV surface with four boundary layers (growth rate 1.1) to resolve near-wall flow gradients. The volume mesh was filled with tetrahedral cells, with local refinement around critical regions such as the engine nozzles to capture flow details accurately. The final mesh consisted of approximately 13.9 million cells, with a minimum quality of 0.3, ensuring reliability for CFD analysis. The table below summarizes the mesh statistics and quality metrics.
| Mesh Parameter | Value |
|---|---|
| Total Cells | 13,902,000 |
| Surface Triangles | ~500,000 |
| Boundary Layers | 4 layers |
| Growth Rate | 1.1 |
| Minimum Quality | 0.3 |
| Refinement Zones | Nozzle regions |
CFD simulations were conducted using the ANSYS Fluent solver with pressure-based formulation. The boundary conditions set for the VTOL UAV analysis included: air as the fluid with density $\rho = 1.293 \, \text{kg/m}^3$, dynamic viscosity $\mu = 1.79 \times 10^{-5} \, \text{Pa·s}$, and inlet velocity of 10 m/s in the X-direction to simulate forward flight at maximum speed. The turbulence model was the standard $k$-$\varepsilon$ with enhanced wall treatment, and the SIMPLE algorithm with second-order upwind discretization was employed for pressure-velocity coupling. Convergence was monitored via residuals falling below $10^{-5}$, and the drag coefficient stabilized after 300 iterations, yielding an initial value of 0.165 for the VTOL UAV.
The simulation results provided detailed insights into the aerodynamic behavior of the VTOL UAV. The pressure distribution on the UAV surface revealed a high-pressure region at the nose (maximum 68.1 Pa) due to flow stagnation, followed by a low-pressure zone on the upper surface (minimum -93.8 Pa) caused by flow separation at a sharp curvature. The lower surface exhibited a suction peak near the head, leading to significant kinetic energy loss. The jet支架 regions showed complex pressure patterns with negative pressures inside镂空 structures, increasing drag. Velocity vector plots indicated flow acceleration up to 13.76 m/s at separation points and large velocity gradients, while turbulent kinetic energy contours highlighted high energy dissipation at the nose lower edge and tail vortex regions. These findings are summarized in the table below, which quantifies the aerodynamic parameters across key surfaces.
| Surface Region | Maximum Pressure (Pa) | Maximum Velocity (m/s) | Turbulent Kinetic Energy (m²/s²) |
|---|---|---|---|
| Nose | 68.1 | 13.76 | 12.73 |
| Upper Surface | -93.8 | 13.01 | 9.90 |
| Lower Surface | -85.5 | 12.50 | 11.31 |
| Tail | 45.2 | 8.49 | 7.78 |
| Jet支架 | -60.3 | 14.20 | 10.61 |
To improve the aerodynamic performance of the VTOL UAV, we implemented several design optimizations based on the simulation analysis. The modifications included: reducing the angle of the upper front surface to minimize flow separation; adopting a curved profile at the nose to smooth airflow attachment; replacing the镂空 jet支架 with enclosed designs to reduce pressure differentials; and tapering the tail upper edge while using curved transitions on both edges to weaken vortex formation. These changes aimed to lower drag, enhance pressure distribution, and decrease turbulent energy losses. The optimized VTOL UAV was re-simulated under identical conditions, and the results showed a significant reduction in total drag coefficient from 0.165 to 0.121, representing a 26.67% improvement. The table below compares the drag coefficients for individual surfaces before and after optimization.
| Surface | Drag Coefficient (Original) | Drag Coefficient (Optimized) | Reduction Percentage |
|---|---|---|---|
| Nose | 0.037 | 0.018 | 51.35% |
| Fuselage | 0.015 | 0.012 | 20.00% |
| Tail | 0.040 | 0.031 | 22.50% |
| Jet支架 | 0.073 | 0.060 | 17.81% |
| Total | 0.165 | 0.121 | 26.67% |
The optimized VTOL UAV demonstrated improved flow characteristics: pressure peaks at the nose decreased to 58.22 Pa, flow separation zones diminished, velocity gradients became smoother, and turbulent kinetic energy reduced notably at the tail and支架 regions. These enhancements contribute to better flight stability, lower energy consumption, and increased payload efficiency for the VTOL UAV in practical applications. The aerodynamic optimization process underscores the value of CFD simulations in designing high-performance VTOL UAVs, enabling rapid prototyping and cost-effective development.
In conclusion, this study presents a comprehensive aerodynamic numerical simulation of a four-axis VTOL jet-powered UAV, leveraging CFD techniques to analyze and optimize its design. By applying fluid dynamics principles and turbulence modeling, we identified key areas of high drag and energy loss, such as the nose, upper surface, tail, and jet支架 regions. Through targeted造型 optimizations, including curvature adjustments and structural enclosures, the total drag coefficient was reduced by 26.67%, leading to improved pressure distribution, flow velocity uniformity, and turbulence reduction. The optimized VTOL UAV exhibits superior aerodynamic performance, aligning with the requirements for high maneuverability, load capacity, and dynamic response in disaster relief and other demanding missions. Future work may explore additional factors like aeroacoustics, thermal effects from jet engines, and dynamic flight maneuvers to further advance VTOL UAV capabilities. This research contributes to the growing body of knowledge on VTOL UAV aerodynamics, providing a framework for efficient design and simulation-driven development in unmanned aerial systems.
The integration of CFD simulations into the VTOL UAV design process offers substantial benefits, including reduced reliance on physical wind tunnel tests, lower development costs, and accelerated innovation cycles. As VTOL UAV technology continues to evolve, ongoing refinements in computational methods and optimization algorithms will enable even more sophisticated designs, pushing the boundaries of what these versatile aircraft can achieve. Ultimately, the insights gained from this study can inform the development of next-generation VTOL UAVs for diverse applications, from emergency response to logistics and surveillance, ensuring they operate with maximum efficiency and reliability in complex environments.