
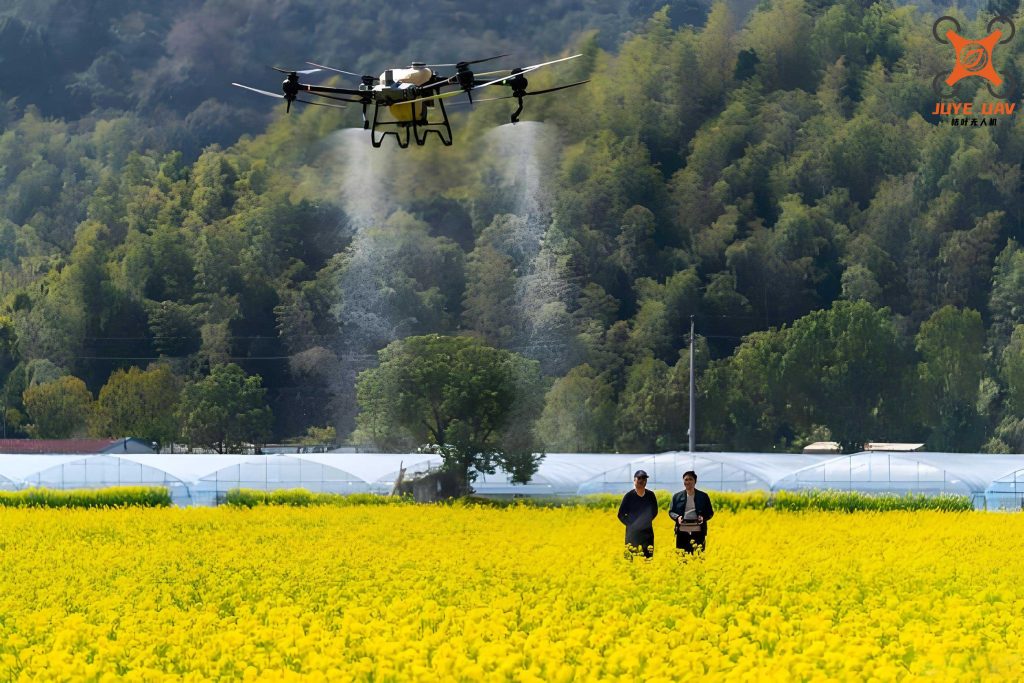
In recent years, the use of agricultural UAV (unmanned aerial vehicle) technology has revolutionized precision agriculture by enabling high-resolution, timely monitoring of crop fields. The ability to automatically extract crop planting areas from agricultural UAV images is crucial for applications such as nutrient management, weed detection, and yield estimation. However, image segmentation—a key step in object-based analysis—often relies on manually tuning scale parameters, which limits efficiency and scalability. This study addresses this challenge by proposing an improved method for automatic scale parameter determination in agricultural UAV image segmentation.
The core of automated segmentation lies in evaluating segmentation quality based on the principle that objects should be internally homogeneous and externally heterogeneous. Existing methods, such as the weighted local variance (WLV) approach, focus primarily on inter-object heterogeneity but neglect intra-object homogeneity, leading to suboptimal segmentation like under-segmentation. To overcome this, we introduce an improved weighted local variance (IWLV) method that integrates both homogeneity and heterogeneity metrics. Our work is validated through extensive field experiments involving corn and wheat crops under varying nitrogen and water conditions, demonstrating the robustness of IWLV across different growth stages and crop vigor levels.
The significance of agricultural UAV imagery stems from its high spatial and temporal resolution, which allows for detailed crop monitoring. Traditional pixel-based classification methods often produce “salt-and-pepper” noise, while object-based approaches can yield more accurate results by grouping pixels into meaningful segments. However, the scale parameter in segmentation algorithms directly influences object size and shape, making its automatic determination a critical research gap. Previous studies have explored evaluation functions like local variance (LV) and weighted local variance (WLV), but these methods exhibit limitations when applied to complex agricultural UAV images. Our research aims to bridge this gap by enhancing WLV with intra-object homogeneity, thereby improving segmentation accuracy for precision agriculture.
This article is structured as follows: First, we detail the IWLV methodology, including mathematical formulations. Next, we describe the field experiments and data acquisition using agricultural UAV systems. Then, we present results from multiple scenarios, comparing WLV and IWLV through tables and metrics. Finally, we discuss implications and conclude with insights for future applications of agricultural UAV technology.
Methodology: Improved Weighted Local Variance (IWLV)
The weighted local variance (WLV) method evaluates segmentation by computing the variance within neighborhood object sets, emphasizing inter-object heterogeneity. For a segmentation result \(R\), WLV is defined as:
$$ \text{WLV}(R) = \frac{1}{\#B} \sum_{b \in B} \left( \frac{1}{\sum_{u \in R} P(u)} \sum_{u \in R} \text{WLVE}(u, b) \cdot P(u) \right) $$
where \(\#B\) is the number of bands, \(B\) is the band set, \(u\) is an object in \(R\), \(P(u)\) is the weight for object \(u\) (set to 1 for equal importance), and \(\text{WLVE}(u, b)\) is the weighted local variance for object \(u\) in band \(b\). The term \(\text{WLVE}(u, b)\) is calculated as:
$$ \text{WLVE}(u, b) = \frac{1}{\sum_{v \in N(u)} Q(v)} \sum_{v \in N(u)} \left( m_b(v) – m_b(N(u)) \right)^2 \cdot Q(v) $$
Here, \(N(u)\) is the neighborhood object set including \(u\) itself, \(v\) is an object in \(N(u)\), \(Q(v)\) is the weight based on the area of \(v\) and the shared border length between \(u\) and \(v\), \(m_b(v)\) is the mean spectral value of \(v\) in band \(b\), and \(m_b(N(u))\) is the weighted mean of the neighborhood set. While WLV captures inter-object differences, it overlooks intra-object homogeneity, which can lead to oversimplified segments.
To address this, we propose the improved weighted local variance (IWLV) method, which incorporates intra-object homogeneity via standard deviation and balances it with inter-object heterogeneity using weights based on adjacency. The IWLV formula is:
$$ \text{IWLV}(R) = \frac{1}{\#B} \sum_{b \in B} \left( \frac{1}{\sum_{u \in R} P(u)} \sum_{u \in R} \text{IWLVE}(u, b) \cdot P(u) \right) $$
where \(\text{IWLVE}(u, b)\) is defined as:
$$ \text{IWLVE}(u, b) = \left(1 – \frac{1}{A(u)}\right) \cdot \text{InterHetero}(u, b) – \frac{1}{A(u)} \cdot \text{IntraHomo}(u, b) $$
In this equation, \(A(u)\) is the number of adjacent objects to \(u\), \(\text{InterHetero}(u, b)\) represents inter-object heterogeneity similar to WLV’s variance term, and \(\text{IntraHomo}(u, b)\) is the intra-object homogeneity measured as the standard deviation within \(u\). Specifically:
$$ \text{InterHetero}(u, b) = \frac{1}{\sum_{v \in N(u)} Q(v)} \sum_{v \in N(u)} \left( m_b(v) – m_b(N(u)) \right)^2 \cdot Q(v) $$
$$ \text{IntraHomo}(u, b) = \text{STD}_b(u) $$
where \(\text{STD}_b(u)\) is the standard deviation of spectral values within object \(u\) in band \(b\). The weights \(1 – 1/A(u)\) and \(1/A(u)\) adjust the influence of heterogeneity and homogeneity, respectively, preventing under- or over-segmentation. During segmentation, the scale parameter that maximizes IWLV is selected as optimal, as it balances object internal consistency and external distinction.
This approach is particularly suited for agricultural UAV images, where crops and soil backgrounds exhibit distinct spectral and textural patterns. By automating scale selection, IWLV reduces manual intervention and enhances segmentation accuracy for diverse crop conditions.
Experimental Design and Data Acquisition
To validate the IWLV method, we conducted field experiments for corn and winter wheat, capturing agricultural UAV imagery under varying nutrient and water treatments. These experiments provided a range of scenarios to test segmentation robustness.
For corn, a nitrogen gradient experiment was established with five treatments (0, 70, 140, 210, and 280 kg·ha⁻¹) applied across 15 plots. UAV flights were performed at two growth stages: bellmouth stage and pre-tasseling stage, using a 3DR Solo drone equipped with a RedEdge M multispectral sensor. The flight altitude was 50 m, yielding images with approximately 3.5 cm spatial resolution. For winter wheat, a water-nitrogen coupling experiment included two irrigation levels (60 mm and 90 mm) and five nitrogen treatments (0, manure only, and manure with incremental nitrogen), totaling 32 plots. Flights at the jointing stage used a 30 m altitude, resulting in 2.0 cm resolution images. All images were processed for reflectance calibration and geometric correction using high-precision GPS data.
The agricultural UAV systems enabled high-resolution data collection, critical for capturing fine-scale crop features. We defined multiple segmentation scenarios based on crop type, growth stage, and treatment: 10 scenarios for corn (e.g., N1S1 for nitrogen treatment 1 at bellmouth stage) and 10 for wheat (e.g., N1W1 for nitrogen treatment 1 under irrigation level 1). Each scenario involved segmenting entire plot areas using the mean shift algorithm, with scale parameters ranging from 5 to 90 in steps of 5. The WLV and IWLV methods were applied to select optimal scales, and segmentation results were evaluated against manual reference segments obtained via human-machine interaction in random 1 m × 2 m rectangles per plot.
Accuracy assessment used the single-scale object accuracy (SOA) metric, which measures similarity between segmented and reference objects. SOA is computed as:
$$ \text{SOA}(R_u) = \max_{P_v} \frac{2|R_u \cap P_v|}{|R_u| + |P_v|} $$
for each reference object \(R_u\), and the overall SOA is the average across all objects. Higher SOA values indicate better alignment with reference segments.
Results: Scale Parameter Selection and Segmentation Accuracy
The evaluation of WLV and IWLV across corn and wheat scenarios revealed distinct trends in scale parameter selection and segmentation performance. Tables 1 and 2 summarize the optimal scales chosen by each method and corresponding SOA values for corn and wheat, respectively.
| Scenario | WLV Scale | IWLV Scale |
|---|---|---|
| N1S1 | 65 | 40 |
| N2S1 | 65 | 60 |
| N3S1 | 70 | 40 |
| N4S1 | 90 | 60 |
| N5S1 | 80 | 45 |
| N1S2 | 35 | 25 |
| N2S2 | 40 | 30 |
| N3S2 | 45 | 30 |
| N4S2 | 40 | 30 |
| N5S2 | 45 | 30 |
Table 1: Optimal scale parameters selected by WLV and IWLV methods for corn scenarios (S1: bellmouth stage, S2: pre-tasseling stage).
| Scenario | WLV Scale | IWLV Scale | WLV SOA | IWLV SOA |
|---|---|---|---|---|
| N1S1 | 65 | 40 | 0.626 | 0.770 |
| N2S1 | 65 | 60 | 0.693 | 0.765 |
| N3S1 | 70 | 40 | 0.675 | 0.767 |
| N4S1 | 90 | 60 | 0.654 | 0.770 |
| N5S1 | 80 | 45 | 0.722 | 0.795 |
| N1S2 | 35 | 25 | 0.747 | 0.768 |
| N2S2 | 40 | 30 | 0.755 | 0.811 |
| N3S2 | 45 | 30 | 0.682 | 0.796 |
| N4S2 | 40 | 30 | 0.726 | 0.807 |
| N5S2 | 45 | 30 | 0.711 | 0.771 |
Table 2: SOA values for corn segmentation based on WLV and IWLV selected scales.
For corn, IWLV consistently selected smaller scale parameters than WLV, indicating a tendency toward finer segmentation. This aligns with the visual observation that WLV often led to under-segmentation, where multiple crop rows or soil patches were merged into large objects. The SOA values for IWLV were higher in all scenarios, with averages around 0.78 compared to 0.70 for WLV, confirming improved alignment with reference segments. The variation in optimal scales across growth stages—smaller scales at pre-tasseling stage—reflects changes in canopy structure and soil exposure, which IWLV captured more effectively.
For wheat, the results similarly favored IWLV, as shown in Tables 3 and 4.
| Scenario | WLV Scale | IWLV Scale |
|---|---|---|
| N1W1 | 20 | 20 |
| N2W1 | 35 | 15 |
| N3W1 | 65 | 25 |
| N4W1 | 85 | 70 |
| N5W1 | 75 | 65 |
| N1W2 | 20 | 15 |
| N2W2 | 90 | 15 |
| N3W2 | 85 | 20 |
| N4W2 | 75 | 35 |
| N5W2 | 75 | 70 |
Table 3: Optimal scale parameters selected by WLV and IWLV methods for wheat scenarios (W1: 90 mm irrigation, W2: 60 mm irrigation).
| Scenario | WLV SOA | IWLV SOA |
|---|---|---|
| N1W1 | 0.675 | 0.675 |
| N2W1 | 0.535 | 0.660 |
| N3W1 | 0.548 | 0.717 |
| N4W1 | 0.553 | 0.602 |
| N5W1 | 0.661 | 0.705 |
| N1W2 | 0.618 | 0.667 |
| N2W2 | 0.430 | 0.716 |
| N3W2 | 0.446 | 0.708 |
| N4W2 | 0.536 | 0.685 |
| N5W2 | 0.646 | 0.648 |
Table 4: SOA values for wheat segmentation based on WLV and IWLV selected scales.
In wheat scenarios, IWLV again selected smaller scales in most cases, except for high-nitrogen treatments where scales were comparable. The SOA values for IWLV were notably higher, averaging 0.68 versus 0.56 for WLV, demonstrating superior segmentation accuracy. The lower SOA for wheat compared to corn can be attributed to relative resolution differences: wheat leaves are smaller relative to image resolution, making segmentation more challenging. Nevertheless, IWLV outperformed WLV by better balancing homogeneity and heterogeneity.
The curves of WLV and IWLV versus scale parameters illustrated that IWLV exhibited clearer peaks, indicating enhanced sensitivity to scale changes. This robustness is vital for agricultural UAV applications, where environmental conditions and crop phenology vary widely.
Discussion: Implications for Agricultural UAV Applications
The improved performance of IWLV over WLV underscores the importance of incorporating both intra-object homogeneity and inter-object heterogeneity in segmentation evaluation. By adding the standard deviation term and adjacency-based weighting, IWLV effectively mitigates under-segmentation, a common issue in WLV-based approaches. This is particularly relevant for agricultural UAV imagery, where crops and backgrounds form complex patterns due to management practices and growth dynamics.
Our findings highlight several key factors influencing scale parameter selection. First, crop growth stage impacts optimal scales; for example, in corn, later stages required smaller scales due to increased canopy coverage and fragmented soil patches. Second, crop type and structure matter: wheat, with finer textures, necessitated different scaling than corn. Third, treatment effects—such as nitrogen levels—altered canopy size and vigor, influencing segmentation granularity. IWLV’s ability to adapt to these variations makes it a valuable tool for automated analysis of agricultural UAV data.
Moreover, the relative resolution—the ratio of image resolution to target object size—plays a crucial role in segmentation accuracy. For instance, wheat images had higher spatial resolution (2.0 cm) but lower relative resolution compared to corn (3.5 cm), leading to lower SOA values overall. This suggests that future work should consider resolution-adjusted parameters when processing agricultural UAV imagery.
Limitations of this study include the focus on only two crop types; further validation across diverse crops and environments is needed. Additionally, segmentation algorithms other than mean shift could be coupled with IWLV to explore broader applicability. Despite this, the method offers a practical solution for scale parameter automation, reducing reliance on manual tuning and enhancing the efficiency of agricultural UAV-based monitoring.
Conclusion
In conclusion, we have developed an improved weighted local variance (IWLV) method for automatic scale parameter determination in agricultural UAV image segmentation. By integrating intra-object homogeneity with inter-object heterogeneity, IWLV overcomes the limitations of the traditional WLV approach, yielding more accurate segmentation across various crop conditions. Experimental results from corn and wheat field trials confirm that IWLV selects appropriate scales and achieves higher SOA values than WLV, minimizing under-segmentation and aligning closely with reference data.
This advancement supports the growing use of agricultural UAV technology in precision agriculture by enabling robust, automated image analysis. Future research could extend IWLV to multi-scale segmentation or integrate it with deep learning techniques for enhanced object detection. As agricultural UAV systems become more prevalent, methods like IWLV will be essential for unlocking the full potential of high-resolution remote sensing in crop management and sustainability.