
Monitoring large-scale agricultural operations to assess crop growth stages is a critical yet labor-intensive task. The external morphology of crops varies distinctly across different phenological phases, presenting clear visual markers that can be leveraged for automated identification. This paper details the design and theoretical framework of an integrated farm management system. The core of this system is a quadrotor drone equipped with a high-resolution camera, which conducts aerial surveys of vast farmlands. The captured imagery is then processed through computer vision algorithms to determine the growth stage of the crops and geolocate specific plots, enabling targeted and timely farming interventions such as harvesting.
1. Hardware Platform and Specifications
The aerial platform selected for this system is a commercially available quadrotor drone, the DJI Mavic Air. This platform offers a balanced combination of flight performance, imaging capability, and software accessibility, making it highly suitable for automated farm surveillance tasks.
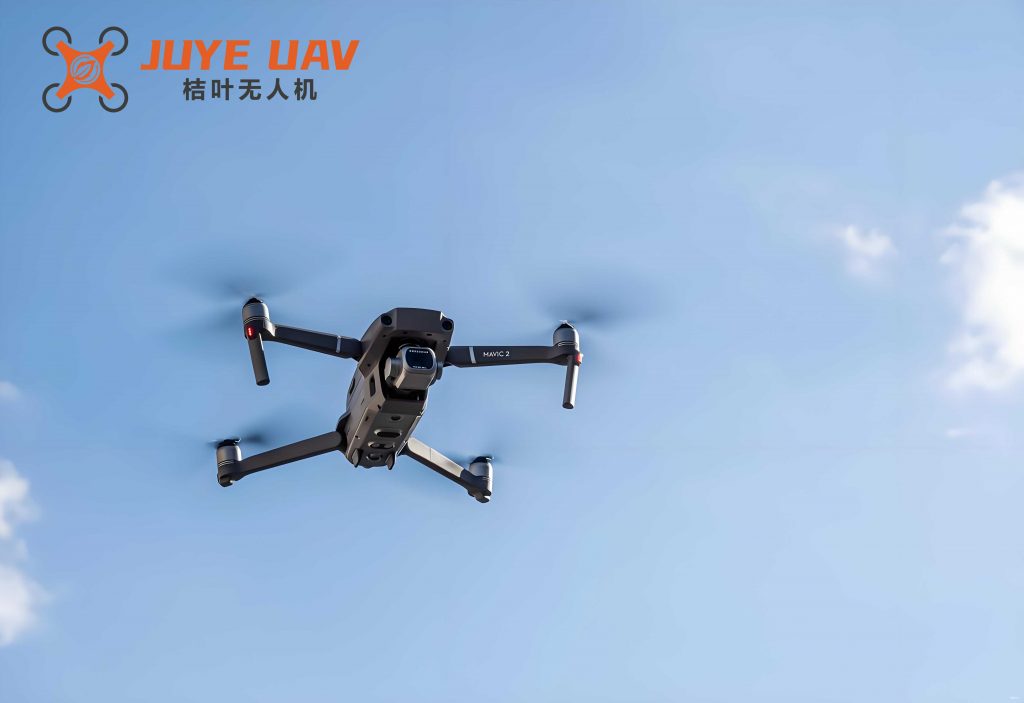
The key specifications of the quadrotor drone that underpin the system’s operational design are summarized in the table below:
| Parameter | Specification | Implication for Farm Monitoring |
|---|---|---|
| Flight Time | ~30 minutes | Determines the maximum area covered per single mission (sortie). |
| Maximum Speed | ~30 km/h (cruise), 60 km/h (max) | Enables rapid traversal of large fields for efficient surveying. |
| Camera Resolution | Up to 32 Megapixels | Provides highly detailed imagery for precise visual analysis. |
| Field of View (FOV) | 180° wide-angle | Captures a broad swath of land per image, reducing the number of images needed for full coverage. |
| Maximum Control Range | 4 km (in open areas) | Defines the theoretical maximum operational radius from the pilot/ground station. |
| Real-time Video Transmission | 720p at up to 4 km | Allows for live monitoring of the drone’s perspective during flight. |
The operational range is a critical factor. With a 4 km control radius, the quadrotor drone can theoretically surveil a circular area of approximately 50 km². In practice, for a systematic survey, the effective linear cruising range is paramount. Assuming an average cruise speed of 30 km/h and a 25-minute dedicated survey time within a 30-minute flight, the quadrotor drone can cover a path length $L_{path}$ of:
$$ L_{path} = v_{cruise} \times t_{survey} = 30 \, \text{km/h} \times \frac{25}{60} \, \text{h} = 12.5 \, \text{km} $$
To extend the operational range beyond direct radio line-of-sight, the system can incorporate signal relay stations. Furthermore, the quadrotor drone’s ability to be controlled via Wi-Fi protocols facilitates the integration of such mesh network solutions, effectively increasing the contiguous manageable farmland area.
2. Software Architecture and Image Processing Pipeline
The software component is built upon the DJI Software Development Kit (SDK), which provides programmable control over the quadrotor drone’s flight and camera systems. The core innovation lies in the image processing pipeline designed to translate raw aerial imagery into actionable data on crop maturity.
2.1 Color Space Transformation: From RGB to HSV
Images captured directly by the camera are stored in the RGB (Red, Green, Blue) color model. Each pixel is represented by a triplet $(R, G, B)$, where each value typically ranges from 0 to 255. While rich in information, the RGB space has significant drawbacks for color-based segmentation:
- High Correlation: The R, G, and B components are highly correlated with luminance.
- Non-uniformity: The perceptual difference between two colors is not linearly related to the Euclidean distance between their $(R, G, B)$ coordinates.
- Sensitivity to Illumination: The values for a specific color (e.g., green) can vary widely under different lighting conditions (sunny vs. cloudy), making it difficult to define robust thresholds.
Therefore, the first step in the pipeline is to convert the image from the RGB color space to the HSV (Hue, Saturation, Value) color space. HSV separates the color information (Hue) from its intensity (Value) and purity (Saturation), making it far more suitable for identifying colors under varying lighting. The transformation for a given pixel is non-linear. For normalized RGB values $r, g, b \in [0, 1]$:
$$
\begin{aligned}
V &= \max(r, g, b) \\
S &= \begin{cases}
\frac{\max(r,g,b) – \min(r,g,b)}{\max(r,g,b)} & \text{if } \max(r,g,b) \neq 0 \\
0 & \text{otherwise}
\end{cases} \\
H &= \begin{cases}
60^\circ \times \left(0 + \frac{g – b}{\max(r,g,b) – \min(r,g,b)}\right) & \text{if } \max(r,g,b) = r \\
60^\circ \times \left(2 + \frac{b – r}{\max(r,g,b) – \min(r,g,b)}\right) & \text{if } \max(r,g,b) = g \\
60^\circ \times \left(4 + \frac{r – g}{\max(r,g,b) – \min(r,g,b)}\right) & \text{if } \max(r,g,b) = b
\end{cases} \\
\text{If } H &< 0, \text{ then } H = H + 360^\circ
\end{aligned}
$$
The final $H$ value is typically scaled to a range of 0-255 for 8-bit image processing.
2.2 Feature Detection and Maturity Assessment
The system is trained to recognize specific HSV signatures corresponding to key growth stages. Using wheat as a canonical example:
- Immature/Growing Wheat: Appears green. A representative RGB triplet is $(0, 255, 255)$. After conversion, its HSV approximation is $(H=180^\circ, S=1, V=255)$.
- Mature Wheat: Appears yellow. A representative RGB triplet is $(255, 255, 0)$. Its HSV approximation is $(H=60^\circ, S=1, V=255)$.
Notice that the hues for green (180°) and yellow (60°) are complementary, providing a clear spectral separation that simplifies detection. The primary detection algorithm focuses on the Hue channel. A thresholding operation creates a binary mask $M(x,y)$ for mature crops:
$$ M(x,y) = \begin{cases}
1 & \text{if } |H_{pixel}(x,y) – H_{target}| < \tau_H \\
0 & \text{otherwise}
\end{cases} $$
where $H_{target} = 60^\circ$ (for mature wheat) and $\tau_H$ is a tolerance threshold (e.g., $10^\circ$). The saturation and value channels can be used for additional validation to filter out dark or achromatic areas.
Once the mature regions are identified, the software performs shape analysis. Given that the ground sampling distance (pixel-to-real-world size ratio) is known or can be calibrated, the area of each connected “mature” region in the binary mask is calculated. The ratio $R_{mature}$ of the mature area to the total area of the defined plot is a key metric:
$$ R_{mature} = \frac{A_{mature\_mask}}{A_{total\_plot}} $$
This ratio, along with the geotagged location from the quadrotor drone’s GPS, is transmitted to the ground control station (GCS) or cloud server. The farmer can then use this quantitative data ($R_{mature}$) to decide if the plot has reached a sufficient maturity threshold for harvest.
The complete software workflow is illustrated below:
- Mission Start: The quadrotor drone is launched and follows a pre-planned GPS waypoint path.
- Image Acquisition: The drone captures high-resolution images at defined intervals or locations.
- Color Space Conversion: Each image is converted from RGB to HSV. $$ \text{RGB Image} \xrightarrow{\text{Transformation}} \text{HSV Image} $$
- Thresholding & Masking: The Hue channel is filtered to create a binary mask of target-colored pixels. $$ \text{Hue Channel} \xrightarrow{\text{Threshold } \tau_H} \text{Binary Mask } M $$
- Morphological Operations: Noise is removed from the mask using operations like opening and closing.
- Contour Detection & Area Calculation: Contours of connected regions in $M$ are found, and their areas are computed. $$ A_{mature} = \sum_{i \in \text{contours}} \text{Area}(Contour_i) $$
- Geolocation & Data Fusion: The calculated $A_{mature}$ and $R_{mature}$ are fused with the drone’s GPS coordinates for the image center.
- Data Transmission: The processed data packet (Location, $R_{mature}$, timestamp) is sent to the GCS.
- Decision Support: The GCS software aggregates data from all images, presenting a map-view of maturity levels across the farm.
2.3 Handling Environmental Ambiguities
A significant challenge is that under certain lighting conditions (e.g., low sun angles), bare soil can exhibit hues similar to mature crops. To mitigate false positives, the system incorporates two strategies:
- Multi-point Verification: The path of the quadrotor drone can be programmed to capture multiple images of the same plot from different angles (e.g., from the four corners of a rectangular field). By analyzing the consistency of the detected mature region across these viewpoints, the confidence in the assessment increases. The final maturity ratio can be an average: $$ \bar{R}_{mature} = \frac{1}{N} \sum_{k=1}^{N} R_{mature}^{(k)} $$ where $N$ is the number of valid observations for that plot.
- Operator-in-the-Loop Validation: The ground station interface allows the user to visually inspect the original image alongside the processed mask for any plot flagged as mature. If the user knows a plot is fallow, they can exclude it from analysis or mark it for re-survey with adjusted parameters.
3. System Workflow and Operational Model
Consider a model farm covering 300 hectares (3 km²), with dimensions of 2 km by 1.5 km. The system workflow is designed for efficiency and robustness.
| Stage | Action | Description |
|---|---|---|
| 1. Pre-flight Planning | Mission Definition | The operator defines the survey boundary on a digital map in the GCS software. The software automatically calculates an efficient flight path (e.g., lawnmower pattern) for the quadrotor drone. |
| 2. In-flight Operation | Autonomous Navigation & Data Collection | The quadrotor drone executes the planned route autonomously. It captures images at predetermined overlap intervals (e.g., 70% frontlap and sidelap) to ensure complete coverage and facilitate potential photogrammetric processing. |
| Onboard/Real-time Processing | Image processing (RGB→HSV conversion, thresholding) can be performed either onboard the drone (if computational resources allow) or on a companion computer, with results telemetered in real-time. | |
| 3. Post-flight Analysis | Data Aggregation & Visualization | All geotagged maturity data is compiled. The GCS generates a thematic map where each field plot is color-coded based on its $R_{mature}$ value (e.g., green for immature, yellow for ready, red for over-mature). |
| 4. Decision & Action | Targeted Intervention | The farmer reviews the maturity map. Plots showing $R_{mature}$ exceeding a pre-defined threshold (e.g., >0.85) are scheduled for harvest. The precise coordinates can be fed into automated machinery like combine harvesters. |
The operational capacity of a single quadrotor drone is calculated as follows. With a daily flight capacity of 6-8 sorties (accounting for charging time of ~54 minutes), and an effective coverage of ~3 km² per sortie, a single quadrotor drone can monitor approximately 18-24 km² per day. This far exceeds the needs of the model farm (3 km²), allowing for frequent, even daily, monitoring during critical growth periods.
4. Innovations of the Proposed System
The integration of technologies in this system presents several key innovations:
- High-Frequency, Adaptive Surveillance: The use of a quadrotor drone enables rapid, non-invasive, and on-demand surveillance of large farms. Its agility allows it to adapt flight paths easily to survey irregularly shaped plots or focus on areas of interest identified in previous flights.
- Growth Stage Quantification via Vision: Moving beyond simple aerial photography, the system employs a dedicated image processing pipeline (RGB→HSV transformation, thresholding, area calculation) to quantitatively assess crop maturity ($R_{mature}$). This transforms subjective visual inspection into an objective, data-driven metric.
- Automated Geolocation and Data Fusion: The system inherently links the visual assessment with precise geographical coordinates from the quadrotor drone’s GPS. This creates a direct link between the “what” (maturity state) and the “where” (specific plot), which is essential for targeted action.
- Robustness through Multi-perspective Analysis: The proposed method of capturing and analyzing multiple images of the same plot from different angles (e.g., four corners) increases the accuracy and reliability of the maturity assessment, reducing errors caused by shadows, soil color, or uneven crop stands.
5. Feasibility and Impact Analysis
5.1 Technical Feasibility
The proposed system is built on mature, commercially available technologies. Quadrotor drones with high-quality cameras and stable flight controllers are ubiquitous. Computer vision libraries (e.g., OpenCV) provide robust, open-source tools for implementing the RGB-to-HSV conversion and segmentation algorithms. The DJI SDK offers a stable platform for automation. The primary technical challenge lies in optimizing the image processing algorithms for real-time or near-real-time execution and ensuring robust operation under all agricultural weather conditions.
5.2 Economic and Operational Feasibility
The economic argument for this system is compelling. The initial hardware and software development cost for a single system is estimated at a base level. The operational savings are derived from replacing manual scouting.
Consider a 3 km² family farm. A traditional combine harvester may harvest 0.27-0.33 km² per day, meaning the harvest window lasts 10-15 days. During this period, determining which plots are ready requires daily manual assessment. A worker might visually assess 0.5-0.7 km² per day. Therefore, scouting the entire 3 km² farm daily would require a team of 4-6 people.
The cost of manual scouting versus the automated quadrotor drone system is compared below:
| Factor | Manual Scouting (Team of 5) | Automated Quadrotor Drone System |
|---|---|---|
| Labor Cost (10-15 days) | Significant (e.g., $10,000 – $13,000) | Minimal (operator oversight only) |
| Assessment Speed | Slow, subject to fatigue and terrain. | Fast (~3 km² in <30 min). |
| Data Quality | Subjective, qualitative. | Objective, quantitative ($R_{mature}$). |
| Safety & Access | Risk of injury in fields; difficult in wet conditions. | No risk to personnel; operates in most conditions. |
| Additional Benefits | None. | Creates historical imagery database; can be used for other analyses (plant counting, weed detection). |
The system’s cost can be amortized over its lifespan. Given the high annual cost of manual scouting, the Return on Investment (ROI) period is short, often within one or two growing seasons. Furthermore, by enabling more precise timing of harvest based on accurate $R_{mature}$ data, the system can potentially improve crop quality and yield, adding further value.
The scalability of this approach is significant. With advancements in battery technology and swarm coordination, a single operator could manage a fleet of quadrotor drones to monitor vastly larger areas, bringing precision agriculture capabilities to ever-greater scales.
In conclusion, this integrated system, centered on a versatile quadrotor drone and a robust image processing pipeline, presents a feasible and economically attractive solution for modern farm management. It transforms crop monitoring from a periodic, laborious task into a continuous, automated, and data-rich process, empowering farmers to make more informed and timely decisions for improved productivity and sustainability.