
As a rapidly developing category of aerial application equipment, agricultural UAVs have demonstrated significant advantages over ground-based sprayers in recent years. These include high mobility, operational efficiency, superior application quality, reduced dosage of chemicals and water, and minimized crop damage. By the end of 2020, the number of agricultural UAVs in operation exceeded 110,000 units, covering nearly 70 million hectares of application across major crops such as rice, wheat, corn, and cotton. The expanding application scenarios underscore the critical role of agricultural UAV technology in modernizing and scaling agricultural production.
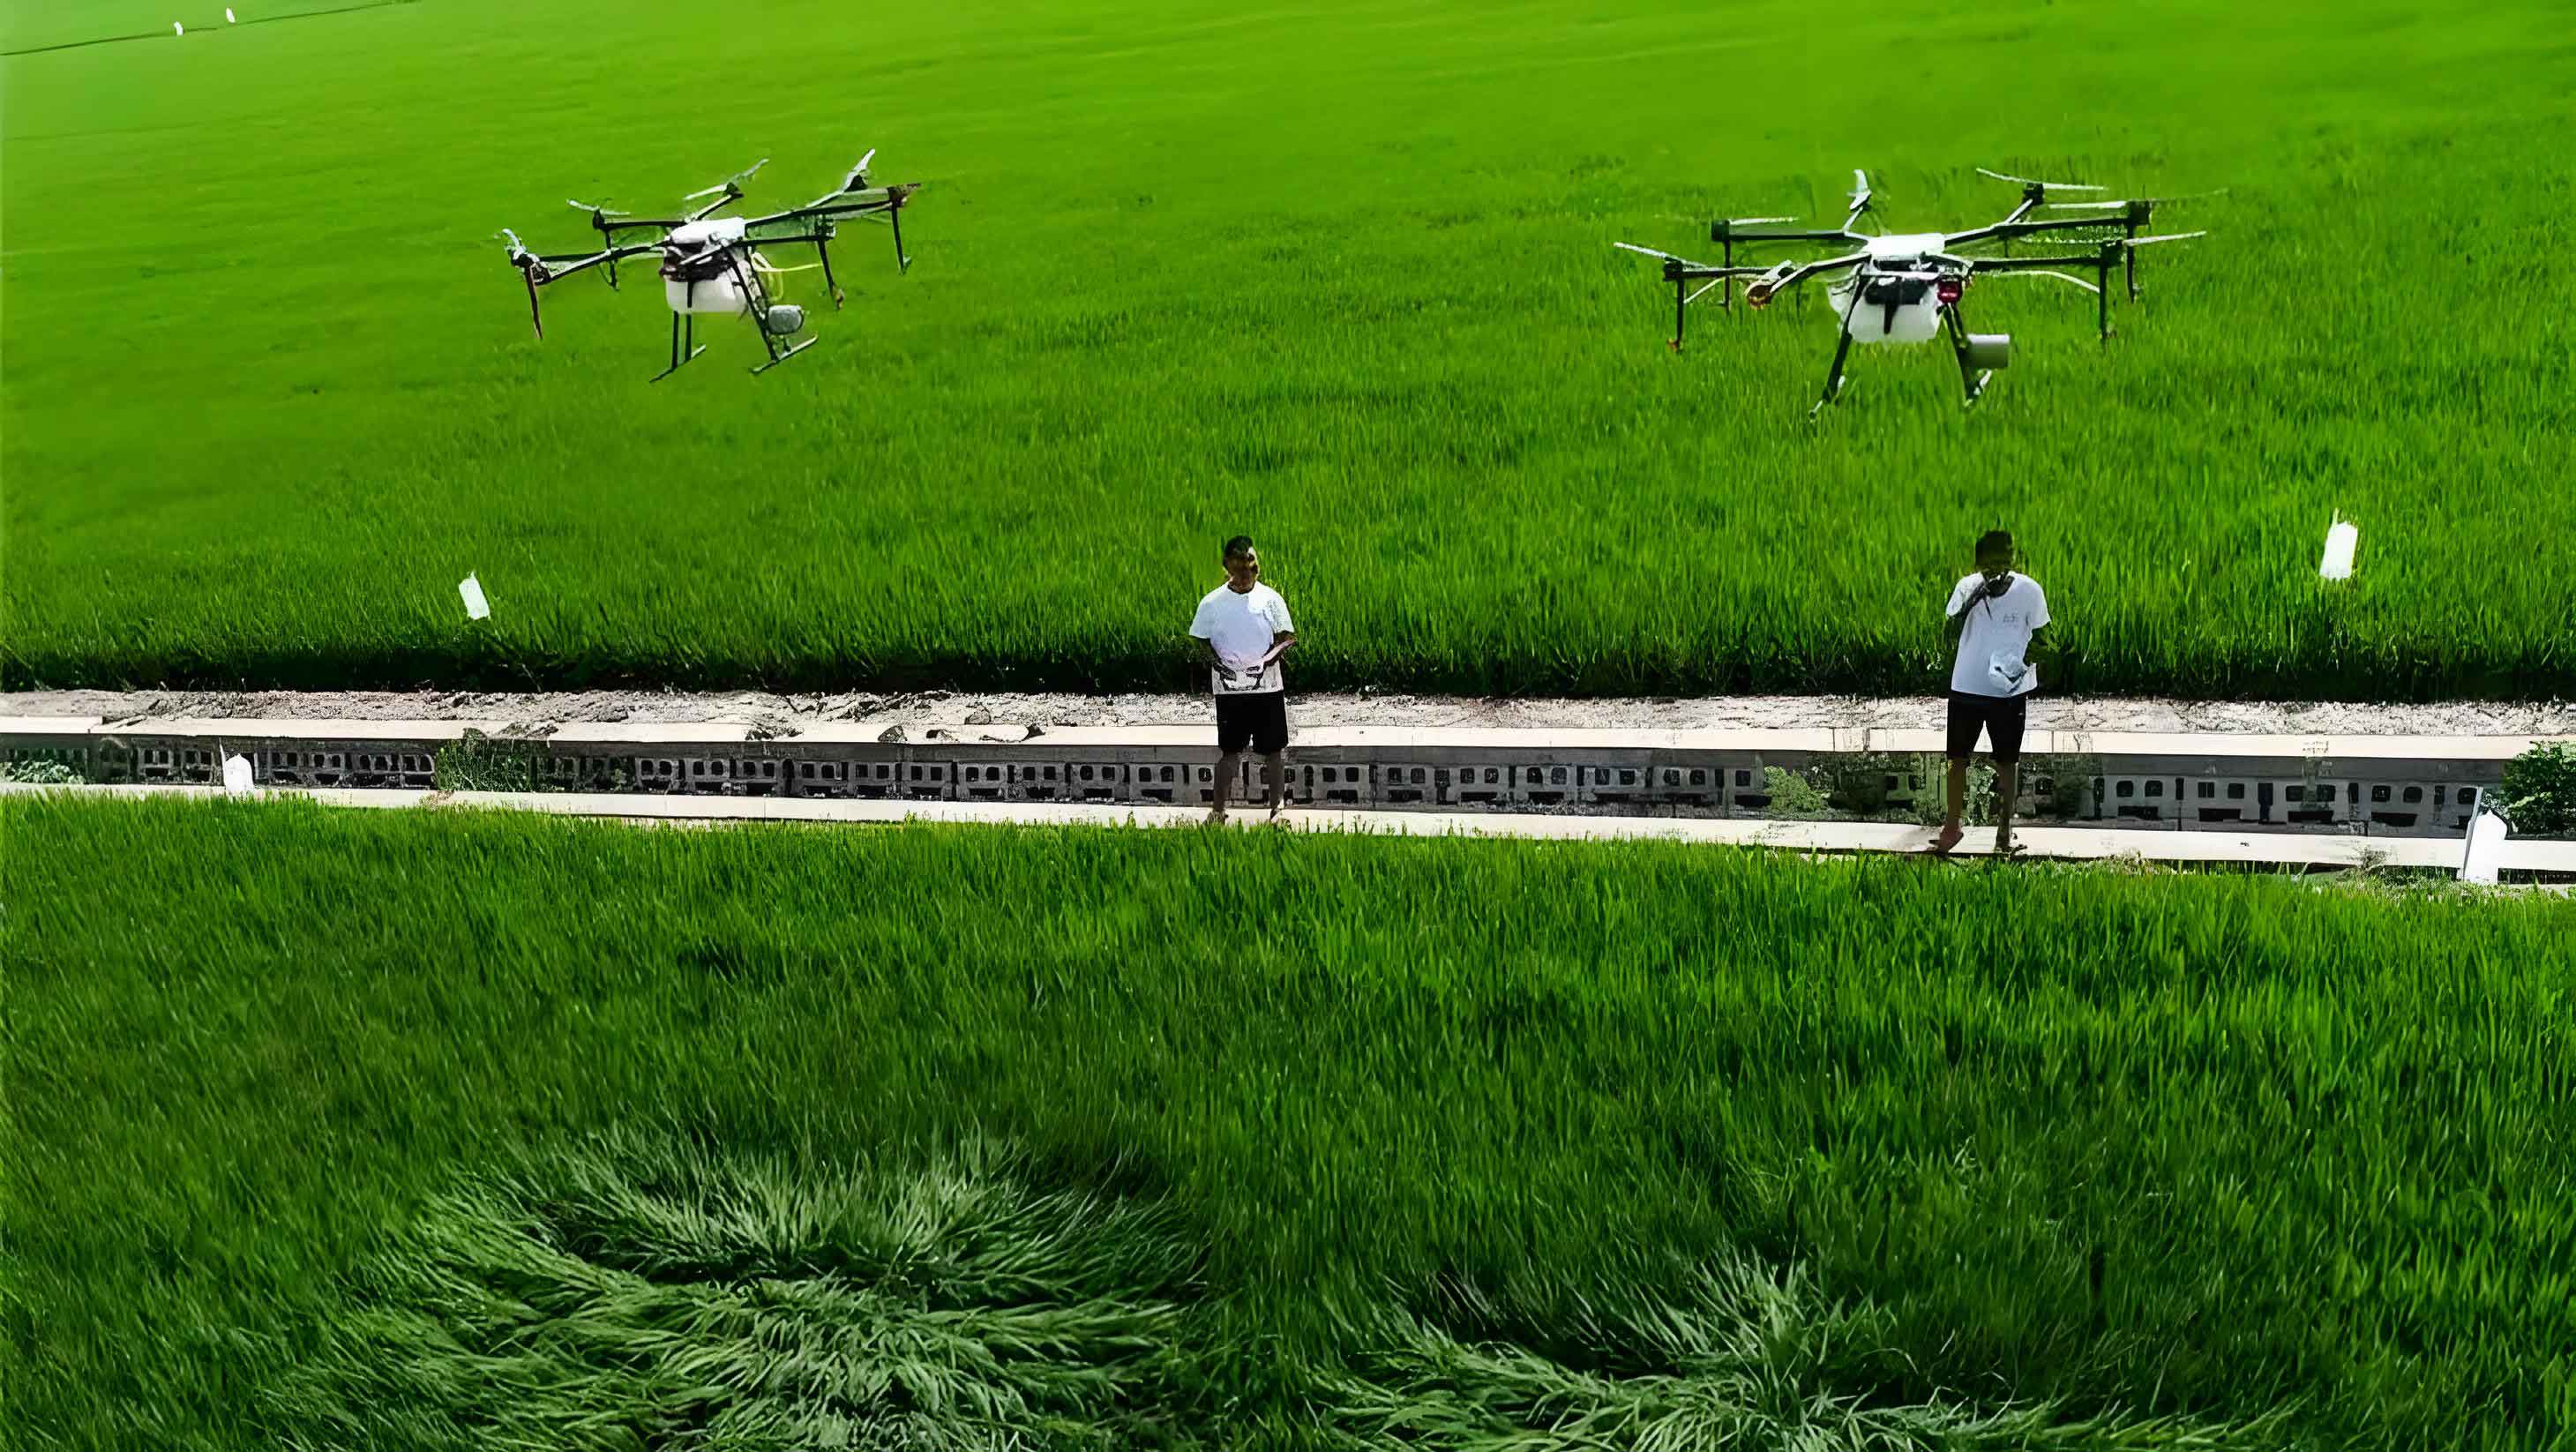
However, the proliferation of diverse agricultural UAV models and types presents a challenge. The operational quality, including spray droplet deposition and distribution, can vary considerably not only between different models but also for the same model under different operational parameters such as flight altitude, speed, and spray swath width. Therefore, determining the optimal operational parameters and assessing spray quality is a necessary precursor to field operations for any specific agricultural UAV model targeting a particular crop.
Spray quality is typically evaluated using metrics like droplet coverage density, droplet size (diameter), spray deposition volume, and distribution uniformity. Unlike conventional high-volume spraying from ground equipment, agricultural UAV applications predominantly employ low-volume or ultra-low-volume spraying techniques. This approach significantly increases chemical concentration while drastically reducing spray volume, thereby imposing stricter requirements on the precision and quality of the agricultural UAV spray operation. Furthermore, performance is influenced by a combination of the UAV’s inherent capabilities, flight parameters, and environmental conditions, leading to potential variability in application quality and consequent pest control efficacy. Thus, systematic research into the spray quality of agricultural UAVs and its correlation with control effectiveness is of paramount importance.
The Asian corn borer (Ostrinia furnacalis) is a major pest of corn, causing severe damage during the tasseling stage. At this growth stage, corn plants are tall and dense, making it difficult and potentially damaging for ground machinery or manual laborers to enter the field for spraying. Consequently, agricultural UAVs offer a novel and practical solution for pest control at this critical juncture. Existing research on agricultural UAV applications for corn borer control has largely focused on droplet deposition patterns and final efficacy. This study aims to provide a more comprehensive evaluation by systematically investigating six key spray quality indicators—droplet coverage density, droplet distribution uniformity, droplet size, droplet spectrum width, spray deposition volume, and deposition volume distribution uniformity—in the context of controlling corn borer during the tasseling stage, referencing relevant technical standards.
By measuring these indicators for an agricultural UAV operating at three different flight altitudes, this work analyzes droplet deposition on the plant canopy, assesses the penetration of droplets into the middle and lower plant strata, explores the relationship between spray quality metrics and control efficacy, and compares the performance of agricultural UAV spraying with that of traditional powered sprayers. The findings are intended to provide a technical basis for optimizing the operational performance and parameters of agricultural UAVs.
1. Materials and Methodology
1.1 Materials
Test Chemical: The insecticide used was 20% chlorantraniliprole suspension concentrate.
Test Equipment: The primary application equipment was a P20V2 agricultural UAV. For comparison, a traditional 3W-15A powered sprayer was used. Droplet analysis was performed using water-sensitive paper and an aviation spray quality detection system. Environmental conditions were monitored with an agricultural environment monitor.
1.2 Test Conditions
Field trials were conducted in a corn field during the tasseling stage. The average plant height was 2.7 meters, and an infestation of Asian corn borer, primarily with 1st to 3rd instar larvae, was present. During application, the average ambient temperature was 30°C, relative humidity was 50%, with a northwest wind at 1.5 m/s.
1.3 Experimental Methods
1.3.1 Experimental Design
A flat, open area free of major obstacles was selected. Treatments consisted of the agricultural UAV operating at three different flight altitudes relative to the corn canopy: 1.0 m, 1.5 m, and 2.0 m. A control treatment using the traditional powered sprayer and an untreated control (water only) were also established. Each treatment was replicated three times in a randomized complete block design, resulting in 15 plots. Each plot measured 60 m x 20 m (1200 m²), separated by 5-meter buffers.
The agricultural UAV operated in a fully autonomous mode with a constant flight speed of 4.0 m/s and a spray swath width of 3.0 m. The application rate for chlorantraniliprole was standardized at 20 mL per 667 m² for both the UAV and ground sprayer treatments. The spray volume for the agricultural UAV was 0.8 L/667m² (ultra-low volume), while the ground sprayer applied 40 L/667m² (high volume). The untreated control plots received water only.
1.3.2 Assessment of Agricultural UAV Spray Quality
To evaluate droplet deposition on the plant canopy, three sampling lines were established horizontally at canopy height (approx. 2.7 m) within the middle of each agricultural UAV treatment plot. Each line was 10.0 m long, spaced 10.0 m apart. Sampling points were marked every 0.5 m along these lines, totaling 60 points per plot.
At each sampling point, water-sensitive paper samplers were positioned at three levels: the top (canopy, ~2.7 m), middle (leaf below the tassel, ~2.0 m), and bottom (ear leaf, ~1.2 m) of a representative plant. After the agricultural UAV completed its application, samplers were carefully collected and stored in pre-labeled bags.
The samplers were digitally photographed, and droplet analysis was performed using the dedicated detection system. For each sampler, the following data were recorded: droplet coverage density (D, droplets/cm²), number median diameter (NMD, µm), volume median diameter (VMD, µm), and estimated deposition volume (Q, L/ha).
For each sampling line (representing a spatial distribution), averages and coefficients of variation (CV) were calculated. The key spray quality indicators were derived as follows:
- Average Droplet Coverage Density ($\bar{D}$): The mean number of droplets per cm² across all samplers on a line.
- Droplet Distribution Uniformity: Expressed as the Coefficient of Variation (CV) of the droplet density across the line.
$$ CV_D = \frac{\sigma_D}{\bar{D}} \times 100\% $$
where $\sigma_D$ is the standard deviation of droplet density. - Average Droplet Size: Represented by the mean Volume Median Diameter ($\bar{VMD}$) across samplers.
- Droplet Spectrum Width: Often characterized by the ratio of VMD to NMD. The average ratio ($\bar{R}$) indicates the breadth of the droplet size distribution.
$$ R = \frac{VMD}{NMD} $$
A higher ratio suggests a wider range of droplet sizes. - Average Spray Deposition Volume ($\bar{Q}$): The mean estimated volume of spray deposited per unit area.
- Deposition Volume Distribution Uniformity: Expressed as the CV of the deposition volume across the line.
$$ CV_Q = \frac{\sigma_Q}{\bar{Q}} \times 100\% $$
1.3.3 Evaluation of Control Efficacy
The number of live corn borer larvae was surveyed before application and 7 days after application (7 DAA). For each plot, 100 plants (5 points x 20 plants) were examined. Control efficacy was calculated using the following formulas:
Percentage larval reduction in a treated plot:
$$ LR = \frac{N_{pre} – N_{post}}{N_{pre}} \times 100\% $$
where $N_{pre}$ and $N_{post}$ are live larval counts pre- and post-treatment, respectively.
Corrected control efficacy (Abbott’s formula):
$$ CE = \frac{LR_{T} – LR_{CK}}{100 – LR_{CK}} \times 100\% $$
where $LR_{T}$ is the larval reduction in a treatment plot and $LR_{CK}$ is the larval reduction in the untreated control plot (typically a negative value due to pest increase).
2. Results and Analysis
2.1 Spray Quality of the Agricultural UAV
2.1.1 Deposition and Distribution of Droplets on Corn Plants
The spray quality data for the agricultural UAV across three flight altitudes are summarized in Table 1. The metrics reveal clear trends influenced by flight height and plant stratum.
Regarding droplet coverage density and uniformity, on the plant canopy (top), both the average density ($\bar{D}$) and distribution uniformity ($CV_D$) tended to increase slightly with higher flight altitude. Conversely, in the middle and lower plant strata, the droplet coverage density significantly decreased as the agricultural UAV flew higher. The distribution uniformity in the middle stratum decreased, while it increased in the lower stratum.
For droplet size and spectrum width, the average droplet size ($\bar{VMD}$) decreased consistently across all plant levels as the flight altitude of the agricultural UAV increased. However, the droplet spectrum width ($\bar{R}$) remained relatively constant, showing no significant change with altitude.
Concerning spray deposition volume and its uniformity, the volume of spray deposited ($\bar{Q}$) decreased notably with increasing flight altitude of the agricultural UAV. The uniformity of this deposition ($CV_Q$) showed no consistent or significant trend across the different altitudes.
Table 1. Spray Deposition Characteristics of an Agricultural UAV on Corn Plants at Different Flight Altitudes.
| Flight Altitude (m) | Droplet Coverage Density, D (droplets/cm²) | Distribution Uniformity, CVD (%) | ||||
|---|---|---|---|---|---|---|
| Top | Middle | Bottom | Top | Middle | Bottom | |
| 1.0 | 27.5 ± 2.9 a | 12.6 ± 1.3 a | 13.9 ± 0.9 a | 41.0 ± 8.1 a | 52.5 ± 5.6 a | 43.8 ± 7.4 a |
| 1.5 | 32.5 ± 0.9 a | 7.7 ± 1.1 b | 10.6 ± 2.0 b | 42.2 ± 11.5 a | 45.4 ± 8.3 a | 70.0 ± 11.0 a |
| 2.0 | 33.5 ± 2.5 a | 6.5 ± 1.9 b | 8.7 ± 2.1 b | 49.3 ± 5.2 a | 43.5 ± 7.0 a | 68.4 ± 8.0 a |
| Flight Altitude (m) | Droplet Size, VMD (µm) | Droplet Spectrum Width, R (VMD/NMD) | ||||
|---|---|---|---|---|---|---|
| Top | Middle | Bottom | Top | Middle | Bottom | |
| 1.0 | 177.7 ± 9.9 a | 167.0 ± 5.4 a | 166.0 ± 7.6 a | 1.8 ± 0.1 a | 1.7 ± 0.0 a | 1.8 ± 0.0 a |
| 1.5 | 158.0 ± 1.9 ab | 156.0 ± 2.6 ab | 156.0 ± 4.3 a | 1.8 ± 0.0 a | 1.7 ± 0.0 a | 1.7 ± 0.0 a |
| 2.0 | 151.0 ± 3.5 b | 145.0 ± 4.9 b | 144.0 ± 6.0 b | 1.7 ± 0.1 a | 1.6 ± 0.1 a | 1.6 ± 0.1 a |
| Flight Altitude (m) | Spray Deposition, Q (L/ha) | Deposition Uniformity, CVQ (%) | ||||
|---|---|---|---|---|---|---|
| Top | Middle | Bottom | Top | Middle | Bottom | |
| 1.0 | 3.3 ± 0.4 a | 1.4 ± 0.3 a | 1.4 ± 0.2 a | 60.6 ± 10.3 a | 65.9 ± 8.4 a | 65.9 ± 11.0 a |
| 1.5 | 2.8 ± 0.1 a | 0.7 ± 0.1 b | 1.0 ± 0.1 b | 58.4 ± 9.9 a | 51.2 ± 6.8 a | 73.5 ± 12.1 a |
| 2.0 | 2.6 ± 0.3 a | 0.5 ± 0.1 b | 0.8 ± 0.1 b | 61.8 ± 5.6 a | 51.4 ± 5.2 a | 68.5 ± 9.7 a |
Note: Values are mean ± standard error. Different lowercase letters within a column indicate significant differences (p < 0.05).
2.1.2 Analysis of Droplet Penetration into the Plant Canopy
The data clearly demonstrates the challenge of spray penetration for an agricultural UAV in a tall, dense crop like tasseling-stage corn. At a constant flight altitude, deposition was always highest on the plant canopy (top), with the largest droplet size and greatest deposition volume. The middle and lower strata received significantly less spray, with reductions in coverage density and deposition volume exceeding 50% in most cases, along with slightly smaller droplet sizes.
The effect of the agricultural UAV‘s flight altitude on penetration was pronounced. While canopy deposition parameters changed moderately, deposition in the middle and lower plant parts decreased sharply as altitude increased. When the agricultural UAV operated at 1.0 m above the canopy, the middle and bottom strata retained approximately 40-50% of the canopy’s coverage density and deposition volume. At 1.5 m altitude, these values dropped to about 25% (middle) and 33% (bottom) of the canopy level. At 2.0 m, penetration worsened further, with middle-stratum metrics falling to roughly 20% of the top and bottom-stratum metrics to about 25%. This trend indicates that the spray plume from the agricultural UAV becomes less able to penetrate the dense foliage as the release point moves higher, likely due to increased droplet drift and evaporation, and reduced downwash air assistance for canopy penetration.
2.2 Control Efficacy of Agricultural UAV Spraying
The control efficacy against the Asian corn borer is presented in Table 2. All treatments involving the agricultural UAV and the traditional sprayer provided effective control, with larval reduction exceeding 75% and corrected efficacy above 85% at 7 DAA.
The performance of the agricultural UAV was highly dependent on flight altitude. The highest efficacy was achieved at the 1.0 m altitude, with a larval reduction of 89.5% and a corrected control efficacy of 93.3%. This result was significantly superior to that of the traditional powered sprayer (78.9% reduction, 86.5% efficacy). At 1.5 m altitude, the agricultural UAV‘s efficacy (90.9%) was comparable to the ground sprayer. However, when the agricultural UAV operated at 2.0 m, its efficacy (85.8%) showed a significant decrease compared to its performance at 1.0 m, rendering it statistically similar to the traditional method but at the lower end of the high-efficacy spectrum.
Table 2. Control Efficacy of Agricultural UAV and Traditional Sprayer Against Asian Corn Borer.
| Treatment / Flight Altitude (m) | Pre-treatment Larvae (per 100 plants) | Larvae at 7 DAA (per 100 plants) | Larval Reduction, LR (%) | Control Efficacy, CE (%) |
|---|---|---|---|---|
| Agricultural UAV (1.0) | 19.0 | 2.0 | 89.5 ± 3.9 a | 93.3 ± 3.1 a |
| Agricultural UAV (1.5) | 21.0 | 3.0 | 85.7 ± 4.2 ab | 90.9 ± 2.9 ab |
| Agricultural UAV (2.0) | 18.0 | 4.0 | 77.8 ± 6.3 b | 85.8 ± 5.4 b |
| Traditional Sprayer | 19.0 | 4.0 | 78.9 ± 3.4 b | 86.5 ± 2.9 b |
| Untreated Control | 16.0 | 25.0 | -56.3 ± 2.6 c | — |
Note: Values are mean ± standard error. Different lowercase letters within a column indicate significant differences (p < 0.05). DAA: Days After Application.
3. Discussion and Conclusion
The agricultural UAV represents a high-concentration, low-volume spraying system that offers distinct advantages in operational efficiency and reduced labor intensity compared to conventional methods. As a novel application platform, its performance is governed by a complex interplay of flight parameters, formulation adjuvants, and meteorological conditions. This study focused specifically on the critical parameter of flight altitude and its impact on both spray quality and the biological outcome of pest control.
The findings confirm that the flight altitude of an agricultural UAV is a decisive factor influencing spray quality and subsequent efficacy. As altitude increased, droplet deposition on the hard-to-reach middle and lower sections of the corn plants—where pests like the corn borer often reside—decreased significantly. This reduction in penetration directly correlated with a decrease in control efficacy. The optimal altitude for this specific agricultural UAV model, crop stage, and pest was determined to be 1.0 m above the canopy. At this height, the agricultural UAV not only matched but significantly surpassed the efficacy of a traditional high-volume ground sprayer, demonstrating the potential for superior pest control with a fraction of the spray volume.
A key insight from this work is the demonstrable link between quantitative spray quality indicators and the final biological efficacy. Metrics such as droplet coverage density ($\bar{D}$), spray deposition volume ($\bar{Q}$), and droplet size ($\bar{VMD}$) in the critical middle and lower plant strata showed a positive correlation with control efficacy ($CE$). This relationship can be conceptually framed as:
$$ CE = f(\bar{D}_{mid/bot}, \bar{Q}_{mid/bot}, \bar{VMD}_{mid/bot}, …) $$
where higher values of these deposition metrics in the target zone generally lead to improved pest control. Therefore, optimizing the operational parameters of an agricultural UAV to enhance these measurable quality indicators provides a direct pathway to improving field performance.
In practical agricultural UAV operations, spray quality is not predetermined but can be actively managed by adjusting technical parameters such as flight altitude, speed, spray swath overlap, and flow rate. Prior to large-scale operations, it is essential to conduct preliminary tests under local conditions—considering specific crop architecture, growth stage, and expected weather—to identify the parameter set that yields the optimal combination of spray quality indicators. This study, under the described conditions, successfully identified 1.0 m as the optimal flight height for corn borer control. This methodology serves as a model for parameter optimization for other crops, pests, and agricultural UAV systems, ensuring that this powerful technology delivers consistent, reliable, and effective pest management.
In conclusion, the agricultural UAV is a highly effective tool for crop protection, capable of outperforming traditional methods when its operational parameters are correctly optimized. The flight altitude is a critical parameter that profoundly affects droplet penetration into dense canopies and the resulting deposition on target surfaces. By methodically evaluating spray quality indicators and their correlation with pest control efficacy, operators and agronomists can scientifically determine the best practices for agricultural UAV deployment, thereby maximizing its economic and environmental benefits in integrated pest management programs.