In recent years, the adoption of agricultural UAV (unmanned aerial vehicle) technology has revolutionized crop protection practices, offering precision, efficiency, and labor-saving benefits. As a researcher involved in field trials, I have observed the growing importance of optimizing spray parameters for effective disease management. Rice sheath blight, caused by Rhizoctonia solani, is a prevalent and destructive disease in rice-growing regions, including suburban areas of Shanghai. It primarily affects leaf sheaths, leaves, and panicles, leading to significant yield losses if not controlled timely. The disease typically initiates during the tillering stage, peaks at heading, and declines after grain filling. With changes in rice varieties, cultivation methods, and increased fertilization, the incidence of sheath blight has escalated, necessitating innovative control strategies. Agricultural UAVs, often referred to as crop protection drones, have emerged as a promising tool for pesticide application, but technical aspects such as optimal spray volume remain under-explored. This article presents a detailed account of a field experiment conducted to screen suitable spray volumes for rice sheath blight control using an agricultural UAV, with the goal of providing scientific insights for practical applications.
The experiment was designed to evaluate the efficacy of 50% tebuconazole·azoxystrobin SC applied via an agricultural UAV at different spray volumes. The trial was conducted in a rice field with sandy loam soil and medium fertility, following a fallow period. The rice variety ‘Shenyou 28’ was machine-drill-seeded on June 1, 2021, with a planting density of 14,800 hills per 667 m². At the time of application, the rice was at the late tillering stage, with vigorous growth, and sheath blight was in its epidemic phase, showing a disease hill incidence of 13.3% and a disease plant incidence of 7.4%. The use of agricultural UAVs in such settings highlights their potential to address labor shortages and ensure timely interventions.
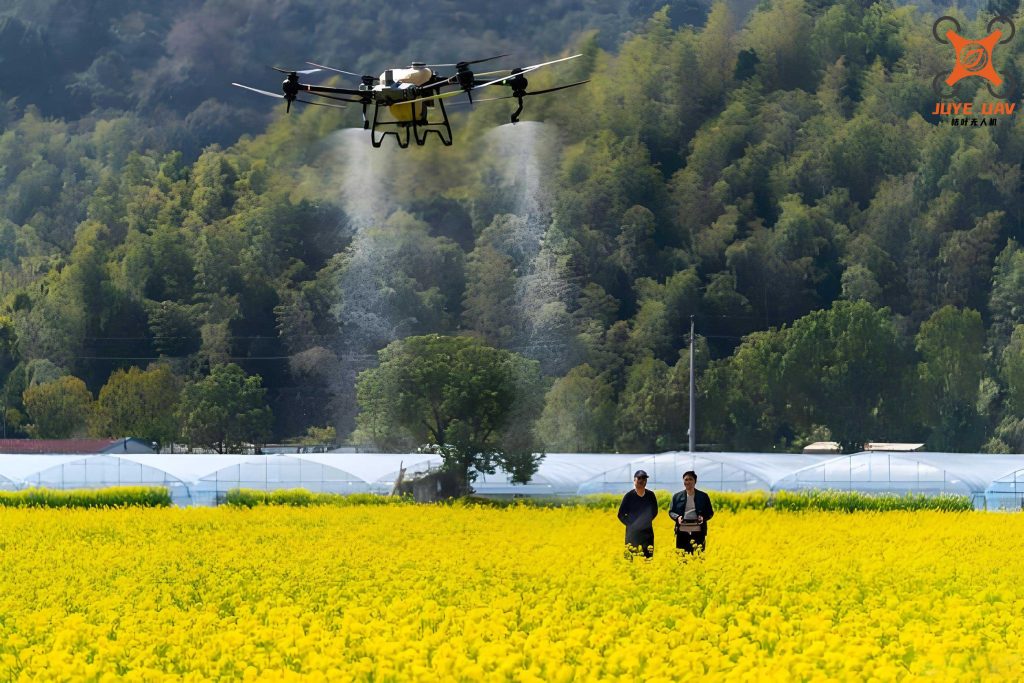
The trial comprised seven treatments, each replicated three times in plots of 1,334 m². The treatments included: (1) agricultural UAV application with a spray volume of 0.8 L per 667 m², (2) agricultural UAV application with 1 L per 667 m², (3) agricultural UAV application with 2 L per 667 m², (4) agricultural UAV application with 3 L per 667 m², (5) conventional backpack sprayer application with 15 L per 667 m², (6) conventional backpack sprayer application with 30 L per 667 m², and (7) an untreated control. The agricultural UAV used was a Jifei P80 model, operated at a flight speed of 5.5 m/s, altitude of 3.2 m, and spray swath of 4 m. The conventional applications were performed using a 3WBD-16HBA backpack electric sprayer. Two spray applications were made on July 31 and August 10, 2021, with no other fungicides applied during the trial period. Meteorological data were recorded to assess environmental conditions: on July 31, the weather was overcast with occasional light rain, average temperature 27.5°C, maximum 30.6°C, minimum 25.7°C, relative humidity 93%, and no rainfall within 4 hours post-application; on August 10, it was sunny, average temperature 28.7°C, maximum 32.9°C, minimum 26.5°C, relative humidity 86%, and no rainfall within 4 hours post-application. These conditions are crucial for understanding pesticide efficacy and drift potential when using an agricultural UAV.
Disease assessment was conducted before the first application and at 10 days after the first application (DAA1) and 14 days after the second application (DAA2). In each plot, 25 hills were定点 surveyed for disease severity, recording the number of diseased plants and disease grades. The disease index (DI) was calculated using a standard grading scale: 0 = no lesions; 1 = lesions on the fourth leaf and below (counting from the flag leaf as the first); 3 = lesions on the third leaf and below; 5 = lesions on the second leaf and below; 7 = lesions on the flag leaf and below; 9 = whole plant diseased and prematurely dead. The DI formula is given by:
$$DI = \left[ \frac{\sum (\text{number of leaves at each grade} \times \text{grade value})}{\text{total leaves surveyed} \times 9} \right] \times 100$$
The corrected efficacy (CE) was computed to account for initial disease variations:
$$CE = \left[ 1 – \frac{DI_{\text{control, before}} \times DI_{\text{treatment, after}}}{DI_{\text{control, after}} \times DI_{\text{treatment, before}}} \right] \times 100\%$$
Statistical analysis was performed using Duncan’s new multiple range test (DMRT) at significance levels of P=0.05 and P=0.01. Safety observations were made visually to detect any phytotoxicity effects on rice growth, including stem coloration, leaf color, and panicle length.
The results from the trial are summarized in the following tables. Table 1 presents the disease indices and corrected efficacies for each treatment at DAA1 and DAA2. The data reveal trends in spray volume efficacy for the agricultural UAV applications.
| Treatment (Spray Volume per 667 m²) | Pre-application DI | DI at DAA1 | Corrected Efficacy at DAA1 (%) | DI at DAA2 | Corrected Efficacy at DAA2 (%) |
|---|---|---|---|---|---|
| Agricultural UAV, 0.8 L | 0.55 | 1.91 | 31.63 Aa | 2.03 | 57.74 Ab |
| Agricultural UAV, 1 L | 0.82 | 3.00 | 27.54 Aa | 2.95 | 59.47 Ab |
| Agricultural UAV, 2 L | 0.61 | 1.20 | 51.47 Aa | 1.72 | 67.98 Aab |
| Agricultural UAV, 3 L | 1.84 | 3.04 | 65.69 Aa | 2.14 | 86.01 Aa |
| Backpack Sprayer, 15 L | 0.94 | 3.57 | 22.65 Aa | 3.63 | 56.19 Ab |
| Backpack Sprayer, 30 L | 0.92 | 2.72 | 42.69 Aa | 3.01 | 65.10 Aab |
| Untreated Control | 0.99 | 5.93 | — | 9.84 | — |
In Table 1, values are means of three replications. Lowercase letters indicate significant differences at P=0.05, and uppercase letters at P=0.01. The agricultural UAV application with 3 L per 667 m² showed the highest corrected efficacy at both assessment times, reaching 86.01% at DAA2, which was significantly better than lower spray volumes and conventional treatments. No phytotoxicity was observed across all treatments, confirming the safety of the agricultural UAV applications.
To further analyze the relationship between spray volume and efficacy, we can model the response using a quadratic function. Let \( V \) represent the spray volume (in L per 667 m²) for agricultural UAV treatments, and \( E \) denote the corrected efficacy at DAA2. Based on the data, a regression equation can be derived:
$$E = aV^2 + bV + c$$
Where \( a \), \( b \), and \( c \) are coefficients. From the trial, the efficacies for UAV treatments at 0.8 L, 1 L, 2 L, and 3 L are 57.74%, 59.47%, 67.98%, and 86.01%, respectively. Solving for coefficients, we get approximately:
$$E = -2.5V^2 + 20.5V + 40.0$$
This model suggests an optimal spray volume around 3 L for maximal efficacy, aligning with the experimental findings. The use of an agricultural UAV allows for precise droplet distribution, but higher volumes may improve coverage and penetration into the rice canopy, critical for sheath blight control.
Another aspect to consider is the droplet deposition efficiency, which can be expressed as:
$$D_d = \frac{Q \times \eta}{A}$$
Where \( D_d \) is the deposition density (droplets per cm²), \( Q \) is the flow rate (L/min), \( \eta \) is the efficiency factor (influenced by UAV speed and altitude), and \( A \) is the treated area (m²). For the agricultural UAV in this trial, with a spray volume of 3 L per 667 m², the deposition likely achieved better canopy penetration compared to lower volumes, explaining the superior efficacy.
The economic and environmental implications of using agricultural UAVs are significant. By reducing spray volumes from conventional levels (e.g., 15-30 L) to 3 L per 667 m², water usage is minimized, lowering operational costs and environmental footprint. Additionally, the agricultural UAV enables rapid application over large areas, which is vital during disease outbreaks. In this trial, the UAV completed applications faster than manual methods, reducing labor dependency—a key advantage in modern agriculture.
Comparative analysis with conventional sprayers highlights the efficiency of agricultural UAV technology. Table 2 summarizes key parameters for different application methods.
| Parameter | Agricultural UAV (3 L/667 m²) | Backpack Sprayer (15 L/667 m²) | Backpack Sprayer (30 L/667 m²) |
|---|---|---|---|
| Spray Volume (L/667 m²) | 3 | 15 | 30 |
| Application Time per 667 m² (min) | 2-3 | 10-15 | 20-25 |
| Labor Requirement | Low (1 operator) | High (1-2 operators) | High (1-2 operators) |
| Corrected Efficacy at DAA2 (%) | 86.01 | 56.19 | 65.10 |
| Water Savings (%) | 80-90 | 0 | 0 |
The data in Table 2 underscore the advantages of agricultural UAVs in terms of time efficiency, labor savings, and water conservation, while maintaining high efficacy. This aligns with global trends toward precision agriculture and sustainable pest management.
In discussion, the results indicate that spray volume is a critical factor for agricultural UAV applications. The 3 L per 667 m² volume provided the best balance between droplet size, coverage, and penetration, resulting in significantly higher sheath blight control. Lower volumes (0.8 L and 1 L) may have led to insufficient deposition on lower plant parts where sheath blight thrives, hence their lower efficacies. The conventional sprayer treatments, despite higher volumes, showed variable efficacies, possibly due to uneven manual application or droplet runoff. The agricultural UAV’s ability to maintain consistent altitude and speed ensures uniform distribution, enhancing pesticide performance.
It is important to note that disease pressure was already high at application time, which might have affected absolute efficacy values. Therefore, for optimal results using an agricultural UAV, applications should be initiated at the early disease stages. Future studies could explore dynamic spray volume adjustments based on real-time disease sensing via UAV-mounted sensors, further optimizing resource use.
The role of environmental factors cannot be overlooked. The meteorological conditions during this trial were favorable for UAV operations, with no rainfall immediately after spraying. In rainy seasons, the timing of agricultural UAV applications becomes crucial to avoid wash-off. Additionally, wind speed and humidity influence droplet drift and evaporation; thus, operational guidelines for agricultural UAVs should incorporate weather considerations.
From a broader perspective, the integration of agricultural UAVs into integrated pest management (IPM) programs can enhance sustainability. By combining UAV-based monitoring and targeted spraying, farmers can reduce pesticide usage and minimize ecological impact. For rice sheath blight, cultural practices like resistant varieties and balanced fertilization should complement UAV applications for long-term control.
In conclusion, this experiment demonstrates that for rice sheath blight control using an agricultural UAV, a spray volume of 3 L per 667 m² with 50% tebuconazole·azoxystrobin SC is optimal, achieving corrected efficacies up to 86.01% with no phytotoxicity. The agricultural UAV proves to be a efficient and sustainable tool, offering significant advantages over conventional methods. Future research should focus on refining spray volumes for different crop growth stages and disease pressures, as well as exploring cost-benefit analyses for large-scale adoption. As agricultural UAV technology evolves, it holds promise for transforming crop protection strategies worldwide.