As project scales and complexities escalate, particularly in the realms of infrastructure and construction, traditional management methodologies are increasingly strained by demands for comprehensive, timely, and accurate data. The need for rapid acquisition of real-time site information to support critical decision-making has exposed the limitations of manual inspection and surveying. In this context, Unmanned Aerial Vehicle (UAV) technology has emerged as a transformative force, offering a powerful solution characterized by high mobility, cost-effectiveness, and extensive coverage. The integration of China UAV drone technology into project management represents a significant advancement with profound theoretical and practical implications. Theoretically, it expands the informatization framework of project management and fosters a deeper fusion between aerial robotics and project management disciplines. Practically, it dramatically enhances data collection efficiency, reduces labor costs and safety risks, and provides robust data support for progress monitoring, quality control, safety management, and resource allocation, thereby elevating overall project performance and economic outcomes.
The application of China UAV drone systems in engineering project management has evolved into a diversified toolkit applicable across the entire project lifecycle. From aerial surveying in the planning phase to progress tracking during execution, and extending to quality inspection, safety oversight, and logistics monitoring, drones provide indispensable data for managerial decisions. However, current implementations face notable constraints: data acquisition is hampered by weather, battery life, and regulatory limitations, while data processing grapples with challenges like fusing massive heterogeneous datasets, improving algorithmic recognition accuracy, and establishing unified standards. The inherent complexity of modern projects demands more from China UAV drone technology, requiring breakthroughs in balancing macro-monitoring with micro-detail capture, ensuring data timeliness, integrating multi-dimensional information, and developing targeted solutions. While international firms and leading domestic companies in China have begun adoption, fully unlocking the potential of China UAV drone technology necessitates continued innovation and interdisciplinary collaboration to build more intelligent and efficient data acquisition and processing ecosystems for project management.
UAV Data Acquisition Technology Research
Effective data acquisition begins with a thorough analysis of project needs, encompassing spatial, temporal, and feature-based information. To address this, we have designed a hierarchical collection strategy framework consisting of Routine Patrols, Focused Detailed Surveys, and Emergency Response collections. This strategy employs fixed waypoints and overlapping area designs to ensure data comparability over time and adjusts collection priorities based on the project’s critical path and risk assessment. Such a stratified approach guarantees comprehensive coverage while optimizing efficiency and cost-control. Different project types, such as linear corridors (roads, pipelines), areal sites (building complexes), and vertical structures, demand tailored flight patterns—’corridor multi-angle,’ ‘grid-based,’ and ‘ascending spiral’ modes, respectively.
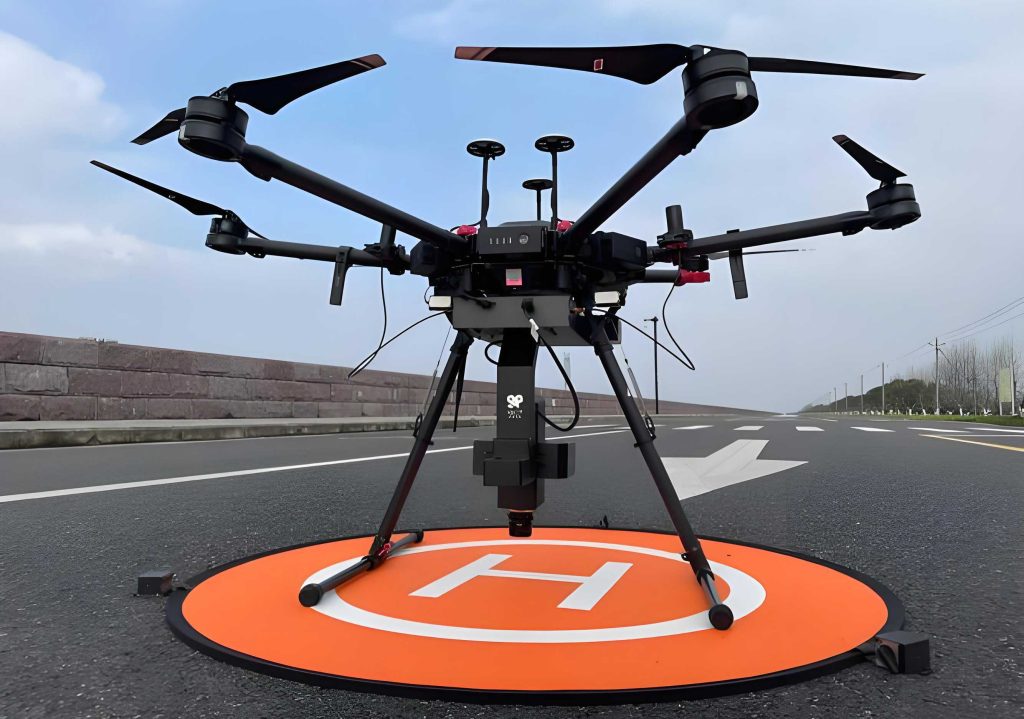
To meet the multi-dimensional data demands of complex project management, we have architected a sophisticated multi-sensor data acquisition system. This system integrates optical RGB cameras, thermal imagers, LiDAR sensors, and multispectral cameras on a modular, adjustable gimbal platform. The overall architecture is layered, comprising a Hardware Integration Layer, Data Capture Layer, Transmission & Control Layer, and Application Interface Layer. This design enables synchronized capture of geometric, thermal, and material properties in a single flight mission, solving the problem of insufficient informational dimensions from single-sensor setups. Key technical specifications of our integrated system are summarized in Table 1.
| Category | Parameter Name | Specification / Target Value |
|---|---|---|
| Platform Performance | Payload Capacity | ≥ 2.5 kg |
| Endurance | ≥ 35 minutes | |
| Wind Resistance | Level 6 | |
| Sensor Performance | Optical Camera Resolution | 48 Megapixels |
| Thermal Imaging Accuracy | ±2°C | |
| LiDAR Ranging Accuracy | ±2 cm | |
| Data Link | Real-time Transmission Rate | ≥ 50 Mbps |
| Transmission Latency | < 200 ms |
Optimizing flight and sensor parameters for specific project scenarios is crucial for balancing data quality, coverage, and operational cost. We established a parameter optimization model based on project characteristics, with key variables including flight altitude, speed, camera angle, image overlap, and collection frequency. Using the Analytic Hierarchy Process (AHP) to determine parameter weights, we formulate an optimization objective function:
$$ F = w_1 \cdot E_1 + w_2 \cdot E_2 + w_3 \cdot E_3 + w_4 \cdot E_4 $$
where $E_1$ represents data accuracy, $E_2$ coverage completeness, $E_3$ timeliness, and $E_4$ cost-effectiveness, with $w_1$ to $w_4$ as their respective weight coefficients. A Particle Swarm Optimization (PSO) algorithm is employed to solve for the optimal parameter set. Application of this model has demonstrated efficiency improvements exceeding 25% and cost reductions of over 30% while maintaining data integrity, particularly in complex terrains.
Core UAV Data Processing Technologies
UAV-collected project data is typically large-scale, heterogeneous, and variable in quality, necessitating a systematic preprocessing and quality control (QC) pipeline. Our established workflow includes data ingestion, cleaning, filtering, and standardized transformation. Specific algorithms are applied per data type: histogram equalization and adaptive thresholding for optical imagery; temperature drift correction and radiometric calibration for thermal data; outlier filtering and density homogenization for LiDAR point clouds. A four-dimensional QC system evaluates data based on Completeness, Accuracy, Consistency, and Timeliness, using the指标体系 outlined in Table 2. An automated QC and alert mechanism flags substandard data for re-collection. This process elevates data usability from approximately 68% with traditional methods to over 92%, processing an average of 30 GB of mixed data per hour to meet large-project demands.
| Quality Dimension | Indicator Name | Evaluation Method | Acceptance Threshold |
|---|---|---|---|
| Completeness | Area Coverage Rate | Covered Area / Planned Area | ≥ 95% |
| Data Gap Rate | Missing Data Volume / Total Data Volume | ≤ 3% | |
| Accuracy | Spatial Georeferencing Accuracy | Error at Ground Control Points | ≤ 5 cm |
| Resolution | Image Sharpness Test | ≥ 300 DPI | |
| Consistency | Multi-survey Consistency | Comparison of Repeated Survey Data | Difference ≤ 5% |
| Multi-source Data Coordination | Comparison of Multi-sensor Data for Same Target | Difference ≤ 8% | |
| Timeliness | Timestamp Accuracy Rate | Timestamp Validation | ≥ 98% |
| Data Processing Delay | Time from Acquisition to Usability | ≤ 2 hours |
Automated analysis of project imagery for progress, defects, and hazards requires advanced computer vision. We developed a processing suite based on deep learning. Core algorithms include an enhanced Faster R-CNN for detecting structural elements and YOLOv5 for identifying equipment, materials, and personnel. Trained on a custom dataset of over 10,000 annotated engineering images under various conditions and leveraging transfer learning, our models achieve high accuracy. The integration of attention mechanisms and Feature Pyramid Networks (FPN) boosts object detection accuracy to 92.3% in complex backgrounds. For quality defect detection, a U-Net++ based semantic segmentation network enables pixel-level identification of issues like concrete cracks (minimum detectable width: 0.5 mm) and steel deformation. This integrated visual intelligence system improves processing efficiency by 8x compared to manual checks and reduces missed detections by 35%.
Fusing data from multiple sensors to create a comprehensive project digital twin is a cornerstone technology. We employ a hierarchical fusion strategy: Data-level fusion (spatial and temporal alignment), Feature-level fusion (complementary feature extraction via CNNs), and Decision-level fusion (integrating analysis results from all modules). For 3D reconstruction, we combine improved Structure from Motion (SfM) and Multi-View Stereo (MVS) algorithms with LiDAR point clouds for geometric refinement. The core pipeline—feature matching, sparse reconstruction, dense reconstruction, and texturing—generates high-fidelity models. Incorporating depth priors and utilizing GPU-accelerated, tiled reconstruction methods, we can generate centimeter-accurate 3D models for a mid-sized project (~50,000 m²) within 2 hours. This capability transforms management from 2D plan review to immersive 3D oversight, reducing problem identification time by an average of 40%.
Integrated System for UAV Data Application in Project Management
The project progress monitoring and analysis system forms the operational core of China UAV drone data application. Designed around a “Plan-Actual-Variance” framework, its four-layer architecture includes Data Ingestion, Processing & Analytics, Business Application, and User Interaction layers. It automates the conversion of visual data into quantifiable progress metrics. The system utilizes a progress evaluation model:
$$ PI = \frac{\sum (W_i \times C_i)}{\sum (W_i \times P_i)} $$
where $PI$ is the Progress Index, $W_i$ is the work package weight, $C_i$ is the actual completion, and $P_i$ is the planned completion. The system automatically flags deviations on the critical path. Implementation has shortened progress monitoring cycles from 7-10 days to 1-2 days, increased judgment accuracy to over 90%, and demonstrated an impressive return on investment of approximately 1:15.
Our integrated quality assessment and risk warning model synthesizes multi-source UAV data into a holistic risk management framework. Quality is assessed across four dimensions: Structural Safety, Aesthetic Quality, Functional Performance, and Environmental Impact. The core is a Bayesian Network-based risk assessment framework that accounts for interdependencies between factors. A three-tiered warning mechanism (Advisory, Warning, Emergency) is triggered based on a quantified Quality Risk Index (QRI). The QRI is calculated, and corresponding actions are defined, as shown in Table 3. The model, enhanced by multispectral and thermal data, can identify hidden defects, providing an average early warning lead time of 7-10 days for over 80% of quality issues, significantly reducing rework and failure costs.
| Risk Tier | Calculation Formula | Alert Threshold | Response Action |
|---|---|---|---|
| Advisory | $QRI = P \times I \times D \leq 30$ | $15 < QRI \leq 30$ | Routine monitoring, scheduled review. |
| Warning | $QRI = P \times I \times D$ | $30 < QRI \leq 60$ | Increase inspection frequency, develop mitigation plan. |
| Emergency | $QRI = P \times I \times D > 60$ | $QRI > 60$ | Immediate intervention, activate emergency protocol. |
Note: $P$ = Probability of occurrence (1-10), $I$ = Impact severity (1-10), $D$ = Detectability difficulty (1-10, lower=easier to detect).
The data visualization and decision support platform is the culmination point where data transforms into actionable insight. Built on a microservices architecture with WebGL for high-performance 3D rendering, it provides a “Visualization-Interaction-Intelligence” continuum. It supports multiple visualization forms: 3D model navigation, progress heatmaps, risk distribution charts, and resource flow diagrams. The interactive “drill-down” analysis allows managers to navigate from a macro project view down to individual component details. The decision support engine, powered by case-based reasoning and knowledge graphs, retrieves historical analogies and suggests context-aware solutions. Role-customized interfaces for project managers, engineers, and inspectors, coupled with mobile alerts and integration with enterprise systems (ERP, OA), create a closed-loop information ecosystem. This platform has reduced average decision-making time by 45% and improved decision accuracy by 32%, proving especially valuable in complex, multi-stakeholder projects by minimizing information asymmetry.
Conclusion
This research systematically develops a complete theoretical and technological framework for China UAV drone-assisted data acquisition and processing in project management. We have proposed a demand-driven, hierarchical data collection strategy and a versatile multi-sensor system architecture, complemented by scenario-specific parameter optimization methods, enabling efficient and comprehensive project data capture. On the processing front, we constructed robust pipelines for large-scale heterogeneous data preprocessing and quality control, implemented advanced deep learning techniques for intelligent image analytics, and created effective multi-source data fusion and 3D reconstruction methodologies. These efforts successfully address key technical bottlenecks in engineering data handling. Furthermore, we established practical application systems—encompassing progress monitoring, quality risk assessment, and an immersive decision support platform—forming a closed loop from raw data collection to managerial value creation. The implementation of this integrated China UAV drone technology system has demonstrably broken through the traditional barriers of difficult data access, slow processing, and superficial application. Validated through real-world applications in major infrastructure projects, the system delivers tangible results: improving project management efficiency by 25-45%, increasing risk identification rates by over 80%, and generating significant direct economic benefits. The findings provide a reliable and effective technological foundation for the digital transformation of engineering project management.