
In modern agriculture, the efficient monitoring of crop physiological parameters is crucial for enhancing productivity and ensuring sustainable practices. Chlorophyll content, a key indicator of plant health and photosynthetic efficiency, directly influences growth and yield. Traditional methods for chlorophyll assessment, such as chemical extraction or handheld SPAD meters, are often destructive, time-consuming, and limited in spatial coverage. With the advent of remote sensing technologies, unmanned aerial vehicles (UAV drones) have emerged as powerful tools for rapid, non-invasive, and large-scale crop monitoring. These UAV drones equipped with multispectral or hyperspectral sensors enable the collection of high-resolution imagery, facilitating detailed analysis of crop conditions. Among various data processing techniques, texture analysis from UAV drone imagery offers unique advantages by capturing spatial patterns and structural details of plant canopies that conventional spectral indices might miss. This study focuses on leveraging UAV drone-derived texture features and newly constructed texture indices to estimate soybean chlorophyll content, providing a robust framework for precision agriculture.
The integration of UAV drones in agricultural monitoring has revolutionized data acquisition, allowing for frequent and accurate assessments of crop status. Unlike satellite-based remote sensing, UAV drones offer flexibility in flight planning, higher spatial resolution, and the ability to operate under cloud cover, making them ideal for field-scale applications. Multispectral sensors on UAV drones capture reflectance data across specific bands, such as blue, green, red, red-edge, and near-infrared, which are sensitive to vegetation properties. By analyzing these data, vegetation indices like the Normalized Difference Vegetation Index (NDVI) have been widely used to estimate chlorophyll content. However, spectral indices alone may not fully capture the complexity of plant physiology, especially under varying environmental conditions. Texture features, derived from image processing, provide complementary information by quantifying the spatial distribution of pixel intensities, reflecting canopy structure, leaf arrangement, and biomass density. In recent years, researchers have explored texture-based approaches to improve the estimation accuracy of crop parameters, such as leaf area index, water content, and nitrogen status. For instance, studies have shown that texture features from UAV drone imagery can enhance the prediction of soil moisture and chlorophyll content in crops like soybean and wheat. Building on this, our research aims to develop and evaluate texture indices—combinations of texture features—for estimating soybean chlorophyll content, using advanced machine learning models to optimize performance.
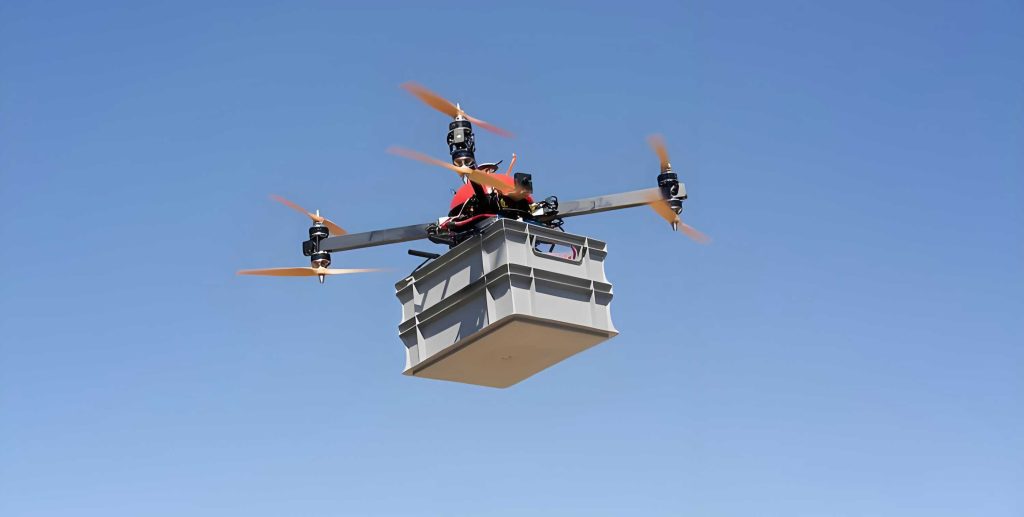
To conduct this study, we designed a field experiment over two consecutive growing seasons, focusing on soybean crops under different management practices. The experimental plots included various treatments, such as mulching methods and supplemental irrigation, to induce variability in chlorophyll levels. We used a quadcopter UAV drone equipped with a multispectral camera system, which captured imagery across six spectral bands: blue (450 nm), green (555 nm), red (660 nm), red-edge 1 (720 nm), red-edge 2 (750 nm), and near-infrared (840 nm). Flights were conducted at a height of 30 meters during the flowering stage, ensuring clear weather conditions to minimize atmospheric interference. The imagery was processed using photogrammetric software to generate orthomosaics, followed by radiometric calibration using white reference panels. From each plot, we extracted regions of interest representing the soybean canopy, excluding soil and shadow areas to focus on vegetation.
Simultaneously, we measured chlorophyll content as SPAD values using a handheld chlorophyll meter. For each plot, we randomly selected multiple plants and measured SPAD readings from leaves at different positions—top, middle, and base—to obtain an average value per plot. This ground-truth data served as the reference for model development. The use of UAV drones allowed us to collect synchronized spatial data, enabling a direct correlation between image-derived features and physiological measurements.
From the processed multispectral images, we extracted texture features using the gray-level co-occurrence matrix (GLCM) method, a common approach for texture analysis in remote sensing. For the near-infrared band, which is highly sensitive to vegetation vigor, we computed eight texture features: mean (MEA), variance (VAR), homogeneity (HOM), contrast (CON), dissimilarity (DIS), entropy (ENT), second moment (SEM), and correlation (COR). The calculation was performed with a moving window of size 7×7 and a pixel offset of 1 in both x and y directions. These texture features capture different aspects of canopy texture; for example, MEA indicates average reflectance, VAR represents variability, and CON measures local contrast. The formulas for these features are based on the probability distribution of pixel pairs in the GLCM. Let $$P(i,j)$$ be the probability of pixels with gray levels i and j occurring at a given offset. Then, the texture features can be defined as:
$$MEA = \sum_{i,j} i \cdot P(i,j)$$
$$VAR = \sum_{i,j} (i – MEA)^2 \cdot P(i,j)$$
$$HOM = \sum_{i,j} \frac{P(i,j)}{1 + (i-j)^2}$$
$$CON = \sum_{i,j} (i-j)^2 \cdot P(i,j)$$
$$DIS = \sum_{i,j} |i-j| \cdot P(i,j)$$
$$ENT = -\sum_{i,j} P(i,j) \cdot \log(P(i,j))$$
$$SEM = \sum_{i,j} P(i,j)^2$$
$$COR = \sum_{i,j} \frac{(i – MEA)(j – MEA) \cdot P(i,j)}{VAR}$$
In addition to individual texture features, we constructed texture indices by combining pairs of texture features from different spectral bands. These indices are designed to enhance the relationship with chlorophyll content by reducing noise and highlighting specific patterns. Based on prior research, we defined six types of texture indices: Ratio Texture Index (RTI), Difference Texture Index (DTI), Additive Texture Index (ATI), Normalized Difference Texture Index (NDTI), Reciprocal Difference Texture Index (RDTI), and Reciprocal Additive Texture Index (RATI). The general formulas are as follows, where TF1 and TF2 represent two texture features (e.g., MEA from band 2 and MEA from band 5):
$$RTI = \frac{TF1}{TF2}$$
$$DTI = TF1 – TF2$$
$$ATI = TF1 + TF2$$
$$NDTI = \frac{TF1 – TF2}{TF1 + TF2}$$
$$RDTI = \frac{1}{TF1 – TF2}$$
$$RATI = \frac{1}{TF1 + TF2}$$
We randomly selected combinations of texture features from the six multispectral bands to compute these indices, resulting in multiple candidate indices for analysis. The goal was to identify indices with high correlation to SPAD values, which would then serve as input variables for machine learning models.
To evaluate the estimation performance, we divided the dataset into training and validation sets. Out of 54 plot samples, 36 were randomly selected for training and 18 for validation. We considered three input combinations for the models: Combination 1 (texture features only), Combination 2 (texture indices only), and Combination 3 (combined texture features and indices). For each combination, we selected parameters that showed significant correlation (p < 0.05) with SPAD values based on Pearson correlation analysis. Three machine learning algorithms were employed: Random Forest (RF), Backpropagation Neural Network (BPNN), and Extreme Gradient Boosting (XGBoost). These models are widely used in remote sensing for regression tasks due to their ability to handle nonlinear relationships and high-dimensional data. The RF model was configured with 100 decision trees, using bootstrap sampling and feature randomization. The BPNN had a single hidden layer with 10 neurons, trained using the Levenberg-Marquardt algorithm to minimize mean squared error. The XGBoost model was tuned via grid search, setting the number of estimators to 100, learning rate to 0.03, and maximum tree depth to 5. Model performance was assessed using the coefficient of determination (R²), root mean square error (RMSE), and mean relative error (MRE), calculated as:
$$R^2 = 1 – \frac{\sum_{i=1}^{n} (y_i – \hat{y}_i)^2}{\sum_{i=1}^{n} (y_i – \bar{y})^2}$$
$$RMSE = \sqrt{\frac{1}{n} \sum_{i=1}^{n} (y_i – \hat{y}_i)^2}$$
$$MRE = \frac{1}{n} \sum_{i=1}^{n} \left| \frac{y_i – \hat{y}_i}{y_i} \right| \times 100\%$$
where \(y_i\) is the measured SPAD value, \(\hat{y}_i\) is the predicted value, \(\bar{y}\) is the mean of measured values, and n is the number of samples.
The correlation analysis between texture features and SPAD values revealed that over half of the texture features showed significant correlations (p < 0.05). The highest correlation was observed for the mean (MEA) from the green band (band 2), with a coefficient of 0.642. Other notable features included variance (VAR) and contrast (CON) from multiple bands. This indicates that texture features related to average reflectance and local variability are strongly associated with chlorophyll content in soybean canopies. The results are summarized in Table 1, which lists the correlation coefficients for each texture feature across the six spectral bands. The use of UAV drones enabled the capture of these fine-scale texture patterns, highlighting their value in crop monitoring.
| Texture Feature | Band 1 (Blue) | Band 2 (Green) | Band 3 (Red) | Band 4 (Red-edge 1) | Band 5 (Red-edge 2) | Band 6 (NIR) |
|---|---|---|---|---|---|---|
| MEA | 0.592* | 0.642* | 0.610* | 0.427* | 0.171 | 0.165 |
| VAR | 0.632* | 0.510* | 0.237 | 0.500* | 0.475* | 0.498* |
| HOM | 0.468* | 0.019 | 0.095 | 0.117 | 0.256 | 0.262 |
| CON | 0.636* | 0.524* | 0.255 | 0.511* | 0.479* | 0.496* |
| DIS | 0.576* | 0.121 | 0.448* | 0.109 | 0.422* | 0.443* |
| ENT | 0.158 | 0.127 | 0.129 | 0.187 | 0.056 | 0.040 |
| SEM | 0.262 | 0.147 | 0.153 | 0.121 | 0.175 | 0.183 |
| COR | 0.236 | 0.408* | 0.547* | 0.437* | 0.615* | 0.576* |
For the texture indices, all randomly combined indices exhibited highly significant correlations (p < 0.01) with SPAD values. The Difference Texture Index (DTI) showed the highest correlation coefficient of 0.761, based on the combination of MEA from band 2 (green) and MEA from band 5 (red-edge 2). This suggests that differences in mean reflectance between these bands are particularly sensitive to chlorophyll variations. Other indices, such as the Normalized Difference Texture Index (NDTI) and Ratio Texture Index (RTI), also demonstrated strong correlations above 0.73. Table 2 presents the correlation coefficients and the texture feature combinations for the six indices. The construction of these indices from UAV drone data underscores the potential of texture-based approaches to enhance chlorophyll estimation beyond simple spectral reflectance.
| Texture Index | Correlation Coefficient | Texture Feature Combination |
|---|---|---|
| RTI | 0.738** | MEA from band 2, MEA from band 4 |
| DTI | 0.761** | MEA from band 2, MEA from band 5 |
| ATI | 0.655** | VAR from band 1, MEA from band 2 |
| NDTI | 0.739** | MEA from band 2, MEA from band 4 |
| RDTI | 0.693** | MEA from band 2, MEA from band 4 |
| RATI | 0.657** | DIS from band 3, COR from band 5 |
Using the selected input combinations, we trained and validated the machine learning models. The performance metrics for the validation set are summarized in Table 3. For all three models, Combination 3 (texture features plus texture indices) yielded the highest R² and lowest RMSE and MRE, indicating that combining both data types improves estimation accuracy. Among the models, XGBoost consistently outperformed RF and BPNN across all input combinations. With Combination 3, XGBoost achieved an R² of 0.883, RMSE of 0.886, and MRE of 1.638%, demonstrating excellent predictive capability. In contrast, RF and BPNN with Combination 3 had R² values of 0.851 and 0.832, respectively. This highlights the superiority of XGBoost in handling the complex relationships between texture variables and chlorophyll content, likely due to its gradient boosting framework that reduces bias and variance. The results affirm that UAV drone-derived texture information, when processed through advanced machine learning, can reliably estimate soybean chlorophyll content.
| Input Combination | Model | R² | RMSE | MRE (%) |
|---|---|---|---|---|
| Combination 1 (Texture Features) | RF | 0.798 | 1.245 | 2.456 |
| BPNN | 0.775 | 1.332 | 2.789 | |
| XGBoost | 0.815 | 1.178 | 2.312 | |
| Combination 2 (Texture Indices) | RF | 0.829 | 1.102 | 2.134 |
| BPNN | 0.801 | 1.221 | 2.467 | |
| XGBoost | 0.852 | 1.045 | 1.985 | |
| Combination 3 (Features + Indices) | RF | 0.851 | 0.998 | 1.892 |
| BPNN | 0.832 | 1.087 | 2.145 | |
| XGBoost | 0.883 | 0.886 | 1.638 |
The enhanced performance of texture indices compared to individual texture features can be attributed to their ability to normalize variations and amplify signals related to chlorophyll content. For example, the DTI, which subtracts one texture feature from another, may cancel out common noise sources while highlighting differences tied to physiological changes. The use of UAV drones allows for precise texture extraction at high resolutions, enabling such indices to capture subtle canopy patterns. Moreover, the combination of texture features and indices in Combination 3 provides a more comprehensive representation of canopy characteristics, integrating both raw texture metrics and their derived relationships. This multi-faceted approach likely mitigates overfitting and improves model generalizability across different growing conditions.
In discussing the machine learning models, XGBoost’s advantage stems from its regularization techniques and efficient handling of missing data, which are beneficial for UAV drone datasets that may contain irregularities. RF, while robust, may not capture complex interactions as effectively as boosting methods. BPNN, though powerful, required careful tuning to avoid overfitting due to the limited sample size, a common challenge in UAV-based studies. Future work could explore deep learning architectures or ensemble methods to further enhance accuracy. Additionally, the integration of UAV drone data with other sources, such as thermal imagery or soil sensors, could provide a holistic view of crop health. The scalability of this approach is promising for large-scale precision agriculture, where UAV drones can be deployed routinely to monitor chlorophyll dynamics and guide management decisions like fertilization and irrigation.
Despite the promising results, limitations exist. The spatial resolution of UAV drone imagery, while high, may still miss fine-scale leaf textures, especially under dense canopies. Variations in lighting conditions and flight altitudes can affect texture consistency, necessitating standardized protocols. The machine learning models, though validated, may require retraining for different cultivars or environments. To address these, future research should focus on improving sensor technologies on UAV drones, such as hyperspectral or LiDAR systems, to capture more detailed structural and spectral information. Developing adaptive models that incorporate temporal data from UAV drone time-series could also improve chlorophyll tracking throughout the growing season. Furthermore, exploring more advanced texture analysis methods, like fractal geometry or wavelet transforms, might yield additional insights.
In conclusion, this study demonstrates the efficacy of UAV drone-based texture indices for estimating soybean chlorophyll content. By leveraging multispectral imagery and texture analysis, we constructed indices like DTI that showed strong correlations with SPAD values. The combination of texture features and indices, when processed using the XGBoost model, achieved high accuracy (R² = 0.883), underscoring the potential for non-destructive, rapid monitoring in precision agriculture. UAV drones prove to be invaluable tools for capturing spatial data that enhances our understanding of crop physiology. As technology advances, the integration of UAV drones with machine learning will continue to revolutionize agricultural practices, enabling data-driven decisions that optimize resource use and boost yields. This research contributes to the growing body of knowledge on remote sensing applications, providing a framework for future studies aimed at sustainable crop management.