
The monitoring and assessment of water quality parameters are fundamental to ecological conservation and sustainable watershed management. Among these parameters, water clarity, often quantified by Secchi disk depth (SDD), serves as a vital integrative indicator of overall aquatic health. It reflects the combined influence of suspended particulate matter, chlorophyll-a concentration from phytoplankton, and colored dissolved organic matter. Traditional in-situ monitoring methods, while accurate, are labor-intensive, time-consuming, and spatially limited, making it challenging to capture the dynamic and heterogeneous nature of water bodies across large regions. This limitation is particularly acute in complex deltaic environments characterized by intricate networks of rivers, lakes, ponds, and canals.
Remote sensing technology offers a powerful alternative by enabling synoptic, frequent, and cost-effective observations. Satellite-based sensors have been widely used for monitoring clarity in large inland lakes and coastal waters. However, their application is often constrained by spatial resolution (typically tens to hundreds of meters), revisit time, and cloud cover. These constraints render them less effective for detailed monitoring of smaller water bodies such as narrow channels, aquaculture ponds, and village creeks, which are ecologically significant components of many watersheds.
This is where Unmanned Aerial Vehicle (UAV) drones emerge as a transformative tool. UAV drones, equipped with lightweight hyperspectral or multispectral sensors, provide an unprecedented capacity for high-resolution, on-demand remote sensing. They bridge the critical gap between coarse satellite imagery and sparse ground measurements. The flexibility of UAV drones allows for deployment under specific weather windows and over targeted areas of interest, generating centimeter-level spatial resolution data. This capability is indispensable for detailed environmental assessments, pollution tracing, and evaluating the efficacy of water management infrastructure in ecologically sensitive and strategically important areas.
This study focuses on a pioneering demonstration zone within a major river delta, an area designated as a benchmark for integrated regional development with an emphasis on ecological preservation. The core objective is to develop and apply a UAV drone-based hyperspectral remote sensing methodology for high-resolution water clarity monitoring across this diverse aquatic landscape. We integrate extensive field campaigns collecting coincident spectral and clarity measurements with large-scale UAV drone surveys. A robust empirical model for Secchi disk depth retrieval is developed and validated. Subsequently, this model is applied to process hyperspectral imagery covering approximately 54 km², revealing the detailed spatial distribution of water clarity and providing novel insights into the interactions between different water bodies and the impact of hydraulic engineering structures.
Study Area and Data Foundation
The research was conducted within a segment of a key town located in the pioneering start-up area of a major delta region’s integrated development zone. This area is typified by a dense hydrological network, including a critical trans-provincial river (River T), numerous lakes (locally called “dangs”), extensive aquaculture ponds, and a labyrinth of interconnected channels within polder systems. The region’s strategic importance is underscored by the presence of drinking water source areas. River T, a vital waterway, serves multiple functions including flood discharge, water supply, and navigation, making its water quality a matter of paramount concern. The complex interplay between the main river, polder-internal waters, and lakes necessitates a monitoring approach capable of discerning fine-scale spatial patterns.
1. Field Campaign and In-Situ Data Collection
A comprehensive field measurement campaign was executed across multiple dates from July to November 2024. A total of 155 synchronized datasets of water clarity and above-water spectral radiance were collected from various water bodies, including River T, its tributaries, internal polder channels, and lakes.
Water clarity was measured using a standard 30-cm diameter Secchi disk. The spectral data were acquired using a Triplet-AOP hyperspectral sensor system, which simultaneously measures downwelling irradiance (Ed(λ)), upwelling radiance from the water (Lu(λ)), and downwelling radiance from the sky (Lsky(λ)). The remote sensing reflectance (Rrs(λ)), the fundamental quantity for water color remote sensing, was calculated from these measurements to minimize the effects of sun glint and sky reflection. The standard calculation is as follows:
$$ R_{rs}(\lambda) = \frac{L_u(\lambda) – \rho \cdot L_{sky}(\lambda)}{E_d(\lambda)} $$
where ρ is the reflectance factor of the air-water interface, typically taken as a constant (e.g., 0.028 for relatively calm water conditions). The collected Rrs spectra were subsequently processed using a Savitzky-Golay filter to reduce noise.
The statistical summary of the in-situ Secchi disk depth measurements is presented in Table 1. The data shows a clear distinction between the main river (River T and its connected channel L) and the internal polder channels. The former generally exhibited higher average clarity, though with greater variability, while the latter showed lower and more consistent clarity values.
| Sampling Region | Average SDD (cm) | Standard Deviation (cm) | Measurement Range (cm) |
|---|---|---|---|
| River T & Channel L | 62.0 | 22.6 | 33 – 105 |
| Internal Polder Channels | 44.2 | 11.4 | 18 – 92 |
| Overall Dataset | 50.4 | 18.5 | 18 – 105 |
2. UAV Drone Hyperspectral Platform and Image Acquisition
The aerial survey platform consisted of a fixed-wing Vertical Take-Off and Landing (VTOL) UAV drone (model V10+) equipped with a push-broom hyperspectral imager (Specim AFX10). This UAV drone platform was selected for its endurance, capable of covering large areas in a single flight. The hyperspectral sensor captures data across the 400-1000 nm spectral range with 224 bands. Integrated GNSS/IMU provides precise geolocation and orientation data for each scan line, facilitating accurate geometric correction.
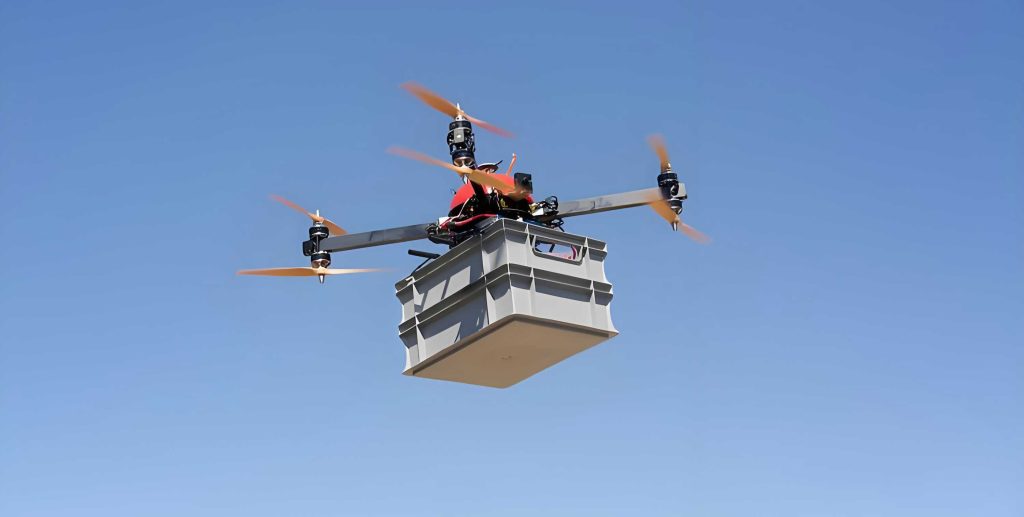
Two coordinated flight missions were conducted on August 5 and 6, 2024, under clear sky conditions. The technical parameters for the UAV drone missions are summarized in Table 2. The high spatial resolution of the resulting imagery is critical for identifying and analyzing small water features.
| Parameter | Specification |
|---|---|
| UAV Drone Platform | VTOL Fixed-Wing (V10+) |
| Sensor | Hyperspectral Imager (400-1000 nm) |
| Flight Altitude | 500 m AGL |
| Ground Sampling Distance (GSD) | ~0.42 m |
| Total Area Covered | ~54 km² |
| Data Acquisition Mode | Push-broom with integrated POS |
The raw hyperspectral data underwent a comprehensive preprocessing chain, including POS data post-processing, radiometric calibration using laboratory coefficients, geometric correction, and mosaicking. Conversion from radiance to reflectance was performed using empirical line calibration based on reference panels with known reflectance deployed within the survey area. The final product was a spatially seamless, high-resolution mosaic of surface reflectance, which was then converted to remote sensing reflectance Rrs for consistency with the field data model.
Development and Validation of the Clarity Retrieval Algorithm
1. Spectral Analysis and Band Selection
To develop an efficient model for UAV drone application, a spectral analysis was first performed. The field-measured Rrs spectra were resampled to match the spectral bands of the UAV drone sensor. Correlation analysis between single-band Rrs values and SDD revealed a strong negative correlation across all visible and near-infrared wavelengths (Figure 1). The strongest correlation (approximately -0.85) was observed in the red-edge region around 700 nm, a spectral region sensitive to both chlorophyll absorption/scattering and particulate backscattering.
$$ \text{Correlation}(SDD, R_{rs}(\lambda)) \approx -0.85 \quad \text{for} \quad \lambda \sim 700 \text{ nm} $$
To enhance the robustness of the retrieval model, we investigated band ratios and other combinations, which often normalize for unwanted variations in illumination or sensor gain. The band ratio Rrs(559 nm) / Rrs(694 nm) demonstrated one of the highest correlations with SDD (r = 0.924). The green band (559 nm) is in a region of relatively low absorption, while the red-edge band (694 nm) is highly sensitive to water constituents that reduce clarity. This ratio was therefore selected as the optimal predictor variable (X) for model development due to its high explanatory power and computational simplicity.
$$ X = \frac{R_{rs}(559)}{R_{rs}(694)} $$
2. Model Construction and Accuracy Assessment
Using the in-situ dataset, the relationship between the predictor variable X and SDD was modeled. Various function types (linear, polynomial, exponential, power) were tested. A third-order polynomial model provided the best fit without overfitting, as determined by validation on an independent subset of the data. The derived empirical model is:
$$ SDD = -75.8X^3 + 404.9X^2 – 634.4X + 338.6 $$
where SDD is the Secchi disk depth in centimeters, and X is the band ratio defined above.
The model’s performance was rigorously evaluated. The complete field dataset was randomly split into a training set (80%) and a validation set (20%). The model was fit using the training data and its predictive accuracy was assessed on the unseen validation data. Key performance metrics, including Root Mean Square Error (RMSE) and Mean Absolute Percentage Error (MAPE), were calculated (Table 3).
| Dataset | Root Mean Square Error (RMSE) | Mean Absolute Percentage Error (MAPE) |
|---|---|---|
| Model Training Set | 6.8 cm | 10.9% |
| Model Validation Set | 6.7 cm | 11.1% |
| Application on UAV Drone Imagery* | 2.5 cm | 5.1% |
*Accuracy assessed by extracting model values at pixel locations corresponding to field stations sampled on the same day as the UAV drone flight.
The validation results confirm the model’s robustness and generalizability. The slightly better performance when applied directly to the UAV drone imagery is attributed to the specific subset of field data used for that day’s validation, which fell within a narrower SDD range where the model performs optimally. The overall error of ~6.7 cm is considered acceptable for regional monitoring purposes, especially given the high spatial variability captured by the UAV drones.
Application: High-Resolution Clarity Mapping with UAV Drones
The validated model was operationally applied to the preprocessed UAV drone hyperspectral mosaics. Prior to model application, water pixels were delineated using a Normalized Difference Water Index (NDWI) adapted for the sensor’s bands:
$$ NDWI = \frac{R_{rs}(551) – R_{rs}(861)}{R_{rs}(551) + R_{rs}(861)} $$
A threshold was applied to the NDWI image to create a binary water mask, ensuring the model was only applied to aquatic areas.
1. Spatial Patterns of Water Clarity
The resulting clarity maps revealed intricate spatial patterns at a level of detail unattainable with satellite sensors. Key findings include:
- Low-Clarity Water Bodies: The most turbid areas (SDD < 30 cm) were consistently identified as active aquaculture ponds. Their spectral signatures, extracted from the UAV drone imagery, showed a pronounced peak near 700 nm and absorption features around 625 nm and 675 nm, indicative of high phytoplankton biomass, particularly cyanobacteria. Similarly, some of the larger lakes (“dangs”) exhibited lower clarity with spectral features suggesting algal dominance as the primary turbidity agent.
- High-Clarity Water Bodies: The clearest waters (SDD > 80 cm) were typically found in smaller, internal channels within the polder system, away from direct inflow from the main river or dense village areas. For example, channel J exhibited clarity values exceeding 120 cm in its upstream sections.
- River T Main Channel: The clarity in the main channel of River T was relatively stable along the 16-km surveyed stretch, with values centered around 45-50 cm. Slightly lower clarity was observed in the central navigation lane, likely due to sediment resuspension from vessel traffic. Riparian aquatic vegetation along the banks was associated with localized areas of higher clarity, visible in the UAV drone maps.
- Anthropogenic Influence: A clear impact of human settlement was observable. Channels passing through village centers showed a significant decrease in clarity compared to upstream or downstream rural sections. The UAV drone-derived maps quantitatively showed this decline, e.g., a drop from ~120 cm to ~60 cm as a channel flowed through a village, highlighting non-point source pollution inputs.
The area statistics of different clarity classes for the two survey dates are summarized in Table 4, providing a quantitative overview of the water quality state.
| Survey Date / Area | Clarity 20-40 cm (%) | Clarity 40-60 cm (%) | Clarity 60-80 cm (%) | Clarity >80 cm (%) |
|---|---|---|---|---|
| Aug 5 (Polder Area) | 37.8 | 50.3 | 7.3 | 4.6 |
| Aug 6 (River T Corridor) | 0.8 | 70.4 | 19.5 | 9.3 |
2. Insights into Hydrological Connectivity and Management
The high-resolution perspective offered by UAV drones provided unique insights into the interaction between different water masses and the role of water control structures.
- Effect of Sluice Gates: One of the most striking observations was the clear demarcation of water clarity at sluice gates connecting River T to the internal polder network. On the river side of a sluice, clarity was approximately 50 cm. Immediately on the polder side, clarity increased to about 80 cm. This ~30 cm difference, sharply visible in the UAV drone imagery, demonstrates the effectiveness of these gates in hydrologically isolating the polder system from the more turbid river water, a critical function for local water quality management.
- Confluence Dynamics: At the confluence of River T and a clearer tributary (Channel L), the UAV drone map revealed a distinct plume and mixing zone. The clarity gradient across the confluence illustrated how different water masses interact, with potential implications for sediment transport and pollutant dispersion that are difficult to assess with point measurements alone.
Conclusion and Perspectives
This study successfully demonstrates the significant value of integrating UAV drone technology with hyperspectral remote sensing for advanced water environment monitoring. The workflow, encompassing targeted field campaigns, empirical model development, and large-area UAV drone surveying, proved highly effective for mapping Secchi disk depth at a very high spatial resolution.
The key conclusions are:
- UAV drones are uniquely capable of capturing the fine-scale spatial heterogeneity of water clarity in a complex deltaic environment, revealing patterns in small channels, ponds, and along engineering structures that are invisible to conventional satellite monitoring.
- The developed empirical model, based on a simple green-to-red-edge band ratio, achieved a robust validation accuracy (RMSE ~6.7 cm), making it suitable for operational monitoring applications with UAV drones in similar water types.
- The analysis of UAV drone-derived clarity maps and associated spectra allowed for the differentiation of turbidity sources, identifying algal blooms as a primary cause in ponds and lakes versus mineral sediments in the main river.
- The data provided clear evidence of the spatial impact of human settlements on channel clarity and the quantifiable isolating effect of sluice gates, offering valuable evidence-based insights for water resource managers.
The use of UAV drones in this context is not merely a substitute for other methods but a complementary tool that opens new avenues for inquiry. Future work should focus on expanding temporal coverage through repeat UAV drone surveys to analyze seasonal and event-driven dynamics of clarity. Furthermore, the high-resolution hyperspectral data from UAV drones presents an opportunity to develop and test more sophisticated algorithms for retrieving concentrations of specific water constituents (chlorophyll-a, suspended sediments, phycocyanin) in these complex waters. Integrating UAV drone data with synchronous satellite imagery and data from fixed automatic monitoring stations will pave the way for a truly multi-scale, integrated “space-air-ground” observation system. This system will be essential for supporting the ecological management and green development goals of strategic regions like the integrated delta development zone, enabling precise, timely, and actionable intelligence for water conservation and pollution control.