
My research focuses on addressing a critical challenge in modern power infrastructure: the vulnerability of long-distance transmission lines to geological hazards such as landslides and collapses, particularly in mountainous regions. These linear assets often traverse complex, high-risk terrain where traditional ground-based monitoring is logistically difficult and risky, and where satellite remote sensing lacks the necessary spatial and temporal resolution for detailed, timely assessment. The application of UAV drones in this domain has grown, yet it often remains fragmented—targeting either the transmission assets or the hazard bodies in isolation, leading to a lack of integrated, multi-scale situational awareness. This work presents a systematic, UAV drones-centric technical framework that integrates vertical, oblique, and close-range photogrammetry across macro-regional, meso-corridor, and micro-local scales to enable comprehensive geological hazard prevention and control for transmission lines.
The core premise is that effective risk management requires a holistic view. One must understand the regional context of the hazard, its precise interaction with the linear corridor of towers and wires, and the detailed condition of critical local points like tower foundations. UAV drones are uniquely positioned to provide this integrated data. The proposed framework, developed and refined through field applications, encompasses a complete workflow from multi-mode field operations and multi-scale data fusion to the generation of actionable products for hazard identification, deformation monitoring, and mitigation design.
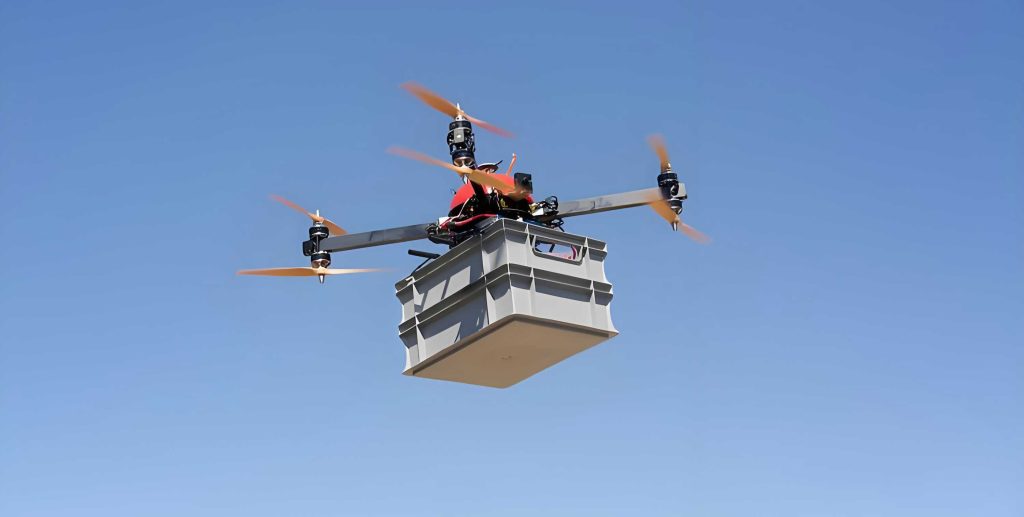
1. The Multi-Scale Technical Framework and Implementation Workflow
The technical framework is designed to be iterative and repeatable, ensuring efficiency for both initial surveys and follow-up monitoring campaigns. It is structured around three distinct spatial scales, each with a tailored UAV drones data acquisition strategy, which feed into a unified data processing and modeling pipeline.
1.1. Object-Scale Definition and Corresponding UAV Drones Mission Planning
The first step involves defining the area of interest at three complementary scales:
- Macro-Regional Scale (Area): This covers the entire transmission line segment deemed at high risk, typically 1–10 km². The objective is to capture the broader geomorphological context, including the full extent of potential landslide bodies, slope systems, drainage patterns, and the overall routing of the transmission corridor.
- Meso-Corridor Scale (Line): This focuses narrowly on the immediate vicinity of the high-risk transmission towers or a specific line segment, usually ≤1 km². It aims to model the precise spatial relationship between the infrastructure (towers, conductors) and the adjacent terrain or developing hazard features.
- Micro-Local Scale (Point): This targets specific, critical elements such as individual tower foundations, visible cracks on slopes near towers, or areas of active scarp development. The coverage is typically 1–1000 m², demanding ultra-high resolution.
For each scale, a specific UAV drones photogrammetric technique is deployed, with optimized flight parameters to balance coverage, resolution, and processing efficiency.
| Parameter | Macro-Regional (Area) | Meso-Corridor (Line) | Micro-Local (Point) |
|---|---|---|---|
| Primary Technique | Nadir (Vertical) Photogrammetry | Oblique Photogrammetry | Close-Range & Oblique Photogrammetry |
| Target GSD | ≤ 8.5 cm | ≤ 3.0 cm | ≤ 0.8 cm |
| Flight Mode | Terrain-following (using public DEM) | Terrain-following (using regional DSM) & Smart Oblique Capture | Orbit, Waypoint, Surface-following |
| Flight Altitude/Distance | 100–200 m AGL | 50–80 m AGL | 5–30 m from target surface |
| Flight Speed | 12–15 m/s | 10–12 m/s | 0.5–3 m/s |
| Camera Angles | -90° (Nadir) | -45° (Front/Rear), -90° (Nadir) | -30° to -5° (Dominant) |
| Forward Overlap | ≥ 80% | ≥ 80% | ≥ 80% |
| Side Overlap | ≥ 70% | ≥ 70% | ≥ 70% |
1.2. Integrated Data Processing and Fusion Modeling Workflow
The data from UAV drones missions, comprising thousands of high-resolution images, are processed using a Structure-from-Motion (SfM) and Multi-View Stereo (MVS) pipeline. The key innovation lies in the fusion of data from different scales.
Single-Scale Independent Modeling: Initially, image sets from each scale are processed separately to generate independent 3D outputs: dense point clouds, digital surface models (DSM), digital orthophoto mosaics (DOM), and textured 3D mesh models. This is crucial for tasks like multi-temporal comparison at a consistent scale.
Multi-Scale Fusion Modeling: To create a seamless, multi-resolution 3D scene, the sparse point clouds generated from the SfM step for each independent scale are first merged. Since all UAV drones imagery is geotagged in a consistent coordinate system (e.g., WGS-84 UTM) using high-precision GNSS-RTK, the sparse clouds typically align accurately. A global bundle adjustment is then performed on this fused sparse point cloud:
$$ \min_{\mathbf{T}_i, \mathbf{P}_j} \sum_{i=1}^{n} \sum_{j=1}^{m} v_{ij} \, d(\mathbf{Q}(\mathbf{T}_i, \mathbf{P}_j), \mathbf{x}_{ij})^2 $$
where \( \mathbf{T}_i \) represents the camera pose parameters for image \( i \), \( \mathbf{P}_j \) are the 3D coordinates of sparse point \( j \), \( \mathbf{Q} \) is the projection function, \( \mathbf{x}_{ij} \) is the observed 2D image coordinate, \( d() \) is the distance function, and \( v_{ij} \) is a visibility indicator. This step refines the geometry of the entire combined scene. Finally, MVS is applied to this optimized geometry to generate a unified, high-detail dense point cloud and subsequently, a fused 3D mesh model. This model integrates the broad coverage of the regional scan with the high-resolution detail of the corridor and local scans, providing an unparalleled basis for analysis.
2. Key Technical Methodologies for UAV Drones Operations and Analysis
2.1. Optimized Multi-Modal UAV Drones Field Operations
Effective field deployment of UAV drones is paramount. Key methodologies include:
- Platform and Sensor Selection: Utilizing RTK-enabled multi-rotor UAV drones is essential for achieving survey-grade accuracy without dense ground control points, which are often impractical in hazardous or remote terrain. These UAV drones provide direct georeferencing, streamlining processing and ensuring metric accuracy.
- Mission Automation and Repeatability: After initial mission planning and testing, all flight paths (for area, corridor, and local scans) are saved. Subsequent monitoring campaigns simply reload these missions, ensuring identical perspective and coverage for precise change detection. The use of terrain-following and smart oblique capture modes automates complex flights over uneven topography.
- Operational Consistency: Flights are conducted under similar weather and lighting conditions to minimize variations in image texture and shadows. Maintaining a fixed RTK solution throughout the flight and minimizing unnecessary drone landings or reboots between different scale missions enhances both efficiency and data consistency.
2.2. Quantitative Geohazard Analysis from UAV Drones Derivatives
The high-resolution products from UAV drones form the basis for quantitative hazard assessment. Core analytical methods include:
Hazard Identification and Mapping: Visual interpretation and semi-automatic classification of DOM and 3D mesh models allow for the rapid delineation of fresh scarps, tension cracks, disturbed vegetation, and areas of erosion. The 3D context is critical for discerning true geomorphic features.
Deformation Monitoring: Multi-temporal UAV drones surveys enable precise quantification of surface change. Two primary methods are employed:
- 3D Point Cloud Comparison (M3C2): This algorithm directly computes the distance between two dense point clouds (PCA and PCB) along the local surface normal, providing robust 3D change vectors. The signed distance \( d \) at a core point is given by:
$$ d = \vec{n} \cdot (\vec{C}_{2} – \vec{C}_{1}) $$
where \( \vec{C}_{1} \) and \( \vec{C}_{2} \) are the centroids of points within a cylinder around the core point in PCA and PCB, respectively, and \( \vec{n} \) is the local normal vector derived from PCA}. - Digital Elevation Model of Difference (DoD): A simpler but effective method involves subtracting a later-period DSM (\( DSM_{t2} \)) from an earlier one (\( DSM_{t1} \)):
$$ \Delta DSM = DSM_{t2} – DSM_{t1} $$
Positive values indicate deposition, while negative values indicate erosion or subsidence. This is highly effective for tracking volume changes in slide masses or erosion near tower foundations.
Risk Assessment and Mitigation Design: Measurements directly extracted from the UAV drones models—crack widths and lengths, scarp heights, slope angles, distances from hazards to infrastructure, and volumetric calculations of unstable mass—feed directly into stability analyses and the engineering design of mitigation measures (e.g., drainage ditches, retaining structures).
| Data Product | Description | Primary Application |
|---|---|---|
| Dense Point Cloud | Millions/Billions of georeferenced 3D points (XYZ). | High-accuracy 3D measurement, volumetric calculation, M3C2 change detection. |
| Textured 3D Mesh Model | Photorealistic, scalable 3D surface model. | Situational awareness platform, visual inspection, communication, qualitative hazard mapping. |
| Digital Orthophoto Map (DOM) | Geometrically corrected, seamless image mosaic. | Planimetric mapping, feature digitization, orthorectified base for GIS. |
| Digital Surface Model (DSM) | Raster representing elevation of the first surface (ground, vegetation, structures). | DoD analysis, line-of-sight studies, preliminary volume estimation. |
| Digital Terrain Model (DTM) | Raster representing bare-earth elevation (requires point cloud classification). | Slope stability modeling, hydrological analysis, accurate volumetric calculation of earthworks. |
3. Application Case Study: High-Risk Transmission Line Section in a Reservoir Area
The efficacy of this UAV drones-based framework was demonstrated on a critical 500 kV transmission line section in a mountainous reservoir region. Following intense rainfall, slope instability threatened several towers. A comprehensive multi-scale survey was immediately conducted.
Multi-Scale UAV Drones Operations:
A RTK-enabled multi-rotor UAV drone was deployed for three synchronized missions:
1. Macro-Regional: A 1.5 km² area was covered using nadir photogrammetry at 200m AGL, yielding a 5.4 cm GSD model of the entire slope system and two large, pre-existing landslides below the line.
2. Meso-Corridor: A 0.1 km² corridor along 1 km of the line was captured using oblique photogrammetry at 80m AGL, producing a 2.3 cm GSD model detailing the interaction between three specific towers and the slope.
3. Micro-Local: A tower (Tower A) with ground cracks at its base was subjected to a combined mission: oblique photography from above (60m AGL) and close-range orbiting/terrain-following flights (10-15m from surfaces). This resulted in a ultra-high-resolution (0.3-1.6 cm GSD) model of the tower foundation and the incipient failure.
Results and Integrated Analysis:
The fused multi-scale 3D model served as the central platform in a 3D GIS. Analysis led to:
– Identification: Four new, rainfall-triggered slope instabilities were identified and mapped along the corridor.
– Risk Prioritization: The failure at Tower A was classified as “Extremely High Risk” due to its proximity (cracks within meters of the foundation) and measured volume (~225 m³). Other instabilities were ranked as medium to low risk based on their distance from assets.
– Mitigation Support: Precise measurements from the UAV drones model directly informed the emergency design of surface drainage ditches and crack backfilling plans around Tower A.
– Deformation Monitoring: A follow-up UAV drones survey six months later allowed for a quantitative M3C2 analysis. The comparison between the two epochs of dense point clouds confirmed that the emergency stabilization measures had been effective, with no significant further deformation detected at the Tower A site or elsewhere along the monitored corridor.
4. Conclusion and Outlook
The integrated framework presented here demonstrates that UAV drones are not merely data collection tools but the core of a transformative approach to transmission line geological hazard management. By systematically employing UAV drones across multiple scales—from the landscape context down to the centimeter-level detail of a crack—and fusing this data into a unified digital twin, a comprehensive understanding of the hazard-infrastructure system is achieved. This work has shown that such a UAV drones-based methodology is not only technically feasible but operationally practical, providing rapid, repeatable, and rich datasets that directly support the entire risk management cycle: from rapid post-event assessment and hazard identification, through detailed analysis and monitoring, to the informed design of mitigation solutions.
The future of this field is promising. The integration of UAV drones-based LiDAR with photogrammetry will enhance data quality under vegetative cover. The development of automated, AI-driven feature extraction algorithms will accelerate the analysis of the vast datasets produced by UAV drones. Furthermore, embedding this multi-scale UAV drones data into predictive models and digital twin platforms will enable more proactive risk management and resilience planning for critical linear infrastructure networks worldwide. The role of UAV drones as indispensable assets in safeguarding power grids against geological threats is firmly established and will only continue to grow.