
The global transition towards sustainable energy has positioned solar power as a cornerstone technology. Ensuring the safe, reliable, and efficient operation of photovoltaic (PV) modules is therefore paramount. Traditional inspection methods, such as manual ground-based visual checks or thermographic surveys from fixed positions, suffer from significant limitations including low efficiency, restricted coverage, difficulty in detecting latent or early-stage faults, and potential safety hazards for personnel. The advent of unmanned aerial vehicle (UAV) technology has revolutionized inspection paradigms across industries. Applying UAV drone platforms to PV farm monitoring offers a transformative solution, promising unprecedented scalability, precision, and data comprehensiveness. This project proposes a novel intelligent inspection methodology by developing a system that leverages a UAV drone equipped with a dual-spectral imaging sensor. This system synchronously captures visible and near-infrared (NIR) / thermal imagery of PV modules. The fusion and analysis of these complementary data streams enable accurate, automated identification of a wide range of defects—from obvious hot spots and physical cracks to subtle cell mismatches, potential-induced degradation (PID), and soiling. The research outcomes provide a scientific foundation for proactive PV system fault diagnosis, significantly reducing operational and maintenance (O&M) costs, maximizing energy yield, and enhancing the overall economic and operational benefits of solar assets. Consequently, an in-depth study on the dual-spectral sensing technology for UAV drone-based photovoltaic inspection systems is both timely and critical.
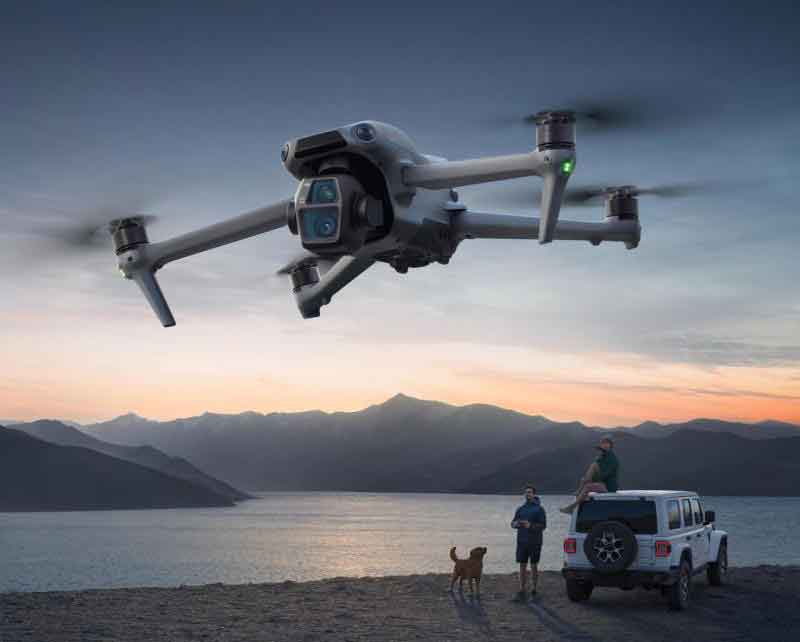
The integration of UAV drone platforms with advanced sensing payloads, as depicted, is central to modernizing industrial inspection workflows. This visual underscores the versatility and data-capture capability that a suitably equipped UAV drone brings to large-scale infrastructure monitoring, directly applicable to the vast expanses of a photovoltaic plant.
Fundamentals of Dual-Spectral Perception Technology
Theoretical Basis of Dual-Spectral Sensing
Dual-band or multi-spectral remote sensing fusion technology integrates information from disparate regions of the electromagnetic spectrum, typically the visible and infrared, providing a richer, more holistic perspective for target detection and identification. Each spectral band interacts with materials in distinct ways governed by fundamental physical laws.
The visible light spectrum (approximately 380 nm to 780 nm) provides high-resolution structural, textural, and color information. For PV modules, visible-light imagery is instrumental in identifying surface anomalies such as:
- Gross physical damage (cracked glass, frame deformation)
- Discoloration or browning of encapsulant or backsheets (often indicative of UV degradation or moisture ingress)
- Heavy soiling, bird droppings, or leaf accumulation
- Faults in bypass diodes visible via junction box inspection
Algorithms for edge detection, texture analysis, and color segmentation can precisely locate and quantify these features.
The infrared spectrum, particularly the short-wave infrared (SWIR, ~1-3 µm) and thermal infrared (TIR, ~8-14 µm) bands, reveals radiative properties related to temperature and material composition. For PV inspection, thermal imagery is crucial due to the direct link between electrical performance and heat generation. A defective cell or connection typically exhibits higher series resistance, causing localized Joule heating ($P_{heat} = I^2R$). According to Planck’s Law, the spectral radiance $L_{\lambda}$ of a blackbody at temperature $T$ is given by:
$$L_{\lambda}(T) = \frac{2hc^2}{\lambda^5} \cdot \frac{1}{e^{\frac{hc}{\lambda k_B T}} – 1}$$
where $h$ is Planck’s constant, $c$ is the speed of light, $\lambda$ is the wavelength, and $k_B$ is Boltzmann’s constant. While PV modules are not perfect blackbodies, their emissivity ($\epsilon$) modifies this relation ($L_{\lambda, observed} = \epsilon \cdot L_{\lambda}(T)$). The Stefan-Boltzmann Law further states that the total power radiated per unit area is proportional to the fourth power of its absolute temperature:
$$P = \epsilon \sigma T^4$$
where $\sigma$ is the Stefan-Boltzmann constant. Therefore, even small temperature differences ($\Delta T$) between a faulty “hot spot” and normal cells result in significant differences in infrared radiation, making them detectable. Thermal imaging excels at revealing:
- Hot spots from defective cells, cracked cells, or faulty solder bonds.
- Substring or module-level mismatch.
- Poor electrical connections (e.g., in junction boxes or combiner boxes).
- Diodes in conduction.
The limitation of single-spectral sensing is evident: visible light alone is insensitive to thermal anomalies, while thermal imaging lacks fine textural detail and cannot distinguish certain types of soiling from electrical faults. Dual-spectral perception overcomes these limitations by fusing complementary data. The theoretical underpinning lies in spectroscopy and the differential interaction of photons with matter—different defects manifest uniquely across spectral bands. By analyzing co-registered visible and thermal images, the system can, for instance, differentiate a hot spot caused by a physical crack (visible in both spectra) from one caused purely by an internal electrical fault (visible primarily in thermal).
| Spectral Band | Wavelength Range | Primary Information | Key Detectable PV Defects |
|---|---|---|---|
| Visible (RGB) | 380 – 780 nm | Reflectance, Color, Texture | Cracks, Soiling, Discoloration, Delamination, Physical Damage |
| Near-Infrared (NIR) | 780 – 1400 nm | Reflectance, Material Composition | Moisture ingress, Certain coating defects |
| Thermal Infrared (TIR) | 8000 – 14000 nm | Thermal Radiation, Temperature | Hot Spots, Mismatch, Faulty Connections, Diode Operation |
Core Technologies for Dual-Spectral Image Acquisition
The selection and integration of the dual-spectral camera payload are critical for the UAV drone system’s effectiveness. Key performance parameters must be balanced against the constraints of the UAV drone platform (weight, power, data bandwidth).
| Parameter | Description | Impact on Inspection | Typical Consideration for UAV |
|---|---|---|---|
| Resolution (Spatial) | Number of pixels (e.g., 640×512 for thermal, 12MP for visible). | Determines the smallest detectable defect (Ground Sample Distance – GSD). Higher resolution reveals micro-cracks but increases data volume. | Balance between GSD requirement and data storage/transmission limits. A GSD of 1-3 cm/pixel is often targeted for module-level defects. |
| Sensitivity (NETD for Thermal) | Noise Equivalent Temperature Difference; minimum detectable temperature difference. | Lower NETD (<50 mK) allows detection of subtle thermal anomalies indicative of early-stage faults. | High sensitivity is crucial for reliable hot spot detection under varying ambient conditions. |
| Spectral Response & Alignment | Precise spectral bands captured and the pixel-to-pixel alignment between visible and thermal sensors. | Ensures data from both spectra corresponds to the exact same physical spot on the PV module, enabling accurate pixel-level fusion and analysis. | Integrated dual-sensor cameras or rigorously calibrated separate sensors with boresight alignment are essential. |
| Frame Rate & Integration Time | Speed of image capture and exposure duration. | High frame rates and adjustable integration times prevent motion blur during UAV drone flight and allow optimization for different lighting/thermal conditions. | Must sync with UAV drone ground speed to ensure sufficient image overlap for mosaicking. |
| Radiometric Calibration | Ability to convert sensor digital numbers to absolute temperature values (for thermal) or reflectance. | Enables quantitative analysis, trend monitoring over time, and setting fixed temperature thresholds for alarm generation. | A radiometric thermal camera is mandatory for serious diagnostic work, not just qualitative “hot/cold” imaging. |
Image preprocessing is a vital step before defect analysis. For thermal images, common corrections include:
- Non-Uniformity Correction (NUC): Compensates for pixel-to-pixel sensitivity variations.
- Atmospheric Transmission Correction: Accounts for atmospheric absorption between the UAV drone and the target, especially over long distances or in humid conditions. Simplified using empirical models.
- Reflection Compensation: Accounts for reflected radiation from the sky, sun, or surrounding objects, which can distort apparent target temperature.
For visible images, preprocessing may involve:
- Lens Distortion Correction: Removes geometric aberrations.
- Radiometric Calibration (to reflectance): If using a multispectral sensor for quantitative analysis.
- Image Enhancement: Techniques like histogram equalization or contrast stretching to improve defect visibility.
Image fusion algorithms then combine the preprocessed data. A common approach is pixel-level fusion, where corresponding pixels from both images are combined using methods like Principal Component Analysis (PCA) or wavelet transforms to create a single, information-rich image for visualization or further processing.
Theory and Technology for PV Defect Recognition Based on Dual-Spectral Data
The fusion of dual-spectral data creates a powerful feature space for automated defect classification. Different failure modes exhibit characteristic signatures across the electromagnetic spectrum.
1. Hot Spot due to Cracked Cell:
- Visible Signature: A visible crack line disrupting the uniform texture of the cell. Edge detection algorithms (e.g., Canny, Sobel) can extract this feature. The gradient magnitude $G$ is computed from the image intensity $I(x,y)$: $$G = \sqrt{G_x^2 + G_y^2}$$ where $G_x$ and $G_y$ are gradients in the x and y directions.
- Thermal Signature: A localized high-temperature region aligning precisely with the visible crack due to increased series resistance. The temperature delta $\Delta T_{crack}$ relative to neighboring healthy cells is the key feature.
- Fused Diagnosis: The spatial coincidence of a high-gradient edge feature (from visible) and a local temperature maximum (from thermal) provides a high-confidence diagnosis of a crack-induced hot spot.
2. Soiling vs. Electrical Fault:
- Scenario: A dark patch on a thermal image.
- Visible-Only Analysis: Inconclusive—could be shade, soiling, or a fault.
- Thermal-Only Analysis: Inconclusive—soiled cells may run cooler (less light absorption) or warmer (reduced heat conduction), depending on conditions.
- Dual-Spectral Analysis: Soiling is clearly visible in the RGB image as a discolored or shaded area. An electrical fault (e.g., inactive substring) may have no distinct visible signature but shows a sharp thermal boundary. This allows clear discrimination.
3. Bypass Diode Activation:
- Visible Signature: Typically none at the module level.
- Thermal Signature: A distinct “chevron” or “reverse L” pattern of warm cells, as the activated diode shunts current around a group of shaded or faulty cells, causing them to heat up.
- Fused Diagnosis: The geometric thermal pattern is unique and easily algorithmically identified once the module layout (number of cells per diode) is known.
Machine Learning (ML) and Deep Learning (DL) are the primary technologies for automating this classification. A supervised learning approach is used:
- Data Collection & Labeling: Thousands of dual-spectral image patches (or fused representations) are collected by the UAV drone and manually labeled with defect classes (e.g., “healthy,” “crack,” “hot spot,” “soiling,” “diode-on”).
- Model Training: A Convolutional Neural Network (CNN) is particularly effective. Its architecture is inspired by the visual cortex and is defined by:
- Convolutional Layers: Apply learnable filters (kernels) to extract hierarchical features (edges→textures→object parts). The operation for a single filter is: $$(I * K)_{ij} = \sum_{m} \sum_{n} I_{i+m, j+n} K_{m,n}$$ where $I$ is the input image, $K$ is the kernel, and $*$ denotes convolution.
- Activation Functions (e.g., ReLU): Introduce non-linearity: $f(x) = max(0, x)$.
- Pooling Layers: Perform down-sampling (e.g., max-pooling) to reduce spatial dimensions and achieve translational invariance.
- Fully Connected Layers: Combine extracted features for final classification into defect categories using a softmax function: $$\sigma(\mathbf{z})_i = \frac{e^{z_i}}{\sum_{j=1}^{K} e^{z_j}}$$
- Inference: The trained model processes new, unseen dual-spectral data from the UAV drone and outputs a defect classification and location for each module or sub-module region.
This DL-based approach, powered by the rich feature set from dual-spectral data, significantly outperforms traditional threshold-based methods in accuracy and robustness, especially for complex or subtle defects.
UAV Platform Adaptation and Design
UAV Drone Selection Criteria and Key Performance Indicators
Choosing the optimal UAV drone platform is a fundamental system design decision, requiring a trade-off between various performance metrics tailored to the specific PV plant’s characteristics.
| UAV Type | Key Advantages | Key Limitations | Primary PV Inspection Use Case | Critical KPIs for Selection |
|---|---|---|---|---|
| Multi-Rotor (Quadcopter, Hexacopter, Octocopter) | Vertical Take-Off and Landing (VTOL), exceptional maneuverability and stability, ability to hover for detailed inspection of specific points. | Limited flight endurance (typically 20-45 minutes), lower speed, higher power consumption per unit distance covered. | Ideal for small-to-medium plants, complex roof-top installations, detailed post-repair inspection, and sites with many obstacles. Excellent for mapping. | 1. Endurance with Payload 2. Paylift Capacity (≥ camera weight + margin) 3. Wind Resistance (>10 m/s) 4. GPS/RTK Positioning Accuracy |
| Fixed-Wing | Superior flight efficiency and endurance (2-6 hours), high cruising speed, large area coverage per flight. | Requires runway or launcher for take-off and landing, cannot hover, less maneuverable in tight spaces, more complex operation. | Optimal for massive, utility-scale PV plants in open, flat terrain where maximum area coverage per flight is the priority. | 1. Flight Endurance/Distance 2. Cruise Speed 3. Payload Bay Size/Weight Limit 4. Required Launch/Recovery Area |
| VTOL Fixed-Wing / Hybrid | Combines VTOL convenience of multi-rotors with the efficient forward flight of fixed-wings. Good compromise. | More complex mechanically and in control logic, often higher cost, endurance between pure multi-rotor and fixed-wing. | Versatile solution for medium-to-large plants with some terrain variation or where no runway is available but large area needs coverage. | 1. Transition Reliability 2. Endurance in Cruise Mode 3. Hovering Time (if needed) 4. Overall System Complexity/Cost |
The selection is guided by mission requirements. The total area $A_{total}$ of the PV plant and the desired Ground Sample Distance (GSD) determine the number of images needed. The GSD (in meters per pixel) is calculated based on the sensor width $W_{sen}$ (m), focal length $f$ (m), and flight altitude $H$ (m):
$$GSD = \frac{H \cdot W_{sen}}{f \cdot N_{pix}}$$
where $N_{pix}$ is the number of pixels across the sensor width. The UAV drone must be capable of completing the mission within its energy budget while maintaining the required image overlap (e.g., 80% frontlap, 70% sidelap for photogrammetry).
Adaptation Design for Mounting Dual-Spectral Sensing Equipment
Integrating the dual-spectral camera onto the UAV drone involves more than simple attachment; it requires holistic design consideration.
1. Payload Integration and Gimbal System:
The camera must be mounted on a stabilized, multi-axis gimbal. This is critical to compensate for the UAV drone‘s attitude variations (pitch, roll, yaw) during flight, ensuring nadir-looking or consistently angled imagery necessary for creating accurate orthomosaics. The gimbal’s stabilization performance, often measured in degrees of residual vibration, directly impacts image clarity. The mounting position must maintain the UAV drone‘s center of gravity within safe limits to ensure stable flight dynamics.
2. Power System Optimization:
The dual-spectral camera, gimbal, and associated avionics consume significant power. The UAV drone‘s battery capacity $C_{batt}$ (in mAh) and voltage $V$ must be derated to account for this additional load. The available flight time $T_{flight}$ can be estimated as:
$$T_{flight} \approx \frac{C_{batt} \cdot \eta}{I_{total}}$$
where $\eta$ is the battery discharge efficiency factor (often ~0.8-0.9), and $I_{total}$ is the total current draw of the UAV drone propulsion system $I_{prop}$ plus the payload system $I_{payload}$. Selecting a UAV drone with sufficient power headroom or upgrading its power system is often necessary.
3. Data Link and Communication:
High-resolution dual-spectral imagery generates vast amounts of data (e.g., hundreds of MBs to GBs per flight). While primary storage is typically on-board an SD card, a robust downlink for real-time telemetry and, if possible, a low-latency video feed is essential for mission monitoring. Radio links (e.g., 2.4 GHz, 5.8 GHz) must have sufficient range and resistance to interference in an industrial environment. For Beyond Visual Line of Sight (BVLOS) operations, more advanced LTE or satellite-based communication links may be integrated.
4. Environmental Hardening:
The UAV drone system must operate reliably in typical PV plant conditions: high temperatures, dust, and sometimes strong winds. Components should be rated for appropriate operating temperatures, and filters may be needed for cooling vents to prevent dust ingress.
System Architecture of the UAV Drone-Based Dual-Spectral Inspection System
Overall System Architecture Planning
The proposed system follows a layered, integrated architecture comprising three main segments: the Air Segment, the Ground Control Segment, and the Data Processing & Analytics Segment. Data flows bi-directionally between these segments to form a closed-loop inspection workflow.
| System Segment | Key Components | Primary Functions |
|---|---|---|
| Air Segment (The UAV drone Platform) | 1. UAV Airframe (Multi-rotor/Fixed-wing) 2. Flight Controller & Avionics (GPS, IMU, Compass) 3. Dual-Spectral Imaging Payload & Gimbal 4. On-board Data Storage 5. Data/Telemetry Transmitter |
1. Autonomous navigation along pre-planned flight paths. 2. Stable image acquisition under gimbal control. 3. Capture and temporary storage of geo-tagged visible/thermal image pairs. 4. Transmission of real-time status and low-res video to ground. |
| Ground Control Segment | 1. Ground Control Station (GCS) Hardware (Laptop/Tablet) 2. Mission Planning Software 3. Radio Link Transceiver 4. Remote Controller (Optional, for manual override) |
1. Mission planning (defining area, altitude, overlap, camera settings). 2. Real-time monitoring of UAV drone status (location, battery, alerts). 3. Command and control of the UAV drone and payload. 4. Initiation of automated data upload post-landing. |
| Data Processing & Analytics Segment | 1. Data Ingestion Server 2. Preprocessing & Stitching Module 3. Defect Detection AI Engine (Trained CNN Models) 4. Database (Spatial & Asset Data) 5. Reporting & Visualization Dashboard |
1. Automated ingestion and organization of flight data. 2. Image preprocessing, georeferencing, and mosaic generation. 3. Automated defect detection, classification, and localization. 4. Storage of all historical inspection data and results. 5. Generation of interactive reports, heat maps, and work orders. |
The workflow is as follows: (1) A mission is planned in the GCS software and uploaded to the UAV drone. (2) The UAV drone executes the autonomous flight, capturing synchronized data. (3) After landing, high-resolution image data is transferred to the processing server. (4) The analytics pipeline processes the data, applying the dual-spectral fusion and AI models. (5) Results are pushed to a web-based dashboard where plant managers can review defects, prioritized by severity, and generate maintenance tickets.
Functional Construction of the Data Processing Center
The data processing center is the brain of the system, transforming raw imagery into actionable intelligence.
1. Data Management Pipeline:
This involves automated sorting, compression, and storage of incoming dual-spectral data. A relational database (e.g., PostgreSQL with PostGIS extension) or a time-series database manages metadata: flight ID, timestamp, GPS coordinates, sensor parameters, and links to the actual image files stored in a scalable filesystem or cloud storage (e.g., AWS S3). Efficient compression codecs (like JPEG2000 for visible, compressed formats for thermal) are used to minimize storage footprint without losing analytical fidelity.
2. Core Analytics Engine:
This is where the core intellectual property resides. The engine executes a multi-stage algorithm:
- Stage 1: Image Alignment & Fusion: Precisely co-registers the visible and thermal images using feature matching or sensor calibration data, then applies a fusion algorithm (e.g., wavelet transform) to create a combined data layer.
- Stage 2: Module Segmentation: Isolates individual PV modules within the stitched orthomosaic. This can be done using template matching, edge detection, or a trained CNN that recognizes module boundaries and racking structures.
- Stage 3: Defect Detection & Classification: The dual-spectral data patch for each segmented module is fed into the trained deep learning model (e.g., a ResNet or YOLO architecture adapted for two input channels). The model outputs probabilities for each defect class. A confidence threshold (e.g., 0.9) is applied to filter out false positives.
- Stage 4: Quantification & Localization: For thermal defects, the absolute temperature is read from the radiometric data. The geographic coordinates of the defect are calculated from the image geotags and the defect’s pixel location within the module.
3. Reporting, Visualization, and Predictive Analytics:
The final step translates algorithmic outputs into business value.
- Interactive Dashboards: Web-GIS interfaces overlay defect heatmaps on plant layouts. Users can click on a hot spot to see the visible/thermal image pair, temperature readings, defect type, and confidence level.
- Automated Report Generation: Standardized reports are generated per flight or per asset, summarizing: total modules inspected, number and types of defects found, a severity assessment, and recommended actions. A sample metric is the Plant Health Index (PHI), which could be defined as:
$$PHI = \left(1 – \frac{N_{defective}}{N_{total}}\right) \times 100\%$$ - Trend Analysis & Predictive Maintenance: By storing all historical results in the database, the system can track the evolution of specific defects over time (e.g., is a hot spot growing warmer?). Statistical and ML models can be applied to predict future failure rates or identify modules entering a pre-failure state, enabling truly predictive maintenance strategies.
System Performance Testing and Practical Application Case Analysis
Design of System Performance Testing Protocol
Rigorous testing is essential to validate the system’s performance under real-world conditions. A comprehensive test protocol should evaluate key subsystems and their integration.
| Test Category | Objective | Test Method | Metrics & Equipment |
|---|---|---|---|
| Defect Detection Accuracy | Measure the system’s ability to correctly identify and classify known defects. | Fly the UAV drone over a test array containing PV modules with pre-installed and documented defects (cracks, shaded cells, disconnected substrings, simulated soiling). Compare AI results with ground truth. | Precision, Recall, F1-Score, Overall Accuracy. Equipment: Test PV array with known defects. |
| Geolocation Accuracy | Assess the precision with which defects can be located on a plant map. | Place physical markers at known GPS coordinates within the test field. After flight and processing, measure the difference between the system-reported location of the marker (in imagery) and its true location. | Mean Radial Spherical Error (MRSE) in meters. Equipment: High-precision GPS rover (RTK/PPK). |
| Operational Robustness | Evaluate system performance under varying environmental conditions. | Conduct flights at different times of day (morning, noon, afternoon), under varying irradiance levels, and in different weather conditions (calm, moderate wind). | Consistency of defect detection rates, image quality metrics (sharpness, noise), and flight stability. Equipment: Weather station, irradiance sensor. |
| Data Link & Communication Stability | Test the reliability of telemetry and control signals. | Perform flights at increasing distances from the GCS, potentially with obstacles. Monitor link quality indicators. | Packet loss rate, latency, maximum operational range before signal degradation. Equipment: Signal strength monitors. |
| End-to-End System Efficiency | Measure the total time from mission start to report generation for a given area. | Time each phase: mission planning, flight time, data transfer, processing time, report generation for a standard 1 MW block. | Total inspection time per MW, processing time per image. Equipment: System logs and timestamps. |
Analysis of Test Results and Practical Application Insights
Hypothetical test results would likely reveal strengths and areas for improvement, guiding system refinement.
Typical Performance Findings:
- High Accuracy for Clear Defects: The system achieves F1-scores >0.95 for prominent hot spots and major cracks under ideal mid-day, clear-sky conditions.
- Challenges with Subtle Defects: Early-stage micro-cracks or low-temperature differential hot spots (<2°C) may have lower recall, indicating a need for more training data on these specific anomalies or sensor sensitivity improvements.
- Environmental Sensitivity: Performance may degrade during early morning or late afternoon due to low irradiance (weak thermal signal) or when modules are heated uniformly (reduced thermal contrast). Wind can cause image blur, reducing visible-light crack detection accuracy.
- Data Processing Bottleneck: The AI inference step might be the slowest part of the pipeline, especially on large plants. This highlights the need for optimized models or GPU-accelerated processing servers.
Case Study Analysis: Imagine deploying the system on a 50 MW utility-scale plant.
- Pre-Deployment: A detailed digital twin of the plant (layout, module types, inverter groupings) is loaded into the system database.
- Mission Execution: Using a VTOL fixed-wing UAV drone, the entire plant is inspected in 8 flights over two days, with each flight covering ~6.25 MW.
- Results: The system processes 50,000+ module images and identifies 342 anomalies: 215 hot spots (various severity), 87 cracked cells, 25 areas of heavy soiling, and 15 suspected diode activations.
- Actionable Insight: The dashboard reveals that 70% of the hot spots are concentrated in two specific inverter strings installed in a particular batch. This points to a potential manufacturing flaw or installation damage specific to that batch, enabling targeted investigation and warranty claims.
- Value Realization: The inspection, which would have taken a ground crew weeks, was completed in days. The early detection of faults prevents further power loss and potential safety hazards. The data-driven prioritization of repairs optimizes the O&M team’s workflow.
Continuous Improvement Loop: The findings from both controlled tests and field applications feed back into the system development:
- Algorithm Retraining: Newly discovered and validated defect examples from the field are added to the training dataset, continuously improving the AI model’s accuracy and generalizability.
- Operational Protocols: Best practices are established, such as optimal flight times (e.g., post-sunrise for best thermal contrast) or specific camera settings for different module technologies (thin-film vs. crystalline silicon).
- Hardware Updates: If certain limitations are consistently traced to sensor performance (e.g., insufficient thermal resolution), it justifies investment in a next-generation camera payload for the UAV drone fleet.
In conclusion, this project successfully designs and articulates a comprehensive framework for a dual-spectral UAV drone-based photovoltaic inspection system. By synergistically integrating advanced multi-spectral sensing theory, adaptive UAV drone platform engineering, robust system architecture, and state-of-the-art AI analytics, the system provides a powerful tool for the solar industry. It transforms O&M from a reactive, labor-intensive cost center into a proactive, data-driven value-creation activity. While real-world implementation will reveal specific challenges—sensor calibration drift, complex defect edge cases, regulatory compliance for BVLOS—the proposed system offers a clear, scientifically-grounded pathway towards higher PV plant reliability, efficiency, and profitability. The continuous feedback loop between field data and system refinement ensures its long-term relevance and effectiveness in supporting the global clean energy transition.