
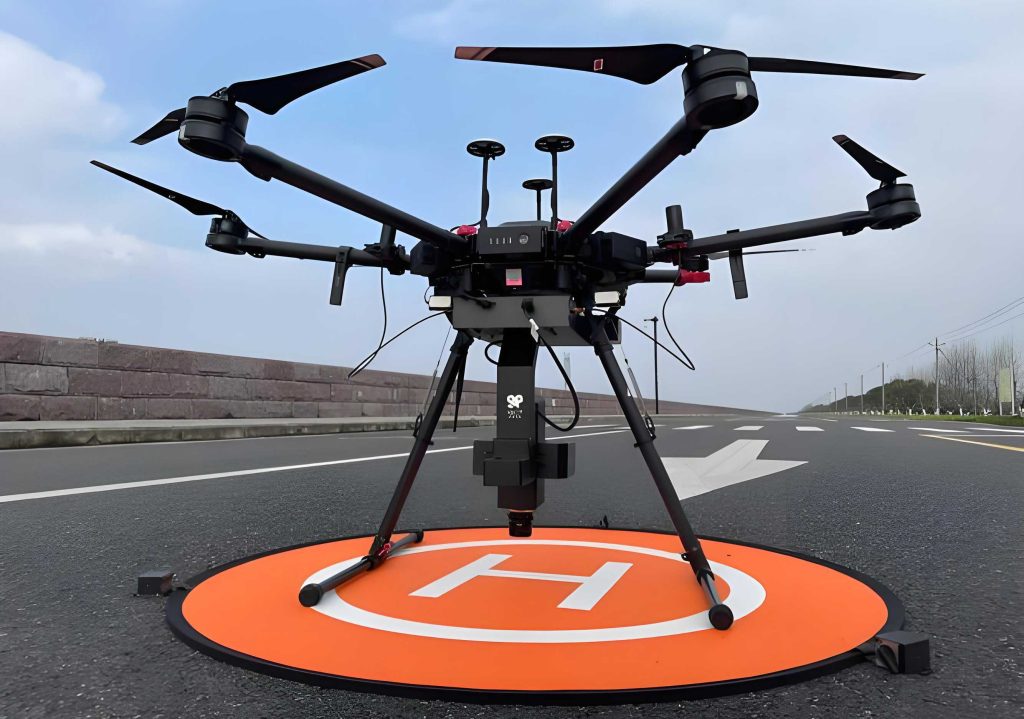
The proliferation of Unmanned Aerial Vehicles (UAVs), commonly known as drones, presents significant and novel challenges to aviation safety and airspace security. Due to their low cost, small size, and ease of operation, UAV drones have found widespread application. However, their uncontrolled proliferation, especially in low-altitude airspace near critical infrastructures like airports, poses a substantial risk. Incidents of drones intruding into controlled airspace are increasingly frequent, creating an urgent operational need for their rapid and reliable identification to formulate appropriate countermeasures.
A critical challenge in this domain is that UAV drones share the “Low, Slow, and Small” (LSS) target signature with biological targets, primarily birds. Traditional radar systems often depict such LSS targets as tracks composed of sequential plot points containing positional and kinematic information. While both categories fall under LSS, their underlying motion principles differ fundamentally, leading to discernible variations in their trajectory patterns. UAV drones, particularly multi-rotor types, generate lift and thrust through precisely controlled rotating propellers. Their flight paths, often guided by autopilots or manual control for specific tasks, tend to be more stable and predictable. In contrast, birds rely on the biomechanical flapping of wings, interacting with dynamic air currents, resulting in trajectories that are inherently more variable and less smooth.
Current methods for classifying UAV drones and birds frequently employ machine learning or deep learning models, such as Support Vector Machines (SVM), Random Forests, or neural networks. While these approaches can achieve reasonable accuracy, they predominantly suffer from a “black box” problem. The internal decision-making process of these models is opaque, making it difficult to understand which specific features drive a classification decision. This lack of interpretability is a significant drawback in safety-critical applications where understanding the “why” behind a classification is as important as the classification itself. Furthermore, existing feature extraction methods often focus solely on macro-scale kinematic features describing an entire track segment, potentially overlooking important micro-scale variations between consecutive plot points that could be key discriminators.
Therefore, the core challenge addressed here is twofold: first, to construct a comprehensive and physically meaningful feature set that captures both the overarching motion trends and the instantaneous kinematic fluctuations characteristic of UAV drone versus bird flight; and second, to build a high-performance classification model whose decisions are transparent and explainable. This article proposes a solution by extracting a novel hierarchy of motion features from passive radar track data, employing an optimized Light Gradient Boosting Machine (LightGBM) for classification, and integrating the Shapley Additive Explanations (SHAP) framework to provide clear, quantitative insights into the model’s decision logic.
Passive Radar Track Data Processing
Passive radar, also known as passive coherent location (PCL) or illuminator of opportunity radar, is a promising sensing modality for LSS target surveillance. Its fundamental advantage lies in not emitting any electromagnetic signals itself. Instead, it leverages existing ambient transmissions—such as FM radio, digital video/audio broadcast (DVB-T), or cellular signals—as non-cooperative illuminators to detect and track targets. This operational paradigm grants it excellent covertness, low power consumption, superior electromagnetic compatibility (EMC), and crucially, a minimal footprint on the aviation electromagnetic environment, making it particularly suitable for deployment in sensitive areas like airport vicinities.
The experimental data utilized in this work is derived from a passive radar LSS target detection dataset. The track (TR) data package containing plot sequences for various targets was used. Specifically, data for bird and UAV drone targets were extracted, totaling 25,209 plots. Each data plot contains a rich set of parameters including: batch ID, target longitude and latitude, target altitude (reserved field), slant range, azimuth, elevation (reserved field), horizontal speed, vertical speed, heading, as well as echo power, signal-to-noise ratio (SNR), and phase.
A primary issue with the raw dataset was a significant class imbalance. Preliminary sorting yielded 4,739 bird plots and 20,470 UAV drone plots. A model trained on such imbalanced data would inherently be biased toward the majority class (UAV drone), likely leading to poor recall for the minority class (bird). To mitigate this, the Synthetic Minority Over-sampling Technique (SMOTE) was applied. SMOTE is a data augmentation method that generates synthetic samples for the minority class by interpolating between existing instances in feature space. This technique effectively increased the number of bird track samples without creating unrealistic or out-of-distribution data points, thereby balancing the dataset for robust model training.
Radar Track Motion Feature Extraction
The divergence in the flight mechanics between a UAV drone and a bird is the physical foundation for their discriminative kinematic signatures. A multi-rotor UAV drone achieves stable flight through high-speed rotation of its propellers, controlled by flight management systems to maintain specific attitudes and execute pre-planned or manually input maneuvers. This typically results in smooth trajectories with gradual changes. Conversely, a bird’s flight is powered by rhythmic wing flapping, a process susceptible to internal biological rhythms and external atmospheric disturbances (gusts, thermals), leading to more erratic and less predictable motion patterns.
To fully encapsulate these behavioral differences, we propose a two-tiered feature extraction framework that decomposes motion characteristics into Macro-features and Micro-features.
Macro-Features describe the global statistical properties of a track segment over a meaningful time window. They reflect the overall motion trend and consistency.
- Mean Velocity ($V_{mean}$): The average speed over the track segment. While both UAV drones and birds can operate in similar speed regimes, this serves as a fundamental kinematic descriptor.
$$ V_{mean} = \frac{1}{n}\sum_{i=1}^{n} v_i $$
where $v_i$ is the instantaneous speed at plot $i$, and $n$ is the number of plots in the segment. - Velocity Uniformity / Standard Deviation ($V_{std}$): Measures the fluctuation of speed throughout the track. Birds, due to flapping and environmental interaction, often exhibit higher speed variability compared to the typically steadier cruise of a UAV drone.
$$ V_{std} = \sqrt{\frac{1}{n-1}\sum_{i=1}^{n} (v_i – \bar{v})^2 } $$ - Acceleration Uniformity ($a_{std}$): The standard deviation of acceleration over the segment. This quantifies the intensity and frequency of speed changes. Erratic flapping and maneuvering in birds can lead to higher $a_{std}$, whereas a UAV drone’s controlled flight often results in lower, more consistent values.
$$ a_{std} = \sqrt{\frac{1}{n-1}\sum_{i=1}^{n} (a_i – \bar{a})^2 } $$ - Stationary Period Indicator: A binary feature indicating whether the target’s speed falls below a very low threshold (e.g., 0.1 m/s), suggesting hovering or perching. Multi-rotor UAV drones can actively and stably hover, while birds may appear stationary only when perched or riding strong winds.
- Cumulative Trajectory Distance ($D_{cld}$): The total path length traveled from the start of the track segment. This can indicate mission-oriented, long-distance travel (more likely for UAV drone) versus localized, foraging flight (more likely for bird).
$$ D_{cld} = \sum_{i=1}^{n} v_i \cdot \Delta t $$
Micro-Features capture the instantaneous or short-term dynamics between consecutive plot points. They are sensitive to rapid maneuvers and transient behaviors that macro-features might average out.
- Turning Rate ($\phi$): The rate of change of heading between consecutive plots. Birds making quick, sharp turns for navigation or prey capture will exhibit higher instantaneous turning rates.
$$ \phi_t = \frac{|h_t – h_{t-1}|}{\Delta t} $$
where $h_t$ is the heading at time $t$. - Instantaneous Acceleration ($a_t$): The change in speed between two plots.
$$ a_t = \frac{v_t – v_{t-1}}{\Delta t} $$ - Jerk ($j_t$): The rate of change of acceleration, describing the “smoothness” of motion. The impulsive nature of wing flapping can induce higher jerk values in birds compared to the smoother motor control of a UAV drone.
$$ j_t = \frac{a_t – a_{t-1}}{\Delta t} $$ - Curvature ($\omega_{cur}$): The rate of heading change per unit distance traveled, describing how “tight” a turn is. Birds often follow more winding paths with higher curvature.
$$ \omega_{cur} = \frac{\phi_t}{v_t} $$ - Angular Acceleration ($\alpha_t$): The rate of change of the turning rate, indicating how abruptly a turn is initiated or concluded.
$$ \alpha_t = \frac{\phi_t – \phi_{t-1}}{\Delta t} $$
The complete set of motion features considered is summarized in the table below.
| # | Feature Name | Description | Type |
|---|---|---|---|
| 1 | Velocity ($V_{mean}$) | Average speed over the track segment. | Macro |
| 2 | Velocity Std ($V_{std}$) | Standard deviation of speed, indicating speed uniformity. | Macro |
| 3 | Acceleration Std ($a_{std}$) | Standard deviation of acceleration, indicating maneuver intensity. | Macro |
| 4 | Position (Lat, Lon) | Geographic coordinates (can be transformed). | Context |
| 5 | Stationary Period | Binary indicator of hovering/stationary behavior. | Macro |
| 6 | Cumulative Distance | Total distance traveled from segment start. | Macro |
| 7 | Turning Rate ($\phi$) | Instantaneous rate of heading change. | Micro |
| 8 | Acceleration ($a_t$) | Instantaneous linear acceleration. | Micro |
| 9 | Jerk ($j_t$) | Rate of change of acceleration. | Micro |
| 10 | Curvature ($\omega_{cur}$) | Turning rate normalized by speed. | Micro |
| 11 | Angular Acceleration ($\alpha_t$) | Rate of change of turning rate. | Micro |
The SHAP-LightGBM Explainable Classification Model
The constructed feature vector, comprising both macro and micro features, represents a mixed-type, potentially high-dimensional input. The Light Gradient Boosting Machine (LightGBM) algorithm is chosen as the base classifier due to its high efficiency, accuracy, and native handling of diverse data types. LightGBM is a gradient boosting framework that uses a tree-based learning algorithm. Its key innovations include a histogram-based approach for splitting, which speeds up training, and a leaf-wise tree growth strategy that often achieves higher accuracy compared to traditional level-wise growth.
However, a standalone LightGBM model remains a “black box.” To address this, we integrate the SHAP (SHapley Additive exPlanations) framework. SHAP is a unified approach rooted in cooperative game theory that assigns each feature an importance value (Shapley value) for a specific prediction. The explanation model, $g$, is defined as a linear function of binary variables:
$$ g(z’) = \phi_0 + \sum_{j=1}^{M} \phi_j z’_j $$
where $z’ \in \{0,1\}^M$, $M$ is the number of input features, $\phi_j \in \mathbb{R}$ is the Shapley value for feature $j$, and $\phi_0$ is the model’s baseline output (average prediction). SHAP values satisfy desirable properties like local accuracy (the sum of feature contributions equals the model output) and consistency.
Furthermore, the performance of LightGBM is sensitive to its hyperparameters (e.g., number of leaves, learning rate, tree depth). Manual tuning is inefficient. We employ the Tree-structured Parzen Estimator (TPE) algorithm for Bayesian optimization of these hyperparameters. TPE models the distribution $p(x|y)$ of hyperparameters $x$ given the performance metric $y$, focusing the search on regions of the parameter space most likely to yield superior performance, thus finding an optimal configuration more efficiently than grid or random search.
The overall framework of the proposed explainable classification system is as follows: Raw passive radar tracks are preprocessed (including SMOTE balancing). Hierarchical motion features (macro and micro) are extracted to form the feature vector. The LightGBM model, with its parameters optimized by TPE, is trained on this data. For any prediction (UAV drone or bird), the SHAP explainer calculates the contribution of each individual feature to that specific prediction, providing a clear, quantitative interpretation of the model’s decision. This pipeline effectively transforms the “black box” into a “glass box.”
Feature Importance Analysis via SHAP
Applying SHAP to the trained model provides global interpretability. The mean absolute SHAP value across all samples ranks features by their overall importance to the model’s predictions. An analysis revealed that the top seven most influential features for distinguishing UAV drones from birds included both macro-features (e.g., $V_{std}$, $a_{std}$, Stationary Period) and key micro-features (e.g., derivatives related to heading change). This validates the necessity of the two-tiered feature design. A SHAP summary plot visually depicts how the value of each feature (color) affects the model output (horizontal position), showing, for instance, that high $V_{std}$ or high instantaneous jerk values push the prediction toward the “bird” class, while the presence of a “stationary period” strongly suggests a UAV drone capable of hovering.
Experimental Validation and Analysis
The proposed methodology was validated on the passive radar LSS dataset. A subset of 1,018 track segments from both UAV drone and bird classes was used, split 80:20 into training and test sets. The LightGBM model was optimized using the TPE algorithm. For comparison, the same model was also tuned using standard Grid Search and Random Search methods.
The performance metrics—Accuracy, Recall (for the bird class, as the critical minority), and F1-Score—demonstrate the effectiveness of the proposed approach. The TPE-optimized SHAP-LightGBM model achieved superior results.
| Search Method | Accuracy | Recall | F1-Score |
|---|---|---|---|
| TPE Optimization | 0.92 | 0.95 | 0.93 |
| Grid Search | 0.85 | 0.84 | 0.85 |
| Random Search | 0.80 | 0.82 | 0.81 |
The TPE algorithm’s ability to efficiently navigate the high-dimensional hyperparameter space directly translated into a more accurate and robust classifier for the UAV drone recognition task.
A comparative analysis was conducted against other prominent machine learning algorithms: Support Vector Machine (SVM), Random Forest (RF), and eXtreme Gradient Boosting (XGBoost). Each was configured and trained on the same feature set and data splits.
| Algorithm | Accuracy | Recall | F1-Score |
|---|---|---|---|
| Proposed (SHAP-LightGBM+TPE) | 0.92 | 0.95 | 0.93 |
| Random Forest | 0.90 | 0.94 | 0.92 |
| XGBoost | 0.89 | 0.93 | 0.93 |
| SVM | 0.84 | 0.80 | 0.72 |
The proposed model achieved the highest accuracy and recall. The superior recall is particularly important, indicating a lower miss rate for bird targets, which is crucial to avoid false alarms triggering unnecessary counter-UAV drone measures. The significantly lower F1-score for SVM highlights its weakness in handling the complex, non-linear decision boundary and potential class imbalance in this feature space. The strong performance of tree-ensemble methods (RF, XGBoost, LightGBM) confirms the suitability of this family of algorithms for the kinematic feature-based classification of UAV drone tracks. Our model’s edge comes from the efficient LightGBM implementation coupled with advanced Bayesian hyperparameter tuning via TPE.
Conclusion
This work has presented a comprehensive and explainable framework for distinguishing UAV drones from birds using passive radar track data. By moving beyond the “black box” paradigm, the method provides actionable intelligence not just on *what* the target is classified as, but *why*. The core innovation lies in the hierarchical decomposition of motion into macro-scale statistical trends and micro-scale instantaneous dynamics, creating a rich and physically interpretable feature set that captures the fundamental kinematic differences between a mechanically controlled UAV drone and a biologically powered bird.
The integration of the LightGBM classifier, optimized via the Tree-structured Parzen Estimator, ensured high predictive performance. The subsequent application of the SHAP explainability framework transformed the model’s output into transparent decision reports, quantifying the contribution of features like speed uniformity, acceleration stability, and jerk. This transparency is vital for building operator trust and for refining the system based on concrete feature performance. Experimental results on a real passive radar dataset demonstrated an accuracy of 92%, outperforming other standard machine learning algorithms and validating the efficacy of the proposed approach. Future work will focus on incorporating additional data modalities (e.g., micro-Doppler signatures from the raw radar signal) into this explainable hybrid framework and testing the system in more diverse and cluttered operational environments to further enhance the reliability of UAV drone surveillance.