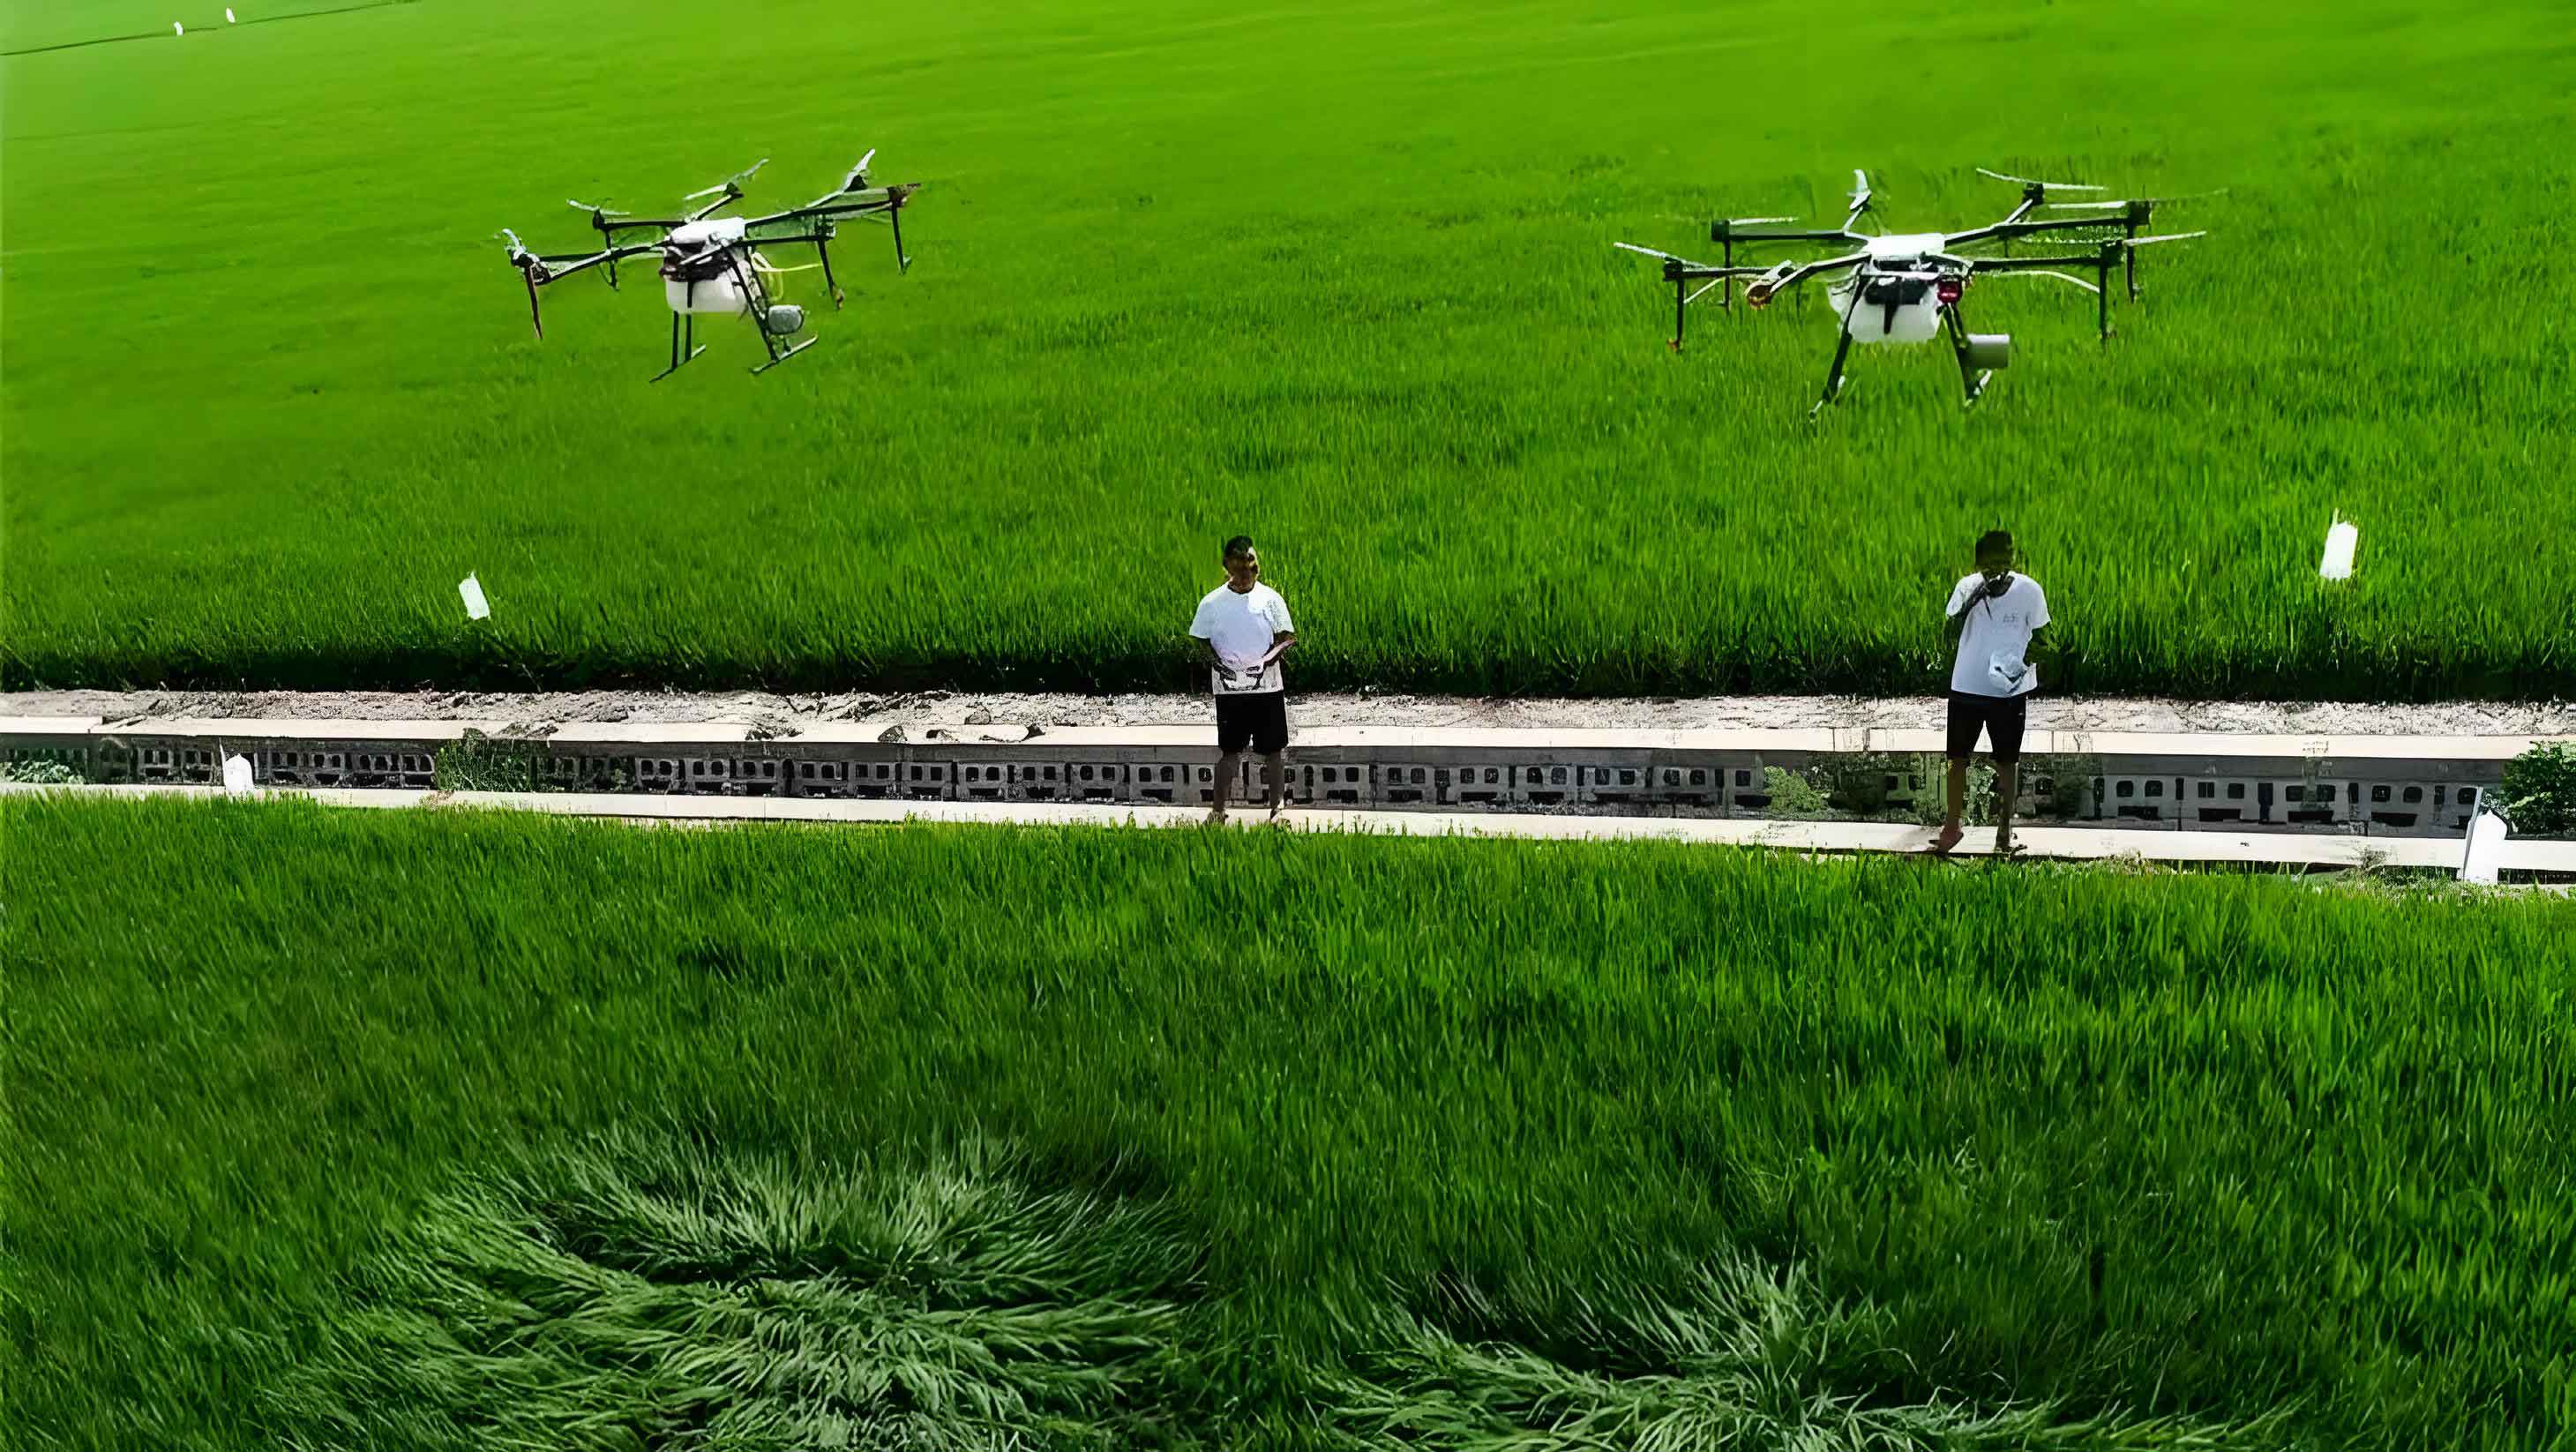
In modern agriculture, the use of crop spraying drones has revolutionized pest control and fertilization processes due to their efficiency, flexibility, and ability to reduce labor costs. These spraying UAVs operate by generating downwash airflow from their rotors, which interacts with spray droplets to influence deposition patterns on crops. However, this interaction can lead to issues such as droplet drift and uneven distribution, impacting the effectiveness of chemical applications. This study focuses on investigating the downwash flow field and droplet distribution of a single-rotor crop spraying drone using computational fluid dynamics (CFD) and discrete phase modeling (DPM). By analyzing factors like rotor speed, spray flow rate, and atomization pressure, we aim to optimize the performance of spraying UAVs for precision agriculture.
The adoption of crop spraying drones has grown rapidly due to their advantages over traditional methods, including higher operational efficiency and reduced environmental impact. These spraying UAVs can cover large areas quickly, but their effectiveness depends heavily on the downwash airflow generated by the rotor. This airflow accelerates droplet deposition but may also cause drift, leading to uneven coverage. Understanding the dynamics of this process is crucial for improving the design and operation of crop spraying drones. In this paper, we develop a comprehensive CFD model to simulate the downwash flow field and droplet behavior, providing insights that can enhance the accuracy of spray applications in fields.
To model the fluid dynamics of the crop spraying drone, we employ the Navier-Stokes equations for the continuous gas phase. The conservation equations in integral form are given by:
$$ \frac{\partial \mathbf{U}}{\partial t} + \frac{\partial (\mathbf{F} – \mathbf{F}_v)}{\partial x} + \frac{\partial (\mathbf{G} – \mathbf{G}_v)}{\partial y} + \frac{\partial (\mathbf{H} – \mathbf{H}_v)}{\partial z} = 0 $$
where the vectors are defined as:
$$ \mathbf{U} = \begin{bmatrix} \rho \\ \rho u \\ \rho v \\ \rho w \\ \rho e \end{bmatrix}, \quad \mathbf{F} = \begin{bmatrix} \rho u \\ \rho u^2 + p \\ \rho u v \\ \rho u w \\ \rho u (e + V^2/2) + p u \end{bmatrix}, \quad \mathbf{G} = \begin{bmatrix} \rho v \\ \rho u v \\ \rho v^2 + p \\ \rho v w \\ \rho v (e + V^2/2) + p v \end{bmatrix}, \quad \mathbf{H} = \begin{bmatrix} \rho w \\ \rho u w \\ \rho v w \\ \rho w^2 + p \\ \rho w (e + V^2/2) + p w \end{bmatrix} $$
and the viscous flux vectors are:
$$ \mathbf{F}_v = \begin{bmatrix} 0 \\ \tau_{xx} \\ \tau_{xy} \\ \tau_{xz} \\ k \frac{\partial T}{\partial x} + u \tau_{xx} + v \tau_{xy} + w \tau_{xz} \end{bmatrix}, \quad \mathbf{G}_v = \begin{bmatrix} 0 \\ \tau_{yx} \\ \tau_{yy} \\ \tau_{yz} \\ k \frac{\partial T}{\partial y} + u \tau_{yx} + v \tau_{yy} + w \tau_{yz} \end{bmatrix}, \quad \mathbf{H}_v = \begin{bmatrix} 0 \\ \tau_{zx} \\ \tau_{zy} \\ \tau_{zz} \\ k \frac{\partial T}{\partial z} + u \tau_{zx} + v \tau_{zy} + w \tau_{zz} \end{bmatrix} $$
Here, \( \rho \) is density, \( u, v, w \) are velocity components, \( p \) is pressure, \( e \) is internal energy, \( T \) is temperature, \( k \) is thermal conductivity, and \( \tau \) represents shear stresses. For the droplet phase, we use the Euler-Lagrange approach with the particle motion equation:
$$ \frac{d\mathbf{u}_p}{dt} = \frac{18\mu C_D \text{Re}}{24\rho_p d_p^2} (\mathbf{u} – \mathbf{u}_p) + \frac{\mathbf{g} (\rho_p – \rho)}{\rho_p} + \frac{1}{2} \frac{\rho}{\rho_p} \frac{d}{dt} (\mathbf{u} – \mathbf{u}_p) $$
where \( \mathbf{u}_p \) is the particle velocity, \( d_p \) is particle diameter, \( \mu \) is dynamic viscosity, \( \text{Re} \) is Reynolds number, \( C_D \) is drag coefficient, and \( \mathbf{g} \) is gravity. The TAB model for droplet breakup is applied as:
$$ F – k x – d \frac{dx}{dt} = m \frac{d^2 x}{dt^2} $$
where \( F \) is the external force, \( k \) is surface tension coefficient, \( x \) is deformation, and \( m \) is droplet mass. Turbulence is modeled using the SST k-ω model:
$$ \frac{\partial (\rho k)}{\partial t} + \frac{\partial (\rho u_i k)}{\partial x_i} = \frac{\partial}{\partial x_j} \left[ \Gamma_k \frac{\partial k}{\partial x_j} \right] + G_k – Y_k + S_k $$
$$ \frac{\partial (\rho \omega)}{\partial t} + \frac{\partial (\rho u_j \omega)}{\partial x_j} = \frac{\partial}{\partial x_j} \left[ \Gamma_\omega \frac{\partial \omega}{\partial x_j} \right] + G_\omega – Y_\omega + D_\omega + S_\omega $$
with \( k \) as turbulent kinetic energy, \( \omega \) as specific dissipation rate, \( \Gamma \) as effective diffusivity, \( G \) as production terms, \( Y \) as dissipation, and \( S \) as source terms.
The computational domain for the single-rotor crop spraying drone is a rectangular box of 7 m × 3 m × 4 m, with the rotor represented as a rotating cylindrical region. Mesh generation involves polyhedral cells with boundary layers near the rotor walls to capture detailed flow features. The boundary conditions include pressure outlets at the domain boundaries and no-slip walls at the drone body and ground. For droplet tracking, escape boundaries are set at outlets, while the ground is treated as a film boundary to model deposition. The spray is simulated using pressure-swirl atomizers located symmetrically below the rotor, with initial parameters set for droplet injection.
| Discrete Phase (Droplets) | Value | Continuous Phase (Air) | Value |
|---|---|---|---|
| Temperature (K) | 290 | Temperature (K) | 290 |
| Density (kg/m³) | 1000 | Density (kg/m³) | 1.225 |
| Viscosity (Pa·s) | 0.001 | Viscosity (Pa·s) | 1.20e-5 |
| Molar Mass (kg/mol) | 18 | Molar Mass (kg/mol) | 28 |
| Boiling Point (K) | 373 | Turbulence Intensity (%) | 10 |
The downwash flow field of the crop spraying drone is analyzed at various rotor speeds. At 750 rpm, the flow streamlines show a significant downwash effect, with higher velocities near the rotor tips and a decrease towards the center. As the distance from the rotor increases, the core region of high velocity expands laterally due to interactions with the ground and drone body. The reflection of airflow at the ground creates upward vortices, which influence droplet paths. For different rotor speeds, such as 500 rpm, 750 rpm, and 1000 rpm, the maximum downwash velocities in the core region are approximately 6 m/s, 10 m/s, and 14 m/s, respectively. This demonstrates that higher rotor speeds intensify the downwash, which can enhance droplet deposition but also increase the risk of drift.
To quantify the velocity distribution, we examine cross-sectional profiles at various heights below the rotor. The table below summarizes the maximum velocities and their positions for different rotor speeds:
| Rotor Speed (rpm) | Distance Below Rotor (m) | Max Velocity (m/s) | Radial Position of Max Velocity (m) |
|---|---|---|---|
| 500 | 0.5 | 6.0 | 1.4 |
| 500 | 1.0 | 5.2 | 1.6 |
| 500 | 1.5 | 4.5 | 2.0 |
| 750 | 0.5 | 10.0 | 1.4 |
| 750 | 1.0 | 8.8 | 1.6 |
| 750 | 1.5 | 7.5 | 2.0 |
| 1000 | 0.5 | 14.0 | 1.4 |
| 1000 | 1.0 | 12.5 | 1.6 |
| 1000 | 1.5 | 10.8 | 2.0 |
The droplet distribution analysis reveals that spray droplets from the crop spraying drone have diameters ranging from 25 μm to 184 μm under standard conditions. The droplets form a conical pattern, with smaller diameters near the center and larger ones at the periphery. As the distance from the spray nozzles increases, the coverage area expands, improving the effective deposition on crops. However, higher rotor speeds narrow the spray cone due to stronger downwash, concentrating droplets in a smaller region. The mass concentration of droplets on the ground shows that increased rotor speed leads to higher deposition density, indicating that downwash airflow accelerates droplet settling. This is beneficial for reducing drift but requires careful control to avoid over-concentration.
We further investigate the effects of spray flow rate and atomization pressure on droplet characteristics. For flow rates of 0.002 kg/s, 0.005 kg/s, and 0.008 kg/s per nozzle, the maximum droplet diameters increase from 130 μm to 220 μm, and the spray coverage area expands. This suggests that higher flow rates produce larger droplets and wider distribution, which can be advantageous for covering larger crop areas. In contrast, increasing the atomization pressure from 0.5 MPa to 3 MPa reduces the maximum droplet diameter from 280 μm to 100 μm and decreases the spray area, leading to finer droplets that are more prone to drift. The following table summarizes these findings:
| Parameter | Value | Max Droplet Diameter (μm) | Spray Coverage Area (m²) |
|---|---|---|---|
| Flow Rate (kg/s) | 0.002 | 130 | 1.5 |
| Flow Rate (kg/s) | 0.005 | 175 | 2.0 |
| Flow Rate (kg/s) | 0.008 | 220 | 2.5 |
| Atomization Pressure (MPa) | 0.5 | 280 | 3.0 |
| Atomization Pressure (MPa) | 1.0 | 200 | 2.5 |
| Atomization Pressure (MPa) | 2.0 | 150 | 2.0 |
| Atomization Pressure (MPa) | 3.0 | 100 | 1.5 |
The interaction between the downwash flow field and droplets in a crop spraying drone is complex and influenced by multiple factors. The downwash airflow generated by the rotor of a spraying UAV not only accelerates droplet deposition but also shapes the spray pattern. At higher rotor speeds, the increased velocity enhances the downward momentum of droplets, reducing drift but potentially causing uneven distribution if not managed properly. The reflection vortices at the ground can redirect smaller droplets upward, leading to losses. Therefore, optimizing the rotor speed and spray parameters is essential for achieving uniform coverage in agricultural applications.
In terms of droplet dynamics, the TAB model effectively captures the breakup process, where higher atomization pressures result in smaller droplets due to increased shear forces. This is described by the Weber number \( \text{We} = \frac{\rho u^2 d}{\sigma} \), where \( \sigma \) is surface tension. When We exceeds a critical value, droplets undergo secondary breakup, fragmenting into smaller sizes. For crop spraying drones, maintaining an optimal droplet size is crucial; too small droplets may drift away, while too large ones may not adhere well to plant surfaces. The initial flow rate and atomization pressure must be balanced to achieve the desired deposition efficiency.
The use of CFD simulations for spraying UAVs allows for detailed analysis without extensive field tests. By solving the governing equations numerically, we can predict the behavior of the downwash flow field and droplet trajectories under various conditions. The SST k-ω turbulence model provides accurate predictions of the turbulent flows around the rotor, which is vital for capturing the complex vortex structures. Additionally, the DPM approach tracks individual droplets, accounting for forces like drag and gravity. This integrated methodology enables the design of more efficient crop spraying drones that minimize chemical waste and environmental impact.
In practical applications, the findings from this study can guide the operation of crop spraying drones. For instance, flying at a moderate height ensures broader spray coverage while minimizing drift. Adjusting the rotor speed based on wind conditions can help control the downwash intensity. Moreover, selecting appropriate nozzle settings for flow rate and pressure can optimize droplet size for specific crops. These strategies enhance the precision of spraying UAVs, contributing to sustainable agriculture practices.
In conclusion, this study demonstrates the significant impact of downwash flow field on spray droplet distribution in single-rotor crop spraying drones. The downwash airflow, characterized by higher velocities at rotor tips and reflection vortices at the ground, accelerates droplet deposition but requires careful management to prevent drift. Increasing rotor speed intensifies the downwash, while higher spray flow rates enlarge droplet size and coverage area. Conversely, elevated atomization pressures reduce droplet size and spray extent. These insights provide a foundation for optimizing the performance of spraying UAVs, ensuring effective and uniform chemical application in crop protection. Future work could explore multi-rotor configurations and real-time adaptive control systems for further improvements in agricultural aviation technology.