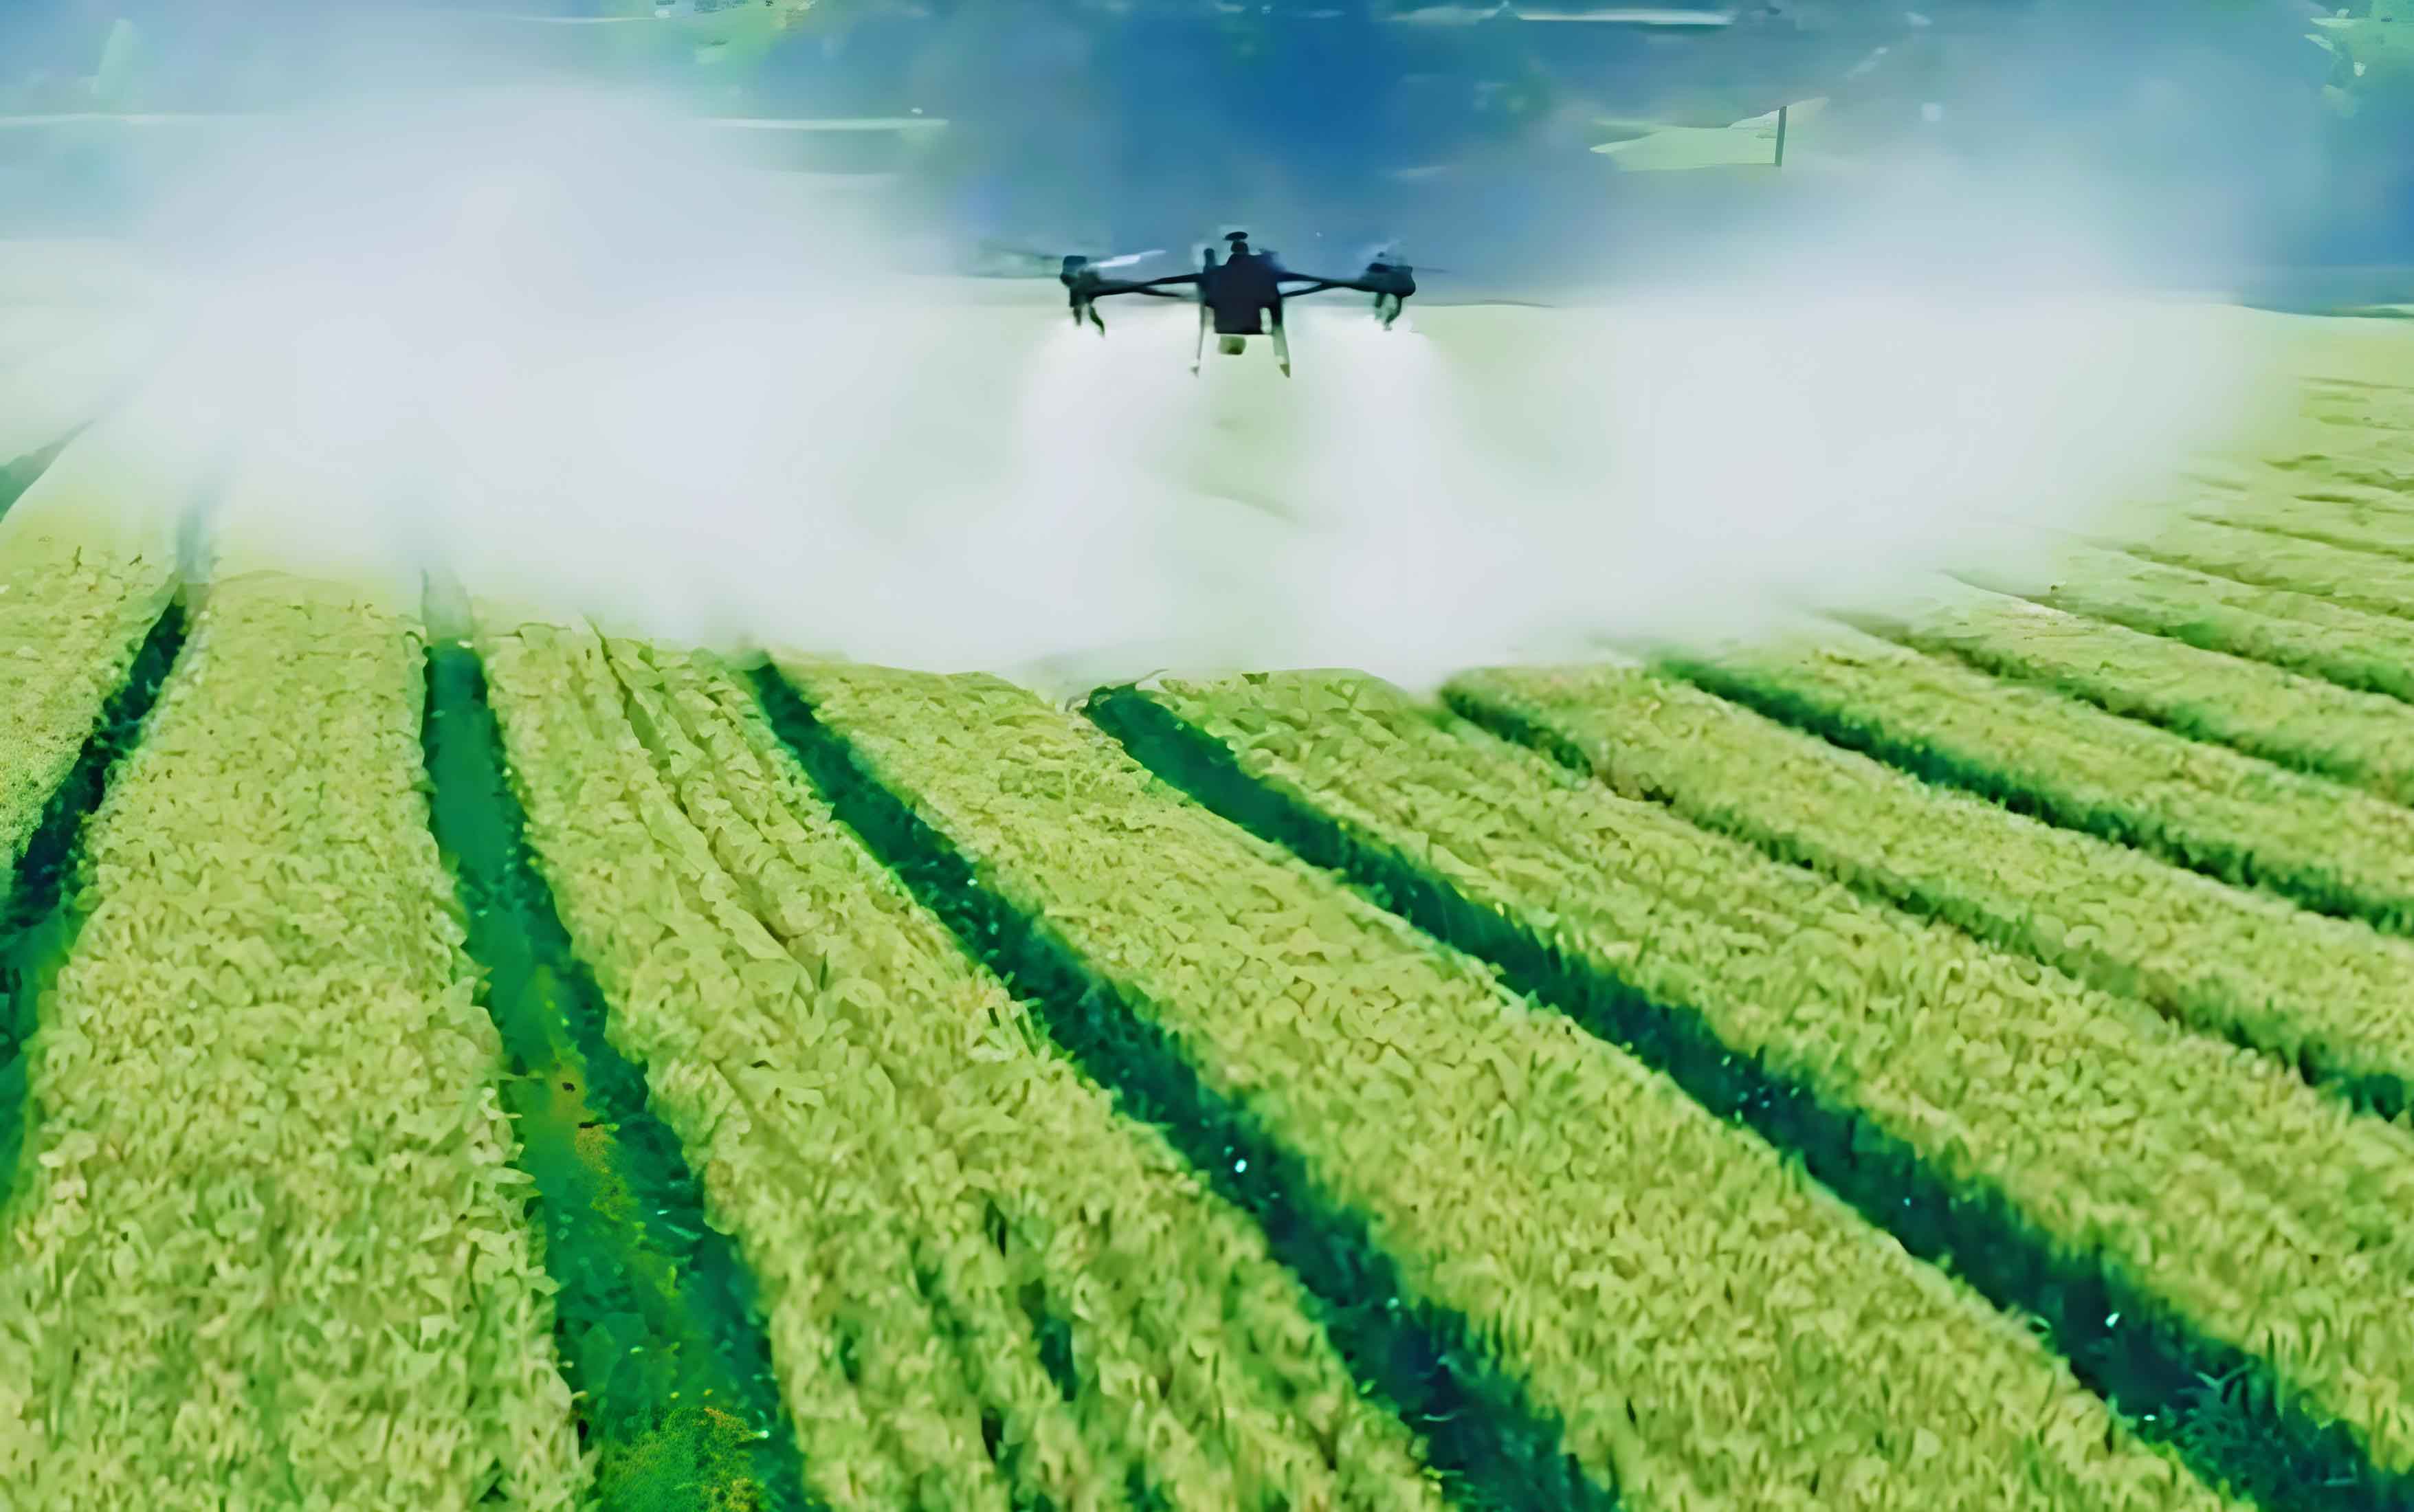
In recent years, the citrus industry has experienced rapid growth, with regions like Hunan becoming key production areas due to their favorable conditions. However, traditional methods of pest and disease control in citrus orchards often involve high labor intensity, low efficiency, and significant time and cost investments. Inefficient application techniques can lead to reduced fruit yield and quality, ultimately impacting economic returns. To address these challenges, there is a growing emphasis on enhancing the modernization and mechanization of orchard management, particularly by reducing human labor in spraying operations. Crop spraying drones, also known as spraying UAVs, have gained popularity for their efficiency, flexibility, and ability to apply low volumes of liquid. These spraying UAVs offer advantages such as precise droplet deposition and adaptability to various terrains, making them ideal for integrated pest management in agriculture.
Previous studies have explored the quality of spraying operations and droplet deposition patterns using different types of crop spraying drones. For instance, research on small unmanned aerial vehicles in fruit tree canopies has shown variations in droplet distribution based on factors like flight speed and height. Similarly, experiments with six-rotor spraying UAVs in citrus orchards have examined droplet density on leaves under different wind conditions. However, these findings cannot be directly applied to all regions due to differences in tree varieties, drone models, and local environments. In hilly areas of central Hunan, specific investigations are needed to optimize the use of spraying UAVs for citrus protection. Therefore, we conducted a study using the Jimu EA-30X quadcopter crop spraying drone to evaluate droplet deposition effects in young citrus trees. Our aim was to identify optimal operating parameters for improving spray quality in similar orchard conditions, thereby supporting the effective application of crop spraying drones in integrated pest management strategies.
Our experiment was carried out in a citrus orchard located in a region representative of central Hunan’s hilly terrain. The orchard featured navel orange trees approximately four years old, with a uniform natural round-head shape, canopy width of about 1.2 meters, and tree heights ranging from 1.4 to 1.7 meters. The spacing between trees was 2.5 meters by 3.0 meters, and the terrain was relatively flat, allowing for stable operations of the spraying UAV. We selected healthy trees with consistent growth patterns to ensure reliable data collection. The crop spraying drone used was the Jimu EA-30X, a four-rotor model with a payload capacity of up to 67 kg, a 30 L tank, and dual-peak misting nozzles that produce droplets ranging from 20 to 250 micrometers. This spraying UAV is equipped with features that enable precise control over spraying parameters, making it suitable for detailed studies on droplet deposition.
Environmental conditions during the experiment were monitored using portable wind speed and direction instruments, as well as digital thermohygrometers. The weather was clear with southeast winds of 1-2 grades, temperatures between 11-19°C, relative humidity of 92%, and an average wind speed of 3 m/s. These conditions were consistent across all trials to minimize external variables. For droplet collection, we used water-sensitive papers (35 mm x 110 mm) attached to leaves at different canopy levels—upper, middle, and lower—using clips and paper clips. Each tree had six sampling points (two per layer), and a total of six trees per treatment were assessed, resulting in 36 samples per experimental setup. The crop spraying drone was flown along the tree rows, and sampling areas were spaced approximately 8 meters apart to capture representative deposition patterns.
We designed an orthogonal experiment to investigate the effects of three key factors on droplet deposition: flight speed (Factor A), flight height (Factor B), and spray volume (Factor C). Each factor was tested at three levels, as shown in Table 1, leading to nine distinct treatments. This approach allows for efficient analysis of multiple variables without requiring a full factorial design, which is particularly useful in field studies with spraying UAVs. The specific levels were chosen based on preliminary tests and existing literature to cover a realistic range of operating conditions for crop spraying drones in citrus orchards.
| Level | Flight Speed (Factor A) (m/s) | Flight Height (Factor B) (m) | Spray Volume (Factor C) (L/667m²) |
|---|---|---|---|
| 1 | 1.5 | 2.5 | 2 |
| 2 | 2.0 | 3.0 | 3 |
| 3 | 2.5 | 3.5 | 4 |
The orthogonal array for the treatments is presented in Table 2, which outlines the combinations of factors and levels used in each trial. This structured design enables us to analyze the main effects and interactions of the parameters on droplet deposition metrics, such as density, uniformity, and coverage. By employing this method, we can derive optimal settings for the crop spraying drone that maximize efficiency and effectiveness in real-world applications.
| Treatment | Factor A | Factor B | Factor C |
|---|---|---|---|
| A1B1C1 | 1 | 1 | 1 |
| A1B2C2 | 1 | 2 | 2 |
| A1B3C3 | 1 | 3 | 3 |
| A2B1C2 | 2 | 1 | 2 |
| A2B2C3 | 2 | 2 | 3 |
| A2B3C1 | 2 | 3 | 1 |
| A3B1C3 | 3 | 1 | 3 |
| A3B2C1 | 3 | 2 | 1 |
| A3B3C2 | 3 | 3 | 2 |
Data collection involved retrieving the water-sensitive papers after spraying and scanning them for analysis. We used image processing software to calculate droplet density (number of droplets per cm²), coverage (percentage of area covered), and uniformity. Uniformity was assessed using the coefficient of variation (CV), which measures the relative variability in droplet distribution. The formula for CV is given by:
$$ CV = \frac{S}{\bar{X}} \times 100\% $$
where \( S \) is the standard deviation of droplet density samples, and \( \bar{X} \) is the mean droplet density. A lower CV indicates more uniform deposition, which is critical for effective pesticide application using spraying UAVs. This metric helps in evaluating how consistently the crop spraying drone distributes droplets across the canopy, which can influence the overall efficacy of pest control.
The results for droplet deposition density across different canopy layers are summarized in Table 3. Overall, the upper canopy layer had higher droplet densities compared to the middle and lower layers, which is consistent with the typical deposition pattern of spraying UAVs due to downward airflow and droplet settling. Among the treatments, A3B1C3 (flight speed 2.5 m/s, height 2.5 m, spray volume 4.0 L/667m²) showed the highest deposition densities in the upper, middle, and lower layers, with values of 121.04, 70.22, and 39.51 droplets/cm², respectively. This treatment outperformed others, suggesting that these parameters are optimal for the crop spraying drone in this context. Statistical analysis using significance tests (p < 0.05) revealed significant differences between treatments, highlighting the impact of operating parameters on deposition efficiency.
| Treatment | Upper Layer Density (droplets/cm²) | Middle Layer Density (droplets/cm²) | Lower Layer Density (droplets/cm²) | Upper Layer CV (%) | Middle Layer CV (%) | Lower Layer CV (%) |
|---|---|---|---|---|---|---|
| A1B1C1 | 50.58 ± 6.59 | 33.84 ± 3.73 | 44.47 ± 5.88 | 45.12 | 38.16 | 45.79 |
| A1B2C2 | 68.83 ± 5.70 | 44.38 ± 6.05 | 28.22 ± 3.96 | 28.69 | 47.23 | 48.64 |
| A1B3C3 | 71.09 ± 14.16 | 34.26 ± 2.51 | 28.39 ± 2.70 | 68.99 | 25.36 | 32.95 |
| A2B1C2 | 63.88 ± 9.64 | 29.20 ± 2.67 | 22.60 ± 1.37 | 52.31 | 31.65 | 21.05 |
| A2B2C3 | 114.51 ± 12.88 | 66.63 ± 7.19 | 33.21 ± 6.00 | 38.97 | 37.39 | 62.60 |
| A2B3C1 | 56.27 ± 6.27 | 29.77 ± 1.93 | 23.52 ± 1.69 | 38.58 | 22.49 | 24.96 |
| A3B1C3 | 121.04 ± 10.65 | 70.22 ± 10.23 | 39.51 ± 5.88 | 30.49 | 50.47 | 51.53 |
| A3B2C1 | 81.41 ± 11.19 | 33.49 ± 4.26 | 12.69 ± 1.84 | 47.61 | 44.09 | 50.75 |
| A3B3C2 | 103.42 ± 11.39 | 56.58 ± 6.41 | 39.97 ± 4.68 | 38.17 | 39.23 | 40.59 |
To further analyze the effects of each factor, we performed a range analysis on droplet deposition density, as shown in Table 4. The results indicate that spray volume (Factor C) had the greatest influence on deposition density in the upper and middle canopy layers, followed by flight speed (Factor A) and flight height (Factor B). For the lower layer, flight speed was the most significant factor. This underscores the importance of adjusting spray volume and speed when using a crop spraying drone to achieve desired deposition patterns. The optimal levels derived from this analysis align with treatment A3B1C3, reinforcing its superiority in enhancing droplet density across all layers.
| Metric | Factor A | Factor B | Factor C | ||||||
|---|---|---|---|---|---|---|---|---|---|
| Canopy Layer | Upper | Middle | Lower | Upper | Middle | Lower | Upper | Middle | Lower |
| K1 | 190.50 | 112.48 | 101.08 | 235.50 | 133.26 | 106.58 | 188.26 | 97.10 | 80.68 |
| K2 | 234.66 | 125.60 | 79.33 | 264.75 | 144.50 | 74.12 | 236.13 | 130.16 | 90.79 |
| K3 | 305.87 | 160.29 | 92.17 | 230.78 | 120.61 | 91.88 | 306.64 | 171.11 | 101.11 |
| K1 Mean | 63.50 | 37.49 | 33.69 | 78.50 | 44.42 | 35.53 | 62.75 | 32.37 | 26.89 |
| K2 Mean | 78.22 | 41.87 | 26.44 | 88.25 | 48.17 | 24.71 | 78.71 | 43.39 | 30.26 |
| K3 Mean | 101.96 | 53.43 | 30.72 | 76.93 | 40.20 | 30.63 | 102.21 | 57.04 | 33.70 |
| Range | 38.46 | 15.94 | 7.25 | 11.32 | 7.96 | 10.82 | 39.46 | 24.67 | 6.81 |
| Optimal Level | A3 | A3 | A1 | B2 | B2 | B1 | C3 | C3 | C3 |
Uniformity of droplet deposition, as measured by the coefficient of variation (CV), is crucial for ensuring even pesticide coverage. Table 5 presents the range analysis for CV values across canopy layers. The primary factors affecting uniformity varied by layer: for the upper layer, flight height and speed were most influential; for the middle layer, flight speed and height; and for the lower layer, flight height and spray volume. This suggests that operators of spraying UAVs should prioritize adjusting height and speed to improve uniformity, especially in complex canopy structures. Treatments like A1B2C2 and A3B1C3 showed relatively lower CV values in certain layers, indicating better uniformity under those parameter sets.
| Metric | Factor A | Factor B | Factor C | ||||||
|---|---|---|---|---|---|---|---|---|---|
| Canopy Layer | Upper | Middle | Lower | Upper | Middle | Lower | Upper | Middle | Lower |
| K1 | 142.80 | 110.75 | 127.38 | 127.92 | 120.28 | 118.37 | 131.31 | 104.74 | 121.10 |
| K2 | 129.86 | 91.53 | 108.61 | 115.27 | 128.71 | 161.59 | 119.17 | 118.11 | 110.28 |
| K3 | 116.27 | 133.79 | 142.87 | 145.74 | 87.08 | 98.50 | 138.45 | 113.22 | 147.08 |
| K1 Mean | 47.60 | 36.92 | 42.46 | 42.64 | 40.09 | 39.46 | 43.77 | 34.91 | 40.37 |
| K2 Mean | 43.29 | 30.51 | 36.20 | 38.42 | 42.90 | 53.86 | 39.72 | 39.37 | 36.76 |
| K3 Mean | 38.76 | 44.60 | 47.49 | 48.58 | 29.03 | 32.83 | 46.15 | 37.74 | 49.03 |
| Range | 8.84 | 14.09 | 11.42 | 10.16 | 13.88 | 21.03 | 6.43 | 4.46 | 12.27 |
| Optimal Level | A1 | A3 | A3 | B3 | B2 | B2 | C3 | C2 | C3 |
Droplet coverage, expressed as the percentage of area covered by spray droplets, is another key metric for evaluating the performance of crop spraying drones. The results in Table 6 show that coverage varied significantly across treatments and canopy layers. Treatment A3B1C3 again demonstrated the highest coverage values in the upper (15.02%), middle (12.96%), and lower (8.72%) layers, confirming its overall effectiveness. Statistical significance tests (p < 0.05) indicated that differences between treatments were notable, emphasizing the role of optimized parameters in achieving adequate coverage for pest control.
| Treatment | Upper Layer Coverage (%) | Middle Layer Coverage (%) | Lower Layer Coverage (%) |
|---|---|---|---|
| A1B1C1 | 6.48 ± 1.04 | 5.91 ± 1.20 | 4.29 ± 0.58 |
| A1B2C2 | 6.80 ± 1.00 | 5.66 ± 0.93 | 3.08 ± 0.52 |
| A1B3C3 | 11.99 ± 1.77 | 7.02 ± 0.63 | 5.15 ± 0.71 |
| A2B1C2 | 8.08 ± 1.79 | 6.19 ± 0.58 | 5.21 ± 0.99 |
| A2B2C3 | 13.12 ± 1.33 | 7.83 ± 1.58 | 6.09 ± 0.84 |
| A2B3C1 | 7.63 ± 1.35 | 8.58 ± 1.59 | 5.46 ± 0.90 |
| A3B1C3 | 15.02 ± 1.75 | 12.96 ± 2.41 | 8.72 ± 0.97 |
| A3B2C1 | 8.27 ± 0.67 | 6.69 ± 1.04 | 4.38 ± 0.61 |
| A3B3C2 | 9.65 ± 0.62 | 10.81 ± 1.70 | 6.36 ± 1.04 |
Range analysis for coverage, detailed in Table 7, reveals that spray volume was the dominant factor influencing upper layer coverage, while flight speed had the greatest impact on middle and lower layer coverage. This aligns with the deposition density findings and highlights the need for balanced parameter settings in spraying UAV operations. The optimal levels for coverage generally correspond to higher flight speeds and spray volumes, which promote better penetration and distribution in the canopy. By integrating these insights, users of crop spraying drones can fine-tune their approaches to maximize coverage and minimize waste.
| Metric | Factor A | Factor B | Factor C | ||||||
|---|---|---|---|---|---|---|---|---|---|
| Canopy Layer | Upper | Middle | Lower | Upper | Middle | Lower | Upper | Middle | Lower |
| K1 | 25.27 | 18.58 | 12.52 | 29.58 | 25.06 | 18.22 | 22.38 | 21.18 | 14.13 |
| K2 | 28.83 | 22.60 | 16.75 | 28.19 | 20.18 | 13.55 | 24.53 | 22.66 | 14.64 |
| K3 | 32.95 | 30.47 | 19.47 | 29.28 | 26.41 | 16.98 | 40.13 | 27.81 | 19.97 |
| K1 Mean | 8.42 | 6.19 | 4.17 | 9.86 | 8.35 | 6.07 | 7.46 | 7.06 | 4.71 |
| K2 Mean | 9.61 | 7.53 | 5.58 | 9.40 | 6.73 | 4.52 | 8.18 | 7.55 | 4.88 |
| K3 Mean | 10.98 | 10.16 | 6.49 | 9.76 | 8.80 | 5.66 | 13.38 | 9.27 | 6.66 |
| Range | 2.56 | 3.97 | 2.32 | 0.46 | 2.07 | 1.55 | 5.92 | 2.21 | 1.95 |
| Optimal Level | A3 | A3 | A3 | B1 | B3 | B1 | C3 | C3 | C3 |
In discussion, our findings emphasize that the optimization of spraying parameters is essential for enhancing the performance of crop spraying drones in citrus orchards. The superior results with treatment A3B1C3 (flight speed 2.5 m/s, height 2.5 m, spray volume 4.0 L/667m²) can be attributed to the synergistic effects of these parameters. Higher flight speeds may improve droplet penetration through the canopy, while moderate heights and increased spray volumes ensure adequate deposition and coverage. The use of spraying UAVs like the Jimu EA-30X allows for precise control over these factors, enabling farmers to achieve better pest management outcomes. Moreover, the observed patterns in droplet distribution—where upper layers receive more droplets—are consistent with aerodynamic principles of spraying UAVs, where rotor downwash influences droplet movement. This understanding can guide further refinements in drone technology and operational protocols.
From a practical perspective, implementing these optimized parameters can lead to significant benefits in citrus production. For example, improved droplet deposition can enhance the control of pests such as leaf miners and moths, which commonly affect young shoots and foliage. By using crop spraying drones with tailored settings, farmers can reduce pesticide usage, lower labor costs, and minimize environmental impact. Additionally, the variability in factors affecting different canopy layers suggests that customizing parameters based on tree growth stage and canopy density could further improve efficiency. Future research should explore the integration of real-time sensors and automated adjustment systems in spraying UAVs to dynamically optimize parameters during flight.
In conclusion, our study demonstrates that the Jimu EA-30X crop spraying drone can achieve optimal droplet deposition in citrus orchards when operated at a flight speed of 2.5 m/s, flight height of 2.5 m, and spray volume of 4.0 L/667m². The primary factors influencing deposition density are spray volume and flight speed, while uniformity and coverage are most affected by flight height and speed. These insights provide valuable guidance for farmers and operators of spraying UAVs in similar regions, promoting the adoption of advanced technologies for sustainable agriculture. As the use of crop spraying drones continues to expand, ongoing optimization of parameters will be crucial for maximizing their potential in integrated pest management and overall orchard productivity.