As a member of the radio frequency management team, I have been directly involved in ensuring the success of numerous large-scale drone shows, where the coordination of hundreds or even thousands of drones relies heavily on a stable electromagnetic environment. The rise of drone performances as a popular form of public entertainment has introduced unique challenges in radio frequency management, particularly due to the susceptibility of drone control systems to interference. In this first-person account, I will detail our comprehensive approach to safeguarding these events, emphasizing the technical strategies, equipment deployment, and real-time monitoring that underpin our efforts. Our goal is always to achieve a flawless drone performance, free from disruptions, and this requires a deep understanding of radio frequency dynamics, proactive risk assessment, and rapid response capabilities.
The foundation of any successful drone show lies in meticulous preparation. For instance, in a recent large-scale event involving over a thousand drones, our team established a dedicated task force weeks in advance. We began by collaborating with event organizers to gather critical data, including the exact coordinates of the performance area, the number of drones, and the specific communication frequencies they would use. This information is vital for predicting potential interference and designing an effective monitoring plan. We conducted pre-event electromagnetic surveys within a 5-kilometer radius of the performance site, using advanced spectrum analyzers to map the ambient radio frequency environment. This pre-monitoring phase allowed us to establish a baseline database, which we later used to detect anomalies during the actual drone performance. The importance of this step cannot be overstated; it enables us to identify and mitigate risks before they escalate, ensuring that the drone show proceeds without hiccups.
To illustrate the complexity of frequency allocation in such events, consider the following table summarizing the key frequency bands typically monitored during a drone performance. This table highlights the primary bands used for drone communication, their purposes, and the potential sources of interference we routinely check for. By categorizing this data, we can systematically address each band during our monitoring activities, reducing the likelihood of oversight.
| Frequency Band | Purpose in Drone Performance | Common Interference Sources | Monitoring Priority |
|---|---|---|---|
| 2.4 GHz | Data transmission and remote control | Wi-Fi networks, Bluetooth devices | High |
| 5.8 GHz | High-speed data links for video and control | Microwave ovens, other ISM band devices | High |
| GPS L1 (1575.42 MHz) | Navigation and positioning | GPS jammers, unauthorized transmitters | Critical |
| 900 MHz | Long-range control in some systems | Industrial equipment, amateur radio | Medium |
During the preparation phase, we also develop mathematical models to predict signal behavior and potential interference scenarios. One fundamental equation we use is the free-space path loss formula, which helps us estimate the signal attenuation over distance. This is crucial for understanding how drone control signals might degrade in the performance area. The formula is expressed as:
$$ P_r = P_t G_t G_r \left( \frac{\lambda}{4\pi d} \right)^2 $$
where \( P_r \) is the received power, \( P_t \) is the transmitted power, \( G_t \) and \( G_r \) are the gains of the transmitting and receiving antennas, respectively, \( \lambda \) is the wavelength, and \( d \) is the distance between transmitter and receiver. By applying this model, we can simulate various scenarios, such as how external signals might interfere with the drone performance, and adjust our monitoring strategies accordingly. For example, if we anticipate weak signal areas, we deploy additional portable monitors to ensure comprehensive coverage. This proactive modeling is integral to preventing issues during the actual drone show, as it allows us to anticipate challenges rather than merely react to them.
In the days leading up to the drone performance, our team engages in intensive rehearsals and simulations. For the event I am describing, we set up a command center equipped with a mobile monitoring vehicle and portable spectrum analyzers. The mobile unit serves as our primary tool for high-precision spectrum analysis, capable of scanning the 2.4 GHz, 5.8 GHz, and GPS bands in real-time. Simultaneously, team members conduct foot patrols with handheld devices to cover blind spots and verify signal integrity. This dual approach—combining fixed and mobile monitoring—ensures that we capture a holistic view of the electromagnetic environment. During rehearsals, we identified and neutralized several instances of unauthorized drone activity, often referred to as “rogue drones,” which could have jeopardized the entire drone show. By coordinating with local authorities, we swiftly addressed these threats, highlighting the importance of inter-agency collaboration in such high-stakes events.
The real-time monitoring phase is where our preparation pays off. On the day of the main drone performance, we initiated a “full-time duty and full-spectrum monitoring” mode, starting hours before the event. Our team worked in shifts to maintain constant vigilance, using the mobile monitoring vehicle to perform continuous scans. The data collected during this period is logged and analyzed against our baseline database, allowing us to detect even minor deviations that could indicate interference. For instance, we monitor the signal-to-noise ratio (SNR) for critical frequencies, which can be represented by the formula:
$$ \text{SNR} = \frac{P_{\text{signal}}}{P_{\text{noise}}} $$
where \( P_{\text{signal}} \) is the power of the desired signal and \( P_{\text{noise}} \) is the power of background noise. A sudden drop in SNR could signal the presence of an interfering source, prompting immediate investigation. In one case, we noticed anomalous signals in the GPS band during a rehearsal; through rapid triangulation, we located and disabled an illegal jammer, thus averting a potential disaster for the drone performance. This incident underscores the dynamic nature of our work, where quick thinking and technical expertise are essential to maintaining the integrity of the show.
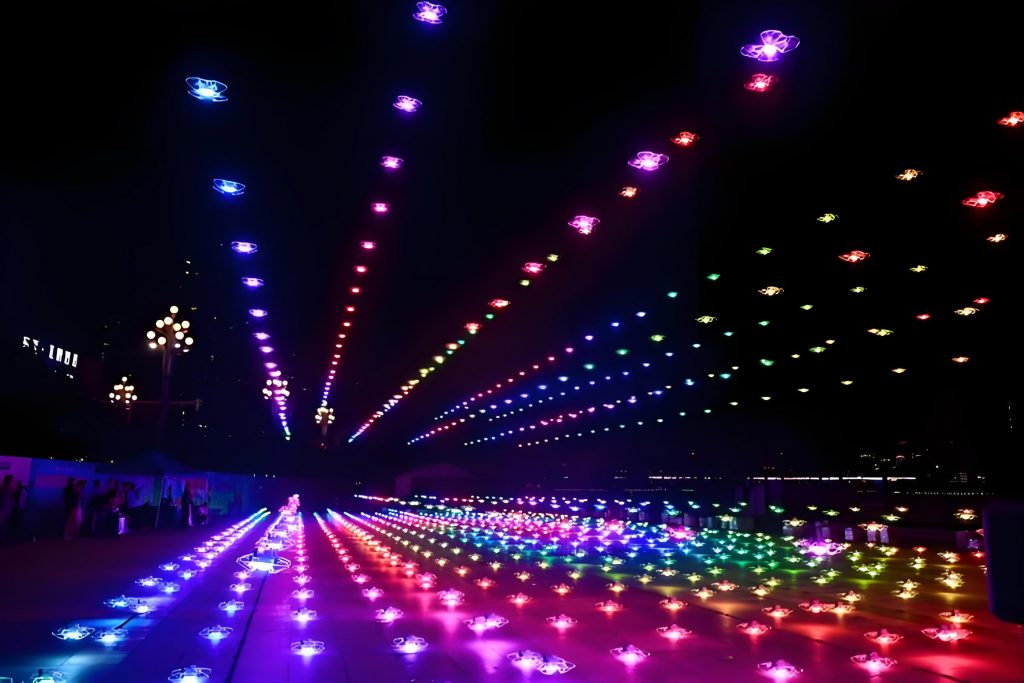
As the drone performance commenced, the sky lit up with intricate formations, showcasing the seamless coordination of the drones. The visual spectacle was a testament to the hours of preparation and monitoring we had invested. To provide a clearer picture of our resource allocation during such events, the following table outlines the typical equipment and personnel deployed for a large-scale drone show. This breakdown helps in understanding the scale of operations required to ensure a successful outcome.
| Resource Type | Quantity | Function | Deployment Duration |
|---|---|---|---|
| Mobile Monitoring Vehicle | 1 | High-precision spectrum analysis and real-time scanning | 16+ hours |
| Portable Spectrum Analyzers | 4-6 | On-foot patrols and localized signal checks | Throughout event |
| Technical Staff | 4-5 | Operation of equipment and data analysis | Shift-based coverage |
| Backup Communication Systems | 2 | Redundancy for control links | On standby |
Throughout the drone performance, we maintained a constant watch on the key frequency bands, using automated alerts to flag any irregularities. The success of this approach is evident in the fact that no harmful interference was detected during the main event, allowing the drones to execute their programmed sequences without deviation. The drone show featured a series of stunning aerial displays, including thematic light patterns that captivated the audience. This achievement was not accidental; it resulted from a methodical process that integrated technology, teamwork, and rigorous protocols. Our ability to sustain a interference-free environment for the entire duration of the drone performance demonstrates the effectiveness of our radio frequency management strategies.
In addition to real-time monitoring, we employ predictive analytics to enhance our response capabilities. For example, we use statistical models to forecast potential interference based on historical data and real-time inputs. One such model involves calculating the probability of interference occurrence using a Poisson distribution, which is useful for rare events like unexpected signal jamming. The probability mass function is given by:
$$ P(X = k) = \frac{\lambda^k e^{-\lambda}}{k!} $$
where \( \lambda \) is the average rate of interference events per unit time, and \( k \) is the number of occurrences. By estimating \( \lambda \) from past drone performances, we can allocate resources more efficiently, focusing on high-risk periods. This data-driven approach not only improves our preparedness but also reduces the likelihood of last-minute surprises during the drone show. Moreover, we continuously refine these models based on post-event analyses, creating a feedback loop that strengthens our future operations.
Another critical aspect of our work is public safety. A compromised drone performance could lead to drones straying off course, posing risks to spectators and infrastructure. To mitigate this, we implement geofencing techniques using GPS signals, which create virtual boundaries for the drones. The accuracy of these boundaries depends on the integrity of the GPS signals, which we monitor closely. If we detect spoofing or jamming attempts, we can trigger alerts and initiate countermeasures, such as switching to backup navigation systems. This multi-layered security approach ensures that even in adverse conditions, the drone performance remains under control. Our team’s vigilance during one event prevented a potential GPS spoofing incident, which could have caused drones to deviate from their intended paths, highlighting the life-saving potential of our efforts.
Post-event analysis is equally important for continuous improvement. After each drone show, we compile detailed reports that include metrics on signal stability, interference incidents, and response times. These reports often contain tables like the one below, which summarizes the performance metrics for a typical large-scale drone performance. This data helps us identify trends and areas for enhancement in future events.
| Metric | Target Value | Actual Value | Deviation |
|---|---|---|---|
| Signal Availability (%) | 99.9 | 100 | 0 |
| Interference Events | 0 | 0 | 0 |
| Response Time to Alerts (minutes) | < 5 | 3 | -2 |
| Drone Command Latency (ms) | < 50 | 45 | -5 |
Reflecting on these experiences, I am convinced that the success of a drone performance hinges on a holistic radio frequency management strategy. From pre-event surveys to real-time monitoring and post-analysis, every step is interlinked. The use of advanced technologies, such as software-defined radios and machine learning algorithms, has further enhanced our capabilities. For instance, we are exploring adaptive filtering techniques to suppress noise in real-time, which can be modeled using equations like the Wiener filter, expressed as:
$$ W(f) = \frac{P_{ss}(f)}{P_{ss}(f) + P_{nn}(f)} $$
where \( P_{ss}(f) \) is the power spectral density of the signal, and \( P_{nn}(f) \) is that of the noise. By implementing such filters, we can improve signal clarity during a drone show, especially in urban environments with high electromagnetic pollution. This innovation is part of our ongoing effort to stay ahead of emerging threats and ensure that every drone performance is a memorable spectacle.
In conclusion, managing the radio frequency environment for large-scale drone performances is a complex yet rewarding endeavor. Our team’s commitment to technical excellence, coupled with robust protocols, has enabled us to achieve “zero interference, zero error” outcomes consistently. The growing popularity of drone shows demands even greater vigilance, and we are continuously evolving our methods to meet these challenges. Through collaboration, innovation, and relentless monitoring, we aim to set new standards in radio frequency security, ensuring that every drone performance not only dazzles the audience but also operates safely and reliably. As I look to the future, I am excited by the prospects of integrating more autonomous systems and AI-driven analytics to further elevate the safety and spectacle of these events.