
I approach the problem of rotor noise and electric power in UAV drones as a coupled aerodynamic, acoustic, and electromechanical challenge. In my view, the central difficulty is not merely measuring how loud a UAV drone becomes, but explaining why a given rotor configuration produces a particular tonal and broadband spectrum while also consuming a specific amount of electric power. This is especially important because UAV drones are moving from isolated experimental use into urban logistics, inspection, agriculture, and emergency response. In those settings, noise is not only an engineering by-product; it becomes a social and regulatory constraint. My work therefore focuses on a hybrid computational framework that combines Detached Eddy Simulation with the Ffowcs Williams-Hawkings acoustic analogy. I use this framework to study single-rotor UAV drones, quad-rotor UAV drones, and quad-rotor UAV drones carrying a cargo box. Across all cases, I keep the rotational speed at 8500 RPM so that aerodynamic and acoustic differences can be attributed mainly to rotor configuration and payload effects rather than to arbitrary changes in operating speed.
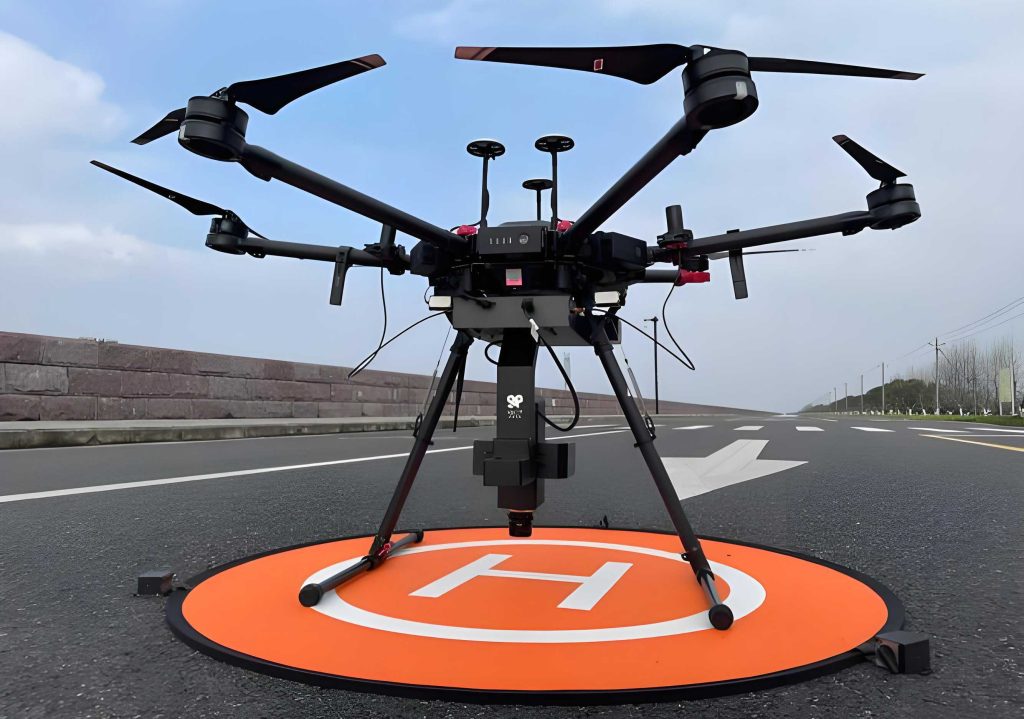
The phrase UAV drones appears throughout my analysis because the engineering problem is inherently multi-disciplinary. The rotor blade generates lift and torque, the wake contains turbulent structures that radiate sound, and the propulsion system converts electric power into mechanical rotation. If I ignore any one of these links, I obtain an incomplete picture. For example, a design that reduces noise by lowering blade loading may require a higher rotational speed to maintain thrust, which can increase electric power consumption. Conversely, a payload may increase lift requirements and shift the wake, changing both the sound pressure level and the torque demand. My first-person research perspective is therefore that quieter UAV drones must be designed through simultaneous aerodynamic, acoustic, and power evaluation.
I begin with the mathematical and methodological foundations. The flow field around a rotating rotor is governed by the compressible or incompressible Navier-Stokes equations, depending on the acoustic region and the level of fidelity. For the near-field turbulence, I use the continuity and momentum equations in a form suitable for hybrid turbulence modeling. The continuity equation is:
$$ \frac{\partial \rho}{\partial t} + \nabla \cdot (\rho \mathbf{u}) = 0 $$
The momentum equation is:
$$ \frac{\partial (\rho \mathbf{u})}{\partial t} + \nabla \cdot (\rho \mathbf{u} \otimes \mathbf{u}) = -\nabla p + \nabla \cdot \boldsymbol{\tau} + \rho \mathbf{f} $$
Here, \(\rho\) is density, \(\mathbf{u}\) is the velocity vector, \(p\) is pressure, \(\boldsymbol{\tau}\) is the viscous stress tensor, and \(\mathbf{f}\) represents body forces. In the Reynolds-Averaged Navier-Stokes form, I decompose the velocity into mean and fluctuating parts and solve for the mean flow:
$$ \frac{\partial (\rho \bar{\mathbf{u}})}{\partial t} + \nabla \cdot (\rho \bar{\mathbf{u}} \otimes \bar{\mathbf{u}}) = -\nabla \bar{p} + \nabla \cdot \boldsymbol{\tau}_{RANS} + \rho \mathbf{f} $$
The Reynolds stress tensor \(\boldsymbol{\tau}_{RANS}\) accounts for the unresolved turbulence. Because RANS is computationally efficient but tends to smooth the unsteady structures that generate noise, I do not rely on it alone for acoustic prediction. Instead, I use it in attached boundary-layer regions and allow the model to switch to Large Eddy Simulation behavior in detached flow regions. This is the essential idea of Detached Eddy Simulation. The turbulent kinetic energy equation used within this hybrid strategy can be written as:
$$ \frac{\partial (\rho k)}{\partial t} + \nabla \cdot (\rho \mathbf{u} k) = \nabla \cdot (\mu_T \nabla k) + P_k – \epsilon $$
where \(k\) is turbulent kinetic energy, \(\mu_T\) is turbulent viscosity, \(P_k\) is production, and \(\epsilon\) is dissipation. The eddy viscosity is often modeled as:
$$ \nu_T = C_\mu \frac{k^2}{\epsilon} $$
In the LES region, I apply a spatial filter to separate resolved and subgrid scales:
$$ \bar{f}(\mathbf{x},t) = \int_V f(\mathbf{y},t) W(\mathbf{x}-\mathbf{y},\Delta) \, d\mathbf{y} $$
The Smagorinsky subgrid-scale model approximates the unresolved stresses as:
$$ \tau_{ij}^{SGS} = -2\rho C_s^2 \Delta^2 |\bar{S}| \bar{S}_{ij} $$
where \(C_s\) is the Smagorinsky constant, \(\Delta\) is the filter width, and \(\bar{S}_{ij}\) is the resolved strain-rate tensor. The DES length scale controls the transition between RANS and LES:
$$ \Delta_{DES} = \min(d_w, C_{DES}\Delta) $$
Here, \(d_w\) is the distance to the nearest wall. This formulation is important for UAV drones because the boundary layer near the rotor blade is thin and attached, while the wake contains detached eddies that dominate broadband noise. By using RANS near the wall and LES-like treatment in the wake, I obtain a practical balance between accuracy and computational cost.
For acoustic prediction, I use the Ffowcs Williams-Hawkings acoustic analogy. The general FWH equation can be expressed as:
$$ \frac{\partial^2 p’}{\partial t^2} – c_0^2 \nabla^2 p’ = \frac{\partial}{\partial t}[\rho_0 v_n \delta(f)] – \frac{\partial}{\partial x_i}[L_i \delta(f)] + \frac{\partial^2}{\partial x_i \partial x_j}[T_{ij} H(f)] $$
where \(p’\) is acoustic pressure, \(c_0\) is the ambient speed of sound, \(\rho_0\) is ambient density, \(v_n\) is the normal velocity of the surface, \(L_i\) is the surface loading, \(T_{ij}\) is the Lighthill stress tensor, \(\delta(f)\) is the Dirac delta, and \(H(f)\) is the Heaviside function. I interpret the three source terms as monopole, dipole, and quadrupole contributions. In low-speed UAV drones, the dipole term from unsteady pressure on the rotor blades is usually the dominant tonal source. The monopole term represents volume displacement and thickness noise. The quadrupole term becomes more important at higher speeds or when turbulent fluctuations are strong.
The far-field sound pressure can be predicted from the retarded-time integral. A simplified retarded time is:
$$ \tau = t – \frac{|\mathbf{x}-\mathbf{y}|}{c_0} $$
The sound pressure level is computed from the root-mean-square acoustic pressure:
$$ L_p = 20 \log_{10} \left( \frac{p_{rms}}{p_{ref}} \right) $$
where \(p_{ref} = 20 \, \mu Pa\). The blade-passing frequency is a key tonal indicator:
$$ f_{BPF} = \frac{N_b \Omega}{2\pi} $$
where \(N_b\) is the number of blades and \(\Omega\) is the angular velocity. The acoustic power radiated by the rotor can be estimated from the surface loading and velocity:
$$ P_{ac} = \int_S \mathbf{f} \cdot \mathbf{u} \, dA $$
For electric power, I use the mechanical relation between torque and angular velocity:
$$ P_{elec} \approx T \Omega $$
where \(T\) is torque and \(\Omega\) is angular velocity. The conversion from rotational speed in RPM to angular velocity is:
$$ \Omega = \frac{2\pi \times RPM}{60} $$
At 8500 RPM, this gives:
$$ \Omega = \frac{2\pi \times 8500}{60} = 890.12 \, \text{rad/s} $$
These equations form the core of my simulation and analysis. I summarize the main method choices in the following table.
| Method | Resolved scales | Computational cost | Main strength | Main limitation | Suitability for UAV drones |
|---|---|---|---|---|---|
| RANS | Mean flow | Low | Fast design iteration and baseline forces | Poor unsteady turbulence and noise sources | Useful for preliminary UAV drones analysis |
| LES | Large eddies | High | Captures broadband noise mechanisms | Expensive for full rotor configurations | Good but often too costly for routine UAV drones |
| DNS | All scales | Extreme | Highest fidelity | Impractical for full UAV drones | Limited to canonical problems |
| DES | RANS near wall, LES in wake | Moderate to high | Balances accuracy and cost | Requires careful mesh and interface treatment | Strong for UAV drones rotor wake and noise |
| FWH | Acoustic analogy | Low after flow solution | Efficient far-field noise prediction | Depends on near-field input quality | Excellent for UAV drones acoustic radiation |
I also decompose the noise mechanisms because the interpretation of UAV drones noise depends on which physical source dominates. The following table summarizes the acoustic source types in my framework.
| Source type | Physical mechanism | Typical signature | Importance for UAV drones |
|---|---|---|---|
| Monopole | Volume displacement and thickness effects | Low-frequency tonal content | Important near the rotor at low speeds |
| Dipole | Unsteady pressure on blade surfaces | Tonal noise and blade-passing harmonics | Dominant for many UAV drones rotors |
| Quadrupole | Turbulent fluctuations and wake eddies | Broadband noise | Significant at higher speeds and in complex wakes |
My computational setup was designed to isolate the effects of rotor number and payload. I used a rotating domain around each rotor and a larger stationary domain for the far field. A sliding mesh interface allowed the rotor motion to be represented without remeshing at every time step. The time step was chosen to resolve the blade-passing frequency and the dominant turbulent fluctuations. I used a coupled pressure-velocity solver, second-order upwind discretization for the convective fluxes, and a shear-stress transport turbulence formulation as the underlying RANS component before DES switching. The mesh was refined near the blade surfaces and in the rotor wake. I list the main setup parameters in the table below.
| Parameter | Single rotor | Quad rotor | Quad rotor with cargo box |
|---|---|---|---|
| Rotational speed | 8500 RPM | 8500 RPM | 8500 RPM |
| Angular velocity | 890.12 rad/s | 890.12 rad/s | 890.12 rad/s |
| Rotating domains | 1 | 4 | 4 |
| Stationary domain | 1 | 1 | 1 |
| Rotor arrangement | Isolated rotor | Two clockwise, two counterclockwise | Two clockwise, two counterclockwise |
| Mesh emphasis | Blade boundary layer and wake | Blade boundary layers and inter-rotor wakes | Blade boundary layers, inter-rotor wakes, cargo wake |
| Acoustic analogy | FWH | FWH | FWH |
| Turbulence treatment | DES | DES | DES |
The boundary conditions reflect an open-air operating environment. I imposed a velocity inlet for the incoming flow, a pressure outlet for the downstream boundary, and no-slip wall conditions on the rotor surfaces. The outer boundaries were treated to reduce numerical reflections, because reflected waves can contaminate far-field acoustic prediction. I also monitored lift, torque, and residuals to confirm convergence and statistical stability. The following table summarizes the boundary conditions and numerical controls.
| Item | Setting |
|---|---|
| Inlet | Velocity inlet |
| Outlet | Pressure outlet |
| Rotor surface | No-slip moving wall |
| Outer boundary | Low-reflection far-field treatment |
| Pressure-velocity coupling | Coupled solver |
| Convective discretization | Second-order upwind |
| Time stepping | Implicit unsteady |
| Convergence monitoring | Residuals, lift, torque |
For the single-rotor UAV drones case, I evaluated the aerodynamic performance at 8500 RPM. The lift and torque increased strongly relative to lower rotational speeds. The pressure distribution showed a clear difference between the suction surface and the pressure surface. The suction surface produced a low-pressure region near the leading edge, while the pressure surface produced a high-pressure region that contributed to lift. The tip region was especially active, which is important because tip vortices are a major source of broadband noise. The following table summarizes the single-rotor aerodynamic and electric power results.
| Quantity | Value | Unit |
|---|---|---|
| Lift | 6.362 | N |
| Torque | 0.099 | N·m |
| Angular velocity | 890.12 | rad/s |
| Electric power | 88.11 | W |
The electric power calculation follows directly from the torque and angular velocity:
$$ P_{single} = T \Omega = 0.099 \times 890.12 = 88.11 \, \text{W} $$
The velocity field downstream of the single rotor showed a well-defined wake. The axial velocity decreased with distance from the rotor, indicating energy transfer from the rotor to the surrounding air. The pressure field in the rotating domain showed strong gradients near the blade tip. This is consistent with the idea that UAV drones noise is not uniformly distributed around the rotor but is concentrated near regions of high aerodynamic activity. I also analyzed the noise spectrum at a monitoring point located one rotor diameter from the rotor center. The spectrum showed tonal components at lower frequencies and broadband content at higher frequencies. The one-third octave band analysis showed a peak sound pressure level near the mid-frequency range followed by a gradual decrease at higher frequencies. The following table summarizes the single-rotor acoustic monitoring results.
| Monitoring point | Sound pressure level for single rotor | Unit |
|---|---|---|
| 1 | 77.8684 | dB |
| 2 | 75.0846 | dB |
| 3 | 72.8449 | dB |
| 4 | 70.9673 | dB |
| 5 | 69.5030 | dB |
| 6 | 46.7105 | dB |
I observed that the sound pressure level decreases as the monitoring point moves farther from the UAV drones. This is expected from spherical spreading and from the increasing influence of atmospheric and numerical dissipation. However, the rate of decrease is not identical at all frequencies because tonal and broadband components propagate differently. The tonal component is tied to periodic blade passage, while the broadband component is linked to turbulent eddies in the wake. The Q-criterion visualization of the vortex field showed coherent vortex structures near the rotor tip. These structures are important because they indicate where vortex shedding and blade-vortex interaction may generate noise. A noise reduction strategy that disrupts these coherent structures, such as trailing-edge serrations or optimized blade planform, could reduce broadband noise without severely reducing lift.
For the quad-rotor UAV drones case, I extended the analysis to four rotors. The rotor interactions added several complications. First, the wakes of adjacent rotors can merge, creating a more complex turbulent field than that of a single rotor. Second, the pressure field around each rotor is influenced by the presence of the other rotors. Third, the acoustic field is not simply four times the single-rotor field because constructive and destructive interference can occur. This is one of the most important findings of my work: increasing the number of rotors increases noise, but the increase is not necessarily proportional to the number of rotors. My quad-rotor results showed a much higher sound pressure level than the single-rotor case, but the ratio was not four. The following table summarizes the quad-rotor aerodynamic and electric power results.
| Quantity | Value | Unit |
|---|---|---|
| Lift | 24.547 | N |
| Total torque | 0.409 | N·m |
| Angular velocity | 890.12 | rad/s |
| Electric power | 364.01 | W |
The power relation for the quad-rotor UAV drones is:
$$ P_{quad} = T \Omega = 0.409 \times 890.12 = 364.01 \, \text{W} $$
The pressure and velocity contours for the quad-rotor case showed that the inter-rotor spacing affects the wake structure. When the rotors are close, the wake from one rotor can enter the influence region of another. This can increase local turbulence, alter the effective angle of attack, and change the noise radiation pattern. I observed high vorticity near the rotor tips and in the wake merging regions. These regions are likely to be the main sources of broadband noise in quad-rotor UAV drones. The following table compares the single-rotor and quad-rotor acoustic results at the same monitoring points.
| Monitoring point | Single rotor SPL (dB) | Quad rotor SPL (dB) | Difference (dB) |
|---|---|---|---|
| 1 | 77.8684 | 102.1790 | 24.3106 |
| 2 | 75.0846 | 100.3270 | 25.2424 |
| 3 | 72.8449 | 98.9389 | 26.0940 |
| 4 | 70.9673 | 97.5866 | 26.6193 |
| 5 | 69.5030 | 96.3568 | 26.8538 |
| 6 | 46.7105 | 74.7176 | 28.0071 |
I interpret the acoustic difference as evidence that rotor interaction amplifies noise through wake interference and increased unsteady loading. The quad-rotor configuration produces more sound power because there are more blades passing through the air and because the combined wake is more turbulent. However, the non-proportional increase suggests that interference effects are present. This is important for the design of UAV drones because it means that rotor placement, phase synchronization, and rotational direction can be used as noise control variables. A well-designed quad-rotor UAV drone may produce less noise than a poorly designed quad-rotor UAV drone even if both have the same number of rotors.
In the payload case study, I modeled a quad-rotor UAV drones carrying a cargo box. The presence of the cargo box changed both the aerodynamic and acoustic fields. The cargo box introduced additional blockage, altered the pressure distribution under the UAV drones, and generated its own wake. The wake from the cargo box interacted with the rotor wakes, increasing turbulence in some regions and changing the directivity of the radiated sound. I used the same rotational speed of 8500 RPM so that the comparison with the unloaded quad-rotor case would be meaningful. The cargo box dimensions were 506 mm in length, 506 mm in width, and 480 mm in height. The mesh included four rotating zones and one stationary zone. The following table summarizes the payload case setup.
| Parameter | Value |
|---|---|
| Cargo box length | 506 mm |
| Cargo box width | 506 mm |
| Cargo box height | 480 mm |
| Rotational speed | 8500 RPM |
| Rotating zones | 4 |
| Stationary zone | 1 |
| Approximate total cells | 10.61 million |
| Acoustic analogy | FWH |
The aerodynamic results for the payload case showed higher lift and slightly higher torque than the unloaded quad-rotor case. The lift increased from 24.547 N to 25.835 N. The total torque increased from 0.409 N·m to 0.422 N·m. The electric power increased from 364.01 W to 375.58 W. The percent increase in electric power is:
$$ \Delta P = \frac{375.58 – 364.01}{364.01} \times 100 = 3.17\% $$
This is a modest but meaningful increase. It shows that a payload does not merely add weight; it changes the aerodynamic environment and therefore changes the torque required to maintain the same rotational speed. In practical UAV drones delivery, this means that payload integration must be considered in propulsion sizing and battery management. A 3.17% increase in power may appear small, but over a long delivery route it affects range, thermal loading, and battery life. The following table compares the aerodynamic and electric power results for the three main configurations.
| Configuration | Lift (N) | Torque (N·m) | Electric power (W) |
|---|---|---|---|
| Single rotor | 6.362 | 0.099 | 88.11 |
| Quad rotor | 24.547 | 0.409 | 364.01 |
| Quad rotor with goods effect | 25.835 | 0.422 | 375.58 |
The acoustic results for the payload case showed a more complicated trend. In the near field, the payload increased the sound pressure level at the first monitoring point. In the far field, however, the sound pressure level decreased at several downstream monitoring points relative to the unloaded quad-rotor case. I attribute this to two competing effects. The cargo box adds turbulence and can increase low-frequency noise near the UAV drones, but it can also scatter and shield part of the high-frequency noise. In addition, the cargo wake may shift the directivity of the radiated sound. The following table summarizes the sound pressure levels for the single-rotor, quad-rotor, and payload cases.
| Monitoring point | Single rotor SPL (dB) | Quad rotor SPL (dB) | Quad rotor with box SPL (dB) |
|---|---|---|---|
| 1 | 77.8684 | 102.1790 | 103.8080 |
| 2 | 75.0846 | 100.3270 | 100.2310 |
| 3 | 72.8449 | 98.9389 | 98.0788 |
| 4 | 70.9673 | 97.5866 | 96.3697 |
| 5 | 69.5030 | 96.3568 | 94.9115 |
| 6 | 46.7105 | 74.7176 | 72.4137 |
I find this result particularly relevant for urban UAV drones operations. A delivery UAV drone may be judged not only by its maximum noise near the vehicle but also by its noise footprint at street level and at building windows. If the payload reduces far-field noise while increasing near-field noise, then the overall community impact depends on the flight path and altitude. A higher altitude may reduce near-field exposure but increase the area affected by the far-field noise. A lower altitude may increase near-field exposure but reduce the duration of noise at distant receivers. These trade-offs cannot be resolved by a single sound pressure level value. They require spectral analysis, directivity analysis, and mission-level modeling.
I also examined the acoustic spectra. The quad-rotor and payload cases showed strong low-frequency tonal peaks associated with blade passage. The broadband component increased in the wake regions. The one-third octave band analysis for the payload case showed that the low-frequency range was amplified by the cargo wake. This suggests that payload-induced turbulence mainly affects the lower frequency part of the spectrum. High-frequency noise can be partially attenuated by scattering from the cargo box, but low-frequency noise is more difficult to shield because its wavelength is large compared with the cargo dimensions. This is an important design insight for UAV drones: payload packaging can be designed not only for structural and aerodynamic efficiency but also for acoustic scattering and wake management.
From a power perspective, I compared the single-rotor, quad-rotor, and payload cases using the torque and angular velocity relation. The single-rotor power is much lower than the quad-rotor power, which is expected because the quad-rotor system generates more lift and uses four rotors. The payload case requires the highest power among the three configurations. In my view, the correct interpretation is not that the payload is inefficient, but that the propulsion system must be sized with a margin for aerodynamic interference and wake distortion. A payload changes the flow field, and the rotors must work harder to maintain the same rotational speed and lift. The following table summarizes the power breakdown and percentage differences.
| Comparison | Power difference (W) | Percentage difference |
|---|---|---|
| Quad rotor vs. single rotor | 275.90 | 313.14% |
| Quad rotor with box vs. quad rotor | 11.57 | 3.17% |
| Quad rotor with box vs. single rotor | 287.47 | 326.26% |
The large difference between single-rotor and quad-rotor power is not surprising because the quad-rotor configuration produces much more lift. However, the acoustic comparison shows that noise does not scale in the same way as power. This is a key point for UAV drones design. If noise scaled directly with power, then reducing power would automatically reduce noise. In reality, noise depends on blade loading, tip speed, wake turbulence, and interference. A quad-rotor UAV drone can be quieter than another quad-rotor UAV drone with the same power if its rotors are arranged to reduce wake interaction. Therefore, acoustic optimization must be treated as a separate objective from power optimization, even though the two are coupled.
I also considered the effect of monitoring distance. The sound pressure level decreased with distance in all cases. However, the decrease was not the same for tonal and broadband components. Tonal noise remained identifiable at greater distances because it is concentrated at discrete frequencies. Broadband noise decreased more smoothly with distance because it is distributed over many frequencies. For UAV drones in urban environments, tonal noise may be more annoying even if its overall level is lower, because tonal components can be perceived as distinct and persistent. This suggests that noise reduction strategies should target both the overall sound pressure level and the tonal quality of the sound.
In my methodological assessment, the DES and FWH combination proved effective for the study of UAV drones rotor noise. DES captured the unsteady wake structures that are difficult to resolve with RANS, while FWH provided a computationally efficient way to predict far-field noise. The main challenge was the mesh resolution near the blade surfaces and in the wake. A coarse mesh may miss the small eddies that contribute to high-frequency broadband noise, while an overly fine mesh increases computational cost. I found that a graded mesh with refinement near the blade and in the rotor wake gave a good compromise. The DES length scale must also be chosen carefully so that the RANS-to-LES transition occurs in the right region. If the transition occurs too close to the wall, the boundary layer may be under-resolved. If it occurs too far away, the wake may be over-smoothed.
Another important methodological point is the acoustic integration surface. The FWH method requires pressure and velocity data on a surface that encloses the noise sources. If the surface is too close to the rotor, it may not capture all relevant sources. If it is too far, the data may be contaminated by numerical dissipation. I placed the integration surface outside the rotor wake but within the region where the flow data remained well resolved. I also used low-reflection boundaries to reduce spurious acoustic reflections. These details matter because the accuracy of far-field noise prediction depends strongly on the quality of the near-field input.
I now summarize the main design implications for UAV drones. First, rotor tip effects dominate both aerodynamic loading and noise generation. Blade tip shape, tip clearance, and tip vortex control are therefore high-value design variables. Second, rotor-rotor interaction in multi-rotor UAV drones is not a secondary effect; it changes both the wake structure and the acoustic directivity. Spacing, rotational direction, and phase synchronization should be co-optimized. Third, payload integration alters the wake and pressure field, which changes both noise and power consumption. Payload shape and attachment location should be considered as part of the acoustic design. Fourth, electric power is a useful but incomplete proxy for acoustic performance. A low-power design is not automatically quiet, and a quiet design is not automatically efficient. Multi-objective optimization is required.
The following table summarizes the trade-offs I observed among aerodynamics, acoustics, and electric power for UAV drones.
| Design variable | Aerodynamic effect | Acoustic effect | Power effect | Recommended direction |
|---|---|---|---|---|
| Higher rotational speed | More lift and thrust | Higher tonal frequency and higher noise | Higher power | Use only when required |
| Rotor spacing | Changes wake interaction | Can increase or decrease interference noise | Changes torque demand | Optimize for wake separation |
| Blade tip geometry | Affects tip vortex strength | Strong effect on broadband noise | Moderate effect | Prioritize tip noise control |
| Trailing-edge serrations | Small lift penalty possible | Reduces broadband noise | Small increase possible | Use for noise-sensitive missions |
| Payload shape | Changes drag and wake | Can amplify low-frequency noise | Increases torque and power | Streamline and shield payload |
| Payload location | Changes center of gravity and flow | Changes directivity | Changes rotor loading | Place to minimize wake interaction |
I also used the simulation data to evaluate the relationship between lift and electric power. For the single-rotor case, the ratio of lift to power is:
$$ \frac{L}{P} = \frac{6.362}{88.11} = 0.0722 \, \text{N/W} $$
For the quad-rotor case:
$$ \frac{L}{P} = \frac{24.547}{364.01} = 0.0674 \, \text{N/W} $$
For the quad-rotor with payload:
$$ \frac{L}{P} = \frac{25.835}{375.58} = 0.0688 \, \text{N/W} $$
These values show that the quad-rotor configuration produces more lift but at a slightly lower lift-to-power ratio than the single-rotor case. The payload case improves the ratio slightly relative to the unloaded quad-rotor, but this does not mean the payload is free of cost; it means that the additional lift is obtained with a relatively small additional power increment. This is a useful nuance for UAV drones design. The payload may be aerodynamically integrated in a way that actually improves the lift-to-power ratio compared with a poorly matched unloaded configuration. However, the absolute power still increases, so battery and thermal constraints remain important.
The noise-to-power ratio is also informative. I define a simple acoustic intensity indicator based on the first monitoring point:
$$ \eta_{ac} = \frac{L_p}{P} $$
For the single-rotor case:
$$ \eta_{ac} = \frac{77.8684}{88.11} = 0.8838 \, \text{dB/W} $$
For the quad-rotor case:
$$ \eta_{ac} = \frac{102.1790}{364.01} = 0.2807 \, \text{dB/W} $$
For the quad-rotor with payload:
$$ \eta_{ac} = \frac{103.8080}{375.58} = 0.2764 \, \text{dB/W} $$
This indicator suggests that the quad-rotor and payload cases produce more absolute noise but distribute it over much higher power. The single-rotor case has a higher dB/W value because it produces less lift and less total noise. This simple ratio is not a complete acoustic metric, but it illustrates why UAV drones noise must be evaluated together with mission requirements. A delivery UAV drone must carry a payload, so comparing it only with a single-rotor UAV drone is not enough. The relevant comparison is between different delivery configurations that can carry the same payload.
I further analyzed the spectral content using the blade-passing frequency. For a rotor with \(N_b\) blades rotating at angular velocity \(\Omega\), the blade-passing frequency is:
$$ f_{BPF} = \frac{N_b \Omega}{2\pi} $$
At 8500 RPM, \(\Omega = 890.12 \, \text{rad/s}\). If the rotor has two blades, the blade-passing frequency is approximately:
$$ f_{BPF} = \frac{2 \times 890.12}{2\pi} = 283.3 \, \text{Hz} $$
If the rotor has three blades, it is approximately:
$$ f_{BPF} = \frac{3 \times 890.12}{2\pi} = 425.0 \, \text{Hz} $$
These values help explain the tonal peaks in the spectra. The exact peak locations depend on the blade count and the rotational speed. In my simulations, the low-frequency tonal content was consistent with blade passage, while the higher-frequency content was more broadband and was associated with turbulence in the wake. This distinction is important for noise control because tonal noise and broadband noise respond differently to design changes. Tonal noise can be reduced by adjusting blade count, blade spacing, or phase synchronization. Broadband noise can be reduced by controlling tip vortices, wake turbulence, and surface roughness.
I also considered the effect of the cargo box on the acoustic directivity. The cargo box creates a nonsymmetric flow field, so the sound radiation is not symmetric. In the near field, the cargo box can act as a scattering surface, increasing sound pressure in some directions and decreasing it in others. In the far field, the directivity pattern becomes smoother, but the low-frequency content remains affected by the cargo wake. This suggests that payload integration should be evaluated not only by overall sound pressure level but also by directivity. A UAV drones delivery route may pass over sensitive receivers in specific directions, so the goal is to reduce noise in those directions rather than merely reduce the total sound power.
My findings also have implications for regulatory compliance. Noise regulations for UAV drones often specify limits at certain distances or in certain frequency bands. A configuration that meets an overall sound pressure limit may still exceed a tonal penalty if it has strong blade-passing harmonics. Therefore, I recommend that UAV drones noise assessments use both overall sound pressure level and tonal metrics. The simulations in this work provide a way to predict these metrics before flight testing. This can reduce the cost of compliance testing and allow designers to compare multiple rotor and payload configurations quickly.
In terms of computational workflow, I followed a sequence that can be adapted to other UAV drones studies. I first defined the rotor geometry and the computational domain. I then generated a mesh with refinement near the blade surfaces and in the expected wake region. I initialized the flow and ran the DES simulation until the lift and torque became statistically stable. I then extracted pressure and velocity data on the FWH integration surface and computed the far-field acoustic pressure at the monitoring points. Finally, I post-processed the results to obtain sound pressure levels, spectra, and directivity. This workflow is summarized in the following table.
| Step | Action | Purpose |
|---|---|---|
| 1 | Define geometry and operating conditions | Establish rotor configuration and RPM |
| 2 | Build mesh with local refinement | Resolve boundary layer and wake |
| 3 | Run DES flow simulation | Capture unsteady turbulence and forces |
| 4 | Monitor lift, torque, and residuals | Confirm convergence and stability |
| 5 | Extract FWH surface data | Prepare acoustic input |
| 6 | Compute far-field sound | Predict SPL and spectra |
| 7 | Post-process acoustic and power metrics | Evaluate design trade-offs |
I used the same general approach for the single-rotor, quad-rotor, and payload cases. This consistency is important because it allows me to compare results across configurations without changing the numerical methodology. The main difference was the addition of rotating domains and the inclusion of the cargo box geometry. For the quad-rotor case, I paid special attention to the relative rotation directions. In my setup, two rotors rotated clockwise and two rotated counterclockwise. This arrangement is common in quad-rotor UAV drones because it helps balance torque. The adjacent rotors rotated in opposite directions, which can influence wake interaction and noise interference. The diagonal rotors rotated in the same direction. This arrangement creates a complex but symmetric baseline flow field.
The cargo box broke the symmetry of the flow. This is a key reason why the payload case produced different acoustic results. The cargo box wake interacted with the rotor wakes, and the pressure field under the UAV drones changed. The lift increased because the presence of the cargo box may have altered the local flow and because the rotors had to generate more thrust to overcome additional drag and weight effects. The torque increased because the rotors had to work against the altered pressure field. The power increase of 3.17% is a quantitative measure of this additional effort. In my view, this is a useful benchmark for payload integration studies.
I also note that the acoustic results showed a decrease in far-field sound pressure level for the payload case at several monitoring points. This may seem counterintuitive because the payload adds a source of turbulence. However, acoustic scattering and interference can reduce sound in certain directions. The cargo box can reflect or diffract sound waves, and the altered wake can change the phase relationship between rotor noise sources. This means that a payload can, in some directions, act as a partial acoustic shield. This effect is frequency dependent. It is more likely at higher frequencies where the wavelength is comparable to the cargo dimensions. At lower frequencies, the cargo box is acoustically small, so it cannot effectively shield the sound. This explains why the low-frequency noise increased while some higher-frequency far-field levels decreased.
These observations lead me to several recommendations for quieter UAV drones. First, I recommend designing the rotor tips to reduce tip vortex strength. This can be done through blade tip sweep, tip rake, or winglet-like features. Second, I recommend optimizing rotor spacing and rotational direction to reduce wake merging. Third, I recommend integrating payloads with streamlined fairings and, where possible, using the payload as an acoustic shield for high-frequency noise. Fourth, I recommend using active or passive noise control on the blade trailing edge to reduce broadband noise. Fifth, I recommend using mission planning to avoid noise-sensitive areas and to choose altitudes that balance near-field and far-field exposure. These recommendations are qualitative, but they are grounded in the quantitative results of my simulations.
I also want to emphasize the limitations of my study. I analyzed a fixed rotational speed of 8500 RPM. Real UAV drones operate over a range of speeds during takeoff, cruise, hovering, and landing. Transient effects such as acceleration and maneuvering can change the noise and power characteristics. I also assumed a uniform atmospheric environment. In reality, wind, gusts, atmospheric turbulence, and urban obstacles can affect both aerodynamics and acoustics. I did not include ground reflection or building scattering in the acoustic prediction. These factors can be important in urban environments. Finally, I did not validate the simulations with wind-tunnel or flight-test data. Future work should include experimental validation to strengthen the reliability of the predictions.
Despite these limitations, my study provides a consistent framework for comparing UAV drones configurations. The DES-FWH approach captures the essential aerodynamic and acoustic physics. The electric power analysis connects the aerodynamic torque to the propulsion requirement. The case study on payload delivery shows how a practical mission modification can change both noise and power. This integrated perspective is valuable because UAV drones design is inherently multi-objective. A design that is optimal for lift may not be optimal for noise or energy efficiency. A design that is optimal for noise may not be optimal for payload capacity or range. Therefore, the best approach is to use simulation to explore the design space and identify configurations that satisfy multiple constraints.
The following table summarizes the main quantitative findings of my study.
| Metric | Single rotor | Quad rotor | Quad rotor with box |
|---|---|---|---|
| Lift (N) | 6.362 | 24.547 | 25.835 |
| Torque (N·m) | 0.099 | 0.409 | 0.422 |
| Electric power (W) | 88.11 | 364.01 | 375.58 |
| SPL at point 1 (dB) | 77.8684 | 102.1790 | 103.8080 |
| SPL at point 6 (dB) | 46.7105 | 74.7176 | 72.4137 |
| Lift-to-power ratio (N/W) | 0.0722 | 0.0674 | 0.0688 |
I also summarize the acoustic scaling behavior. If noise scaled exactly with the number of rotors, the quad-rotor sound pressure level would be about 6 dB higher than the single-rotor level for incoherent sources, or about 12 dB for coherent sources, depending on phase. My results show larger differences at some points and smaller differences at others. This confirms that rotor interference and directivity are significant. The following table shows a simple scaling comparison.
| Assumption | Expected SPL increase from one to four rotors | Observed trend |
|---|---|---|
| Incoherent addition | About 6 dB | Observed differences are larger and position-dependent |
| Coherent addition | About 12 dB | Some points approach this, but not all |
| Interference and shielding | Not a single value | Strong directivity and frequency dependence |
In my future work, I plan to extend the simulations to transient operating conditions. I want to study takeoff, hover, cruise, and landing because these phases may produce different noise signatures. I also want to include atmospheric turbulence and urban obstacles in the acoustic propagation model. This would make the predictions more relevant to real UAV drones operations. I also plan to validate the simulations with experimental measurements. A comparison between simulation and experiment would help identify where the DES-FWH framework needs refinement. Finally, I want to use optimization algorithms to search for rotor and payload configurations that minimize noise and power while maintaining lift. Multi-objective optimization could reveal non-intuitive designs that perform better than conventional configurations.
The following table outlines my proposed future work directions.
| Future direction | Objective | Expected benefit |
|---|---|---|
| Transient flight simulation | Capture takeoff, hover, cruise, landing | More realistic UAV drones noise prediction |
| Atmospheric turbulence modeling | Include wind and gusts | Better urban noise assessment |
| Urban obstacle scattering | Include buildings and ground reflection | More accurate community noise impact |
| Experimental validation | Compare with wind tunnel and flight tests | Increase confidence in DES-FWH |
| Multi-objective optimization | Optimize lift, noise, and power | Quieter and more efficient UAV drones |
| Machine learning surrogates | Reduce computational cost | Faster design iteration |
In conclusion, my study shows that the noise and electric power of UAV drones are tightly coupled to rotor aerodynamics, wake turbulence, and configuration. The single-rotor case provides a baseline with 88.11 W electric power and a relatively lower sound pressure level. The quad-rotor case produces much more lift and requires 364.01 W, with a higher and more complex acoustic field. The payload case increases lift to 25.835 N and electric power to 375.58 W, a 3.17% increase over the unloaded quad-rotor case. The acoustic results show that the payload increases near-field noise but can reduce far-field noise in some directions due to scattering and interference. These findings highlight the importance of integrated design for UAV drones. Quieter UAV drones cannot be achieved by focusing on a single component or a single metric. They require careful co-design of rotor geometry, rotor placement, payload integration, and mission planning. The DES-FWH framework used in this work provides a practical and accurate way to evaluate these trade-offs and to support the development of quieter, more efficient UAV drones for urban and commercial applications.