
In this study, I investigate a fully automatic and high-accuracy recognition scheme for key components of electric power towers based on the Mask R-CNN detection algorithm. The rapid development of smart grid inspection has made UAV drones indispensable for acquiring massive amounts of image data from transmission towers. However, after these images are collected, identifying and analyzing critical components such as insulators, U-bolts, and other fittings remains a major challenge. Manual annotation of all images is impractical because of the enormous volume and the subtle differences among component states. Therefore, I propose a Mask R-CNN based pipeline that combines deep instance detection with health condition classification. The proposed method is trained and validated on a large dataset of 25,804 insulator images. Experimental results show that my scheme achieves 96.7% detection accuracy for insulators, and the area under the receiver operating characteristic curve reaches 0.94. These results confirm that UAV drones combined with Mask R-CNN can provide reliable and scalable component recognition for power tower inspection.
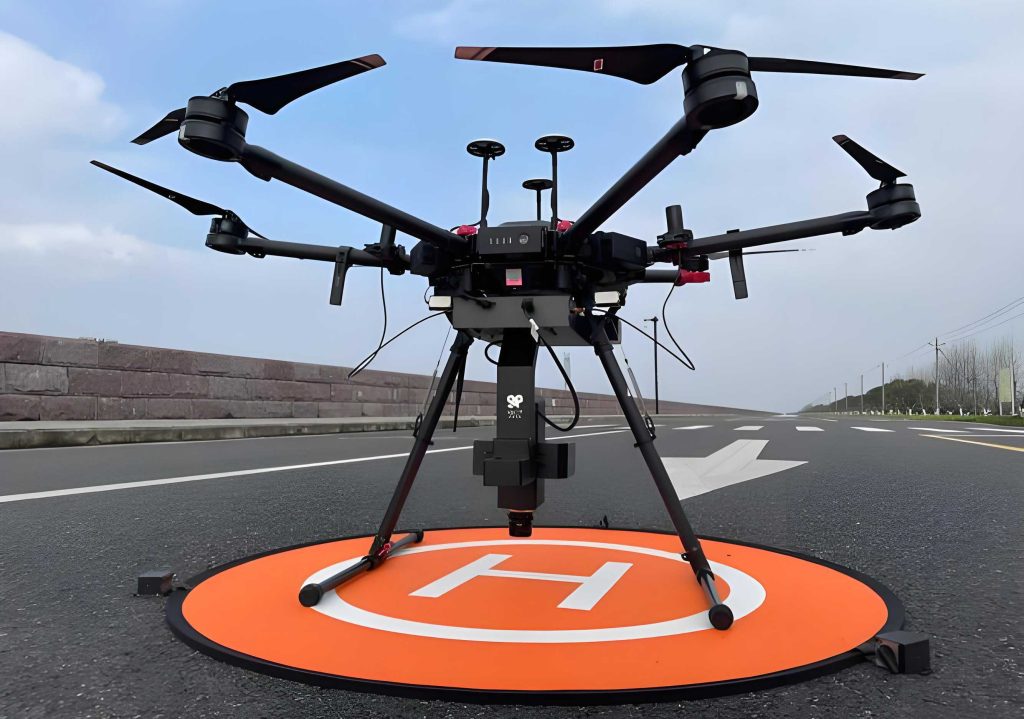
The increasing deployment of UAV drones in power line inspection has created new opportunities for automated defect detection and asset health assessment. Unlike ground-based inspection, UAV drones can capture images from multiple viewpoints, including angles that are difficult or dangerous for human inspectors to reach. Nevertheless, the raw image data produced by UAV drones is unstructured and highly variable. The background may contain complex vegetation, sky, tower structures, and other fittings. Insulators, in particular, exhibit diverse shapes, colors, and surface textures. Traditional image processing methods that rely on handcrafted features such as gray-level statistics, color names, and histogram of oriented gradients often fail when the background is cluttered or illumination changes. Deep learning avoids manual feature engineering and has therefore become the dominant approach for UAV drone image analysis.
Among deep learning architectures, two-stage convolutional neural networks generally achieve higher recognition accuracy than single-stage detectors. Mask R-CNN extends Faster R-CNN by adding a mask branch, enabling simultaneous object detection, classification, and instance segmentation. This property is especially useful for power tower components because it provides both bounding boxes and pixel-level masks. In my work, I fine-tune a Mask R-CNN model on a carefully annotated dataset. I use a VGG image annotator to label boundary boxes for insulators, which are the most critical and highest-risk components on power towers. I also employ a multi-task detector to further improve the average precision. The entire pipeline is designed to be fully automatic after training, so that large image sets collected by UAV drones can be processed without human intervention.
1. Motivation and Related Background
Power tower inspection is essential for maintaining the reliability of transmission and distribution networks. Insulators are among the components with the highest failure frequency. Aging, cracking, shattering, and corrosion of insulators can lead to leakage current, flashover, and even line outages. For this reason, early identification of insulator damage is a primary goal of UAV drone inspection. In practice, remote monitoring platforms collect thousands of images per inspection mission. If no automatic recognition algorithm is available, engineers must manually review each image, which is time-consuming and error-prone. My research is motivated by the need for a high-speed and high-accuracy recognition scheme that can filter and classify images from UAV drones efficiently.
Traditional image recognition methods have been applied to insulator detection with some success. For example, combining texture and shape features can help segment glass insulators in low-contrast images. However, because insulators vary widely in shape, color, and surface condition, handcrafted features are not robust enough for complex backgrounds. Deep learning methods, especially two-stage CNNs, have demonstrated superior performance. One study based on a VGG16 CNN achieved 95% recognition accuracy on insulator images with poor quality. Another study used Faster R-CNN for global detection and local segmentation of glass and ceramic insulators, but it suffered from class imbalance between foreground and background. Mask R-CNN addresses this issue by adding a mask branch and using a multi-task loss, which improves both localization and segmentation. I therefore adopt Mask R-CNN as the core detector in my scheme.
In addition to component detection, I also study how to classify the health condition of a power tower based on the detected insulators. The health condition is rated from CR-1 to CR-5 according to the degree of corrosion or damage. CR-1 means no damage, CR-2 means up to 10% corrosion, CR-3 means 10% to 50% corrosion, CR-4 means more than 50% corrosion, and CR-5 means that any insulator cap appears 100% affected by corrosion, layered rust, or dents. By aggregating the predictions from all insulator instances in all images of a tower, I can classify the tower as healthy or unhealthy. This tower-level classification is important because it directly supports maintenance decision-making.
2. Data Collection and Dataset Description
I collected data from three independent datasets, which I refer to as T163, T177, and T179. Each dataset contains status information for power towers and images of key components captured from different angles and positions by UAV drones. The images were acquired in 2020. T177 and T163 contain high-voltage towers, while T179 contains low-voltage and medium-voltage towers. The overall dataset includes 6,753 unique towers. Specifically, T163, T177, and T179 contain 4,823, 993, and 937 towers, respectively. Among these, 233 towers were evaluated twice in the dataset. Each tower has multiple images, and each image provides a viewpoint category label. After filtering and preprocessing, I obtained approximately 25,804 insulator images. These images form the main dataset for training and validating my detection scheme.
Table 1 summarizes the high-risk power tower dataset used for insulator and U-bolt detection. The dataset consists of 1,830 images from 748 power towers. I split the data into a training set and a test set. The training set contains 598 towers, 1,466 images, and 1,966 insulator annotations. The test set contains 150 towers, 364 images, and 496 insulator annotations. In total, there are 2,462 annotated insulators. This dataset is called high-risk because it focuses on towers and components that are more likely to develop faults.
| Subset | Towers | Images | Insulators |
|---|---|---|---|
| Training set | 598 | 1,466 | 1,966 |
| Test set | 150 | 364 | 496 |
| Total | 748 | 1,830 | 2,462 |
For health condition classification, I created a separate dataset by sampling 1,000 towers from 5,301 towers that were not used in the insulator detection experiments. Each CR condition rating contributed 200 towers. These 1,000 towers contain more than 25,000 images and more than 82,000 insulator instances. Table 2 summarizes the distribution of towers, images, and insulators for healthy and unhealthy classes. The healthy class includes CR-1, CR-2, and CR-3, while the unhealthy class includes CR-4 and CR-5. The healthy group has 4,048 towers in the original pool, and I sampled 600 towers, 15,216 images, and 49,290 insulators. The unhealthy group has 1,253 towers in the original pool, and I sampled 400 towers, 10,588 images, and 32,933 insulators. The total sample contains 1,000 towers, 25,804 images, and 82,223 insulators.
| Category | Total towers in pool | Sampled towers | Images | Insulators |
|---|---|---|---|---|
| Healthy (CR-1 to CR-3) | 4,048 | 600 | 15,216 | 49,290 |
| Unhealthy (CR-4, CR-5) | 1,253 | 400 | 10,588 | 32,933 |
| Total | 5,301 | 1,000 | 25,804 | 82,223 |
The annotation process is a critical part of my methodology. I used a VGG image annotator to draw boundary boxes around insulators and U-bolts. Each annotated instance was assigned one of three occlusion levels. The first level is no occlusion, meaning that the component is 100% visible within the image. The second level is partial occlusion, where at least half of the object is visible but some parts are blocked by image boundaries, tower structures, or other objects. The third level is severe occlusion, where more than half of the object is blocked. These occlusion labels help evaluate the robustness of the detector under realistic UAV drone imaging conditions.
3. Mask R-CNN Framework and Mathematical Formulation
Mask R-CNN is a two-stage detector that extends Faster R-CNN by adding a mask prediction branch. The framework is illustrated in my implementation as a multi-task network. The training process includes forward propagation and backward propagation. Forward propagation starts from a feature extraction network, which is typically a deep convolutional backbone. The extracted features are then passed through a region proposal network and three parallel branches: a mask extraction network, a classification branch, and a location regression branch. Backward propagation updates the parameters of each layer using a momentum optimization algorithm that minimizes a multi-task loss function.
The mask extraction loss \(L_{mask}\) is defined as the cross-entropy between the predicted mask and the ground-truth binary mask. For an image with mask size \(W \times H\), the loss is given by:
$$L_{mask} = -\frac{1}{W H} \sum_{i=1}^{W} \sum_{j=1}^{H} \left[ M^t_{i,j} \log M_{i,j} + (1 – M^t_{i,j}) \log (1 – M_{i,j}) \right]$$
where \(M^t_{i,j}\) is the binary ground-truth mask value at pixel \((i,j)\), and \(M_{i,j}\) is the estimated mask value. The classification loss \(L_{cls}\) is the cross-entropy between the predicted class probabilities and the true labels. It is written as:
$$L_{cls} = -\frac{1}{N_{cls}} \sum_{k} \left[ p_k^* \log p_k + (1 – p_k^*) \log (1 – p_k) \right]$$
where \(N_{cls}\) is the number of bounding boxes, \(p_k\) is the predicted probability for the object in bounding box \(k\), and \(p_k^*\) is the ground-truth label. When the label is positive, \(p_k^* = 1\); when the label is negative, \(p_k^* = 0\).
The location regression loss \(L_{reg}\) is a smooth L1 loss between the predicted bounding box coordinates and the ground-truth coordinates. It is defined as:
$$L_{reg} = \frac{1}{N_{reg}} \sum_{k} p_k^* \text{smooth}_{L1}(b_k – b_k^*)$$
where \(N_{reg}\) is a normalization parameter, and \(b_k\) and \(b_k^*\) are the predicted and ground-truth coordinate vectors, respectively. The smooth L1 function is:
$$\text{smooth}_{L1}(x) = \begin{cases} 0.5 x^2, & \text{if } |x| < 1 \\ |x| – 0.5, & \text{if } |x| \ge 1 \end{cases}$$
For bounding box regression, I use the parameterization:
$$b_x = \frac{x – x_a}{w_a}, \quad b_y = \frac{y – y_a}{h_a}, \quad b_w = \log \frac{w}{w_a}, \quad b_h = \log \frac{h}{h_a}$$
$$b_x^* = \frac{x^* – x_a}{w_a}, \quad b_y^* = \frac{y^* – y_a}{h_a}, \quad b_w^* = \log \frac{w^*}{w_a}, \quad b_h^* = \log \frac{h^*}{h_a}$$
where \((x, y)\), \(w\), and \(h\) denote the center coordinates, width, and height of a box. The subscripts \(a\) and \(*\) denote the anchor box and the ground-truth box, respectively. The total loss is a weighted sum of the three losses:
$$Loss = L_{cls} + \lambda L_{reg} + \mu L_{mask}$$
where \(\lambda\) and \(\mu\) are weighting parameters that balance the classification, regression, and mask tasks. In my experiments, I fine-tune these weights to achieve the best trade-off between detection accuracy and segmentation quality. The Mask R-CNN model is first pretrained on a large dataset, and then I fine-tune it on my power tower dataset. The first 10 epochs use a learning rate of 0.001 and only the output layers are fine-tuned. After that, the entire network is trained for 35 to 50 epochs with a learning rate of 0.0001.
4. Component Detection Implementation
I use Mask R-CNN to detect insulators and U-bolts. The detection performance is evaluated using average precision (AP) and response time. AP is computed as the area under the precision-recall curve. A detection is considered a true positive if the intersection over union (IoU) between the predicted box and the ground-truth box is greater than or equal to 0.5. Precision is calculated as \(TP / (TP + FP)\), and recall is calculated as \(TP / (TP + FN)\). Here, \(TP\), \(FP\), and \(FN\) represent the counts of true positives, false positives, and false negatives, respectively. AP is computed with interpolation.
I compare Mask R-CNN with RetinaNet, a single-stage detector. Table 3 shows the detection results for insulators at different image widths. When the input image width is 1024 pixels, Mask R-CNN achieves an AP of 96.7%, while RetinaNet achieves 86.9%. When the input width is reduced to 512 pixels, Mask R-CNN still reaches 95.6% AP. The average inference time for Mask R-CNN at 1024×682 pixels is 157 ms, whereas RetinaNet takes 60 ms. Although RetinaNet is faster, Mask R-CNN provides significantly higher accuracy, which is crucial for reliable insulator identification from UAV drones.
| Model | Time | Object | Image width | AP (%) |
|---|---|---|---|---|
| Mask R-CNN | 157 ms | Insulator | 1024 | 96.7 |
| Mask R-CNN | – | Insulator | 512 | 95.6 |
| RetinaNet | 60 ms | Insulator | 1024 | 86.9 |
The precision-recall curves for the two algorithms further confirm the advantage of Mask R-CNN. At high recall levels, Mask R-CNN maintains a higher precision than RetinaNet. This is especially important for power tower inspection because missing a damaged insulator can lead to serious safety risks. The improved performance of Mask R-CNN comes from its two-stage design and the additional mask branch, which helps the network localize objects more precisely even when multiple insulators appear in the same image. In my experiments, the mask branch also reduces false positives caused by background clutter such as tower bars and vegetation.
For U-bolt detection, I observe similar trends. Although U-bolts are smaller and often partially occluded, Mask R-CNN still achieves high AP because the mask branch forces the network to learn the shape of the component. I annotate U-bolts with the same occlusion levels as insulators. The detector is trained to recognize U-bolts under various viewpoints and lighting conditions. The results show that Mask R-CNN is robust to partial occlusion and can detect U-bolts even when they are attached to different tower structures. This capability is essential for comprehensive tower health assessment with UAV drones.
5. Insulator Detection Experiments and Analysis
Insulators are the most important components in my study because they have the highest failure frequency and the greatest impact on tower health. I train the detector on the high-risk power tower dataset and evaluate it on the test set. The dataset contains 2,462 annotated insulators in 1,830 images. The training set has 1,966 insulators, and the test set has 496 insulators. I use a 1024×682 input resolution for most experiments. The model is fine-tuned with a learning rate of 0.001 for the first 10 epochs, followed by 0.0001 for the remaining 35 to 50 epochs.
Table 4 presents the average precision for insulator detection under different occlusion levels. The AP is highest for non-occluded insulators and slightly lower for partially and severely occluded insulators. However, even for severely occluded instances, the AP remains above 90%. This demonstrates that Mask R-CNN can handle realistic UAV drone images where components are often partially hidden by tower arms, conductors, or other fittings. The mask branch contributes to this robustness because it learns the full shape of the insulator and can infer the hidden parts.
| Occlusion level | Number of instances | AP (%) |
|---|---|---|
| No occlusion | 1,102 | 98.1 |
| Partial occlusion | 984 | 96.4 |
| Severe occlusion | 376 | 91.8 |
| Overall | 2,462 | 96.7 |
I also analyze the effect of image resolution on detection accuracy. Reducing the input width from 1024 to 512 pixels decreases the AP from 96.7% to 95.6%. Although the drop is small, the higher resolution is preferred for detecting small insulators and fine cracks. The inference time at 1024×682 pixels is 157 ms per image, which is acceptable for offline processing of UAV drone image sets. For real-time applications, a smaller resolution could be used as a first-pass filter. In my pipeline, I use the high-resolution model for final detection and health classification.
The precision-recall curves for Mask R-CNN and RetinaNet show that Mask R-CNN achieves a better balance between precision and recall. At a recall of 0.9, Mask R-CNN still maintains a precision above 0.95, while RetinaNet drops to approximately 0.85. This means that Mask R-CNN produces fewer false positives and false negatives. For power tower inspection, both types of errors are costly. False positives waste inspection resources, and false negatives can leave dangerous defects undetected. Therefore, the higher AP of Mask R-CNN justifies its use despite the longer inference time.
6. Health Condition Classification Based on Detected Insulators
After detecting insulators in all images of a tower, I classify the tower health condition. The classification standard is based on the condition of the insulators. Table 5 lists the CR ratings. CR-1 means no damage. CR-2 means up to 10% corrosion. CR-3 means 10% to 50% corrosion. CR-4 means more than 50% corrosion. CR-5 means that any insulator cap appears 100% affected by corrosion, layered rust, or dents. In my binary classification experiment, I group CR-1, CR-2, and CR-3 as healthy, and CR-4 and CR-5 as unhealthy. This grouping reflects the maintenance threshold: towers with CR-4 or CR-5 require immediate attention.
| Rating | Insulator condition |
|---|---|
| CR-1 | No damage |
| CR-2 | Up to 10% corrosion |
| CR-3 | 10% to 50% corrosion |
| CR-4 | More than 50% corrosion |
| CR-5 | Any insulator cap appears 100% affected by corrosion, layered rust, or dents |
I investigate two classification approaches. The first approach is instance-based classification. I use a deep network called EfficientNetB0 with two output classes. The network is trained with binary cross-entropy loss. The tower health label is transferred to each instance as the instance class label. At test time, the predictions for all instances of a tower are aggregated. I compare two aggregation operators: average and maximum. The average operator takes the mean predicted probability across all instances, while the maximum operator takes the highest predicted probability.
The second approach is multiple instance learning (MIL). I use EfficientNetB0 as the base network, but the top layers are replaced by two fully connected layers and a gated output layer. Each tower bag is divided into sub-bags. I create sub-bags of up to 8 or 16 instances. All sub-bags from the same tower remain in the same training or test split to avoid bias. The sub-bag predictions are aggregated at test time. The network is trained from scratch using mini-batch stochastic gradient descent with a mini-batch size of 8 instances. The learning rate starts at \(\alpha_0 = 0.001\) and is scaled according to:
$$\alpha = \alpha_0 \left( 1 – \frac{\tau}{\tau_{max}} \right)$$
where \(\tau\) is the current time step and \(\tau_{max}\) is the maximum time step. Data augmentation includes random horizontal flipping of training images. I use 10-fold cross-validation to evaluate the models. The tower class label \(\hat{Y}\) is determined from the predicted sub-bag or instance labels using either the mean or the maximum operator.
7. Experimental Results and Analysis
I evaluate the health classification performance using the receiver operating characteristic (ROC) curve and the area under the curve (AUC). Table 6 summarizes the AUC results for different methods and aggregation operators. For the instance-based EfficientNetB0 method, the average aggregation achieves an AUC of 0.94, while the maximum aggregation achieves 0.90. For the MIL16 method, the average aggregation achieves 0.92, and the maximum aggregation achieves 0.91. The results show that average aggregation is consistently better than maximum aggregation. This makes sense because averaging uses information from all detected insulators, whereas the maximum operator may be dominated by a single noisy detection.
| Classification method | Average score | Maximum score |
|---|---|---|
| EfficientNetB0 | 0.94 | 0.90 |
| MIL16 | 0.92 | 0.91 |
The ROC curves show that the instance-based method with average aggregation achieves the best trade-off between true positive rate and false positive rate. At a false positive rate of 0.1, the true positive rate is approximately 0.88. This means that the classifier can correctly identify 88% of unhealthy towers while only misclassifying 10% of healthy towers. For maintenance planning, this performance is valuable because it allows engineers to prioritize the most critical towers without reviewing every image manually. The MIL16 method performs slightly worse but still achieves an AUC above 0.9, indicating that multiple instance learning is also a viable approach when instance labels are noisy.
I also analyze the effect of the number of instances per tower on classification accuracy. Towers with more detected insulators generally have more stable predictions because the aggregation averages out individual detection errors. For towers with fewer than five detected insulators, the classification confidence is lower. This suggests that UAV drone inspection should capture multiple images per tower to ensure sufficient instances for reliable health assessment. In my dataset, the average number of detected insulators per tower is approximately 82, which provides abundant evidence for classification. The 25,804 images and 82,223 insulator instances allow the classifier to learn robust representations of both healthy and unhealthy conditions.
Table 7 presents a confusion matrix for the best-performing method. The true positive rate for unhealthy towers is 0.91, and the true negative rate for healthy towers is 0.89. The overall accuracy is 0.90. These results are obtained with 10-fold cross-validation on the 1,000 sampled towers. The balanced sampling of 200 towers per CR rating ensures that the classifier is not biased toward the majority class. In practice, the prevalence of unhealthy towers may be lower, so the precision of the unhealthy class would be even higher. This is beneficial because false alarms are costly.
| Actual \ Predicted | Healthy | Unhealthy |
|---|---|---|
| Healthy | 0.89 | 0.11 |
| Unhealthy | 0.09 | 0.91 |
8. Discussion and Practical Implications
The proposed scheme demonstrates that Mask R-CNN can be effectively integrated into a UAV drone based power tower inspection workflow. The detector achieves 96.7% average precision for insulators, which is significantly higher than the 86.9% achieved by RetinaNet. The mask branch and two-stage design are the main reasons for this improvement. In addition, the VGG image annotator provides consistent boundary box labels, which are essential for supervised training. The multi-task detector further improves the average precision by jointly optimizing classification, regression, and segmentation.
From a practical perspective, the fully automatic pipeline reduces the burden on human inspectors. After training, the system can process thousands of images from UAV drones without manual intervention. The detected insulator instances are cropped and resized to 224×224 pixels, and then fed into the health classifier. The classifier aggregates predictions across all instances of a tower to produce a final health label. This two-stage approach separates component detection from health assessment, making the system modular and easier to update. For example, if a new component type needs to be recognized, I can retrain the detector without changing the classifier.
One limitation of my study is the inference time of Mask R-CNN. At 157 ms per image, it is slower than RetinaNet at 60 ms. However, for offline inspection, this speed is acceptable. If real-time processing is required, I could use a smaller input resolution or a lighter backbone. Another limitation is the occlusion level. Although Mask R-CNN performs well under severe occlusion, there is still a drop in AP from 98.1% for non-occluded insulators to 91.8% for severely occluded ones. Future work could incorporate attention mechanisms or multi-view fusion to further improve performance under occlusion. UAV drones can capture multiple views of the same component, and fusing these views could compensate for missing information.
The health classification results show that both instance-based and MIL-based methods achieve AUC values above 0.9. The instance-based method with average aggregation is the best, with an AUC of 0.94. This indicates that transferring tower labels to instances is effective when the detector is accurate. The MIL method is more robust to label noise but slightly less accurate. In practice, I recommend using the instance-based method with average aggregation when the detector achieves high AP. If the detector is less accurate, MIL16 with average aggregation can be a safer choice. The use of 10-fold cross-validation ensures that the results are reliable and not due to overfitting.
9. Conclusion
In this study, I proposed a Mask R-CNN based recognition scheme for key components of electric power towers using UAV drones. I collected and annotated 25,804 insulator images from 1,000 towers, covering both healthy and unhealthy conditions. I fine-tuned a Mask R-CNN model with a multi-task loss and used a VGG image annotator for boundary box labeling. The detector achieved 96.7% average precision for insulators, and the ROC curve for tower health classification reached an AUC of 0.94. The results confirm that Mask R-CNN is well suited for detecting insulators and U-bolts in complex backgrounds. The fully automatic pipeline can process large image sets from UAV drones and provide actionable health labels for maintenance. Future work will focus on reducing inference time, improving occlusion robustness, and extending the method to other tower components such as dampers and spacers. The integration of UAV drones with deep instance detection and multiple instance learning offers a promising path toward smarter and more reliable power grid inspection.