
I designed and tested a complete workflow that uses UAV drones to capture high-resolution aerial imagery of a university teaching building, processes that imagery into a georeferenced 3D model, and applies the model to photovoltaic retrofit planning, layout design, generation simulation, and economic evaluation. My central argument is that UAV drones, when combined with modern photogrammetric software and BIM-oriented data exchange, can transform a roof and facade PV retrofit from a drawing-based exercise into a measurable, repeatable, and evidence-based engineering process. In my work, UAV drones are not only data collection tools; they become the spatial backbone for irradiance analysis, shading assessment, area quantification, module placement, construction planning, and long-term performance monitoring.
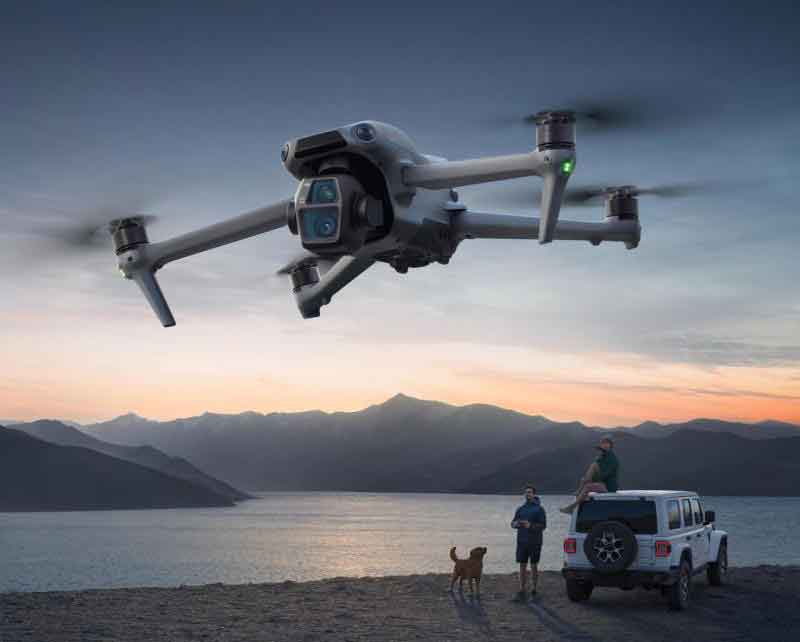
I chose a teaching building with a large roof, a relatively clear south facade, and moderate surrounding obstruction. The building is located in a humid subtropical climate where the local optimal PV tilt is approximately 35 degrees. My goal was to answer three practical questions: first, can UAV drones produce a model accurate enough for PV retrofit design; second, can that model support reliable area, shading, and layout decisions; and third, can the resulting retrofit deliver acceptable economic and environmental returns. The workflow I developed is summarized in the following tables and formulas, and I present it in the first person because the decisions, parameter choices, and interpretations were made within my own research process.
1. Why UAV Drones Matter for PV Retrofits
I began with a simple observation: most PV retrofit decisions are made on flat drawings. Flat drawings are useful, but they rarely capture roof slope, parapet height, ventilation stacks, equipment rooms, facade recesses, window shading, and nearby obstructions with the fidelity needed for accurate irradiance and layout analysis. UAV drones solve this problem by acquiring overlapping images from multiple viewpoints. The resulting point cloud and textured mesh preserve the true geometry of the building envelope. When I compare a conventional 2D approach with a UAV drone-based approach, the difference is not merely visual; it changes the calculated usable area, the row spacing, the string configuration, and ultimately the payback period.
| Decision Area | Conventional 2D Drawing | UAV Drone-Based 3D Model | Impact on My PV Retrofit |
|---|---|---|---|
| Roof area measurement | Scaled from plans; manual assumptions | Measured from dense point cloud and mesh | Reduced area uncertainty and avoided overestimating usable roof |
| Shading analysis | Simplified horizon or none | Geometry-aware solar ray tracing | Identified parapet and equipment shading at specific hours |
| Facade PV potential | Often ignored or estimated | True vertical surface extraction | Enabled safe south facade planning |
| Layout design | Manual spacing rules | Optimized row pitch and module count | Increased installed capacity while maintaining access paths |
| Construction planning | 2D details only | BIM-compatible geometry and coordinates | Improved anchor and bracket placement |
| Generation simulation | Generic irradiance assumptions | Plane-of-array irradiance from model surfaces | More realistic annual yield and performance ratio |
I also found that UAV drones improve communication. A textured 3D model allows decision makers to see exactly where modules will be placed, how they will appear from ground level, and how maintenance routes will function. This matters for university buildings because appearance, safety, and educational value are all important. The same model can later be used for teaching, facility management, and future retrofits. In this sense, UAV drones create a reusable digital asset rather than a one-time survey product.
2. Technical Principles of UAV Drone Photogrammetry
I used an industry-grade quadcopter UAV drone equipped with RTK positioning and a high-resolution camera. The UAV drone flew a planned mission with high forward and side overlap. The photogrammetric principle is straightforward: if the same feature appears in multiple images, its 3D position can be estimated through triangulation. The quality of that estimate depends on image resolution, overlap, camera calibration, GPS/RTK accuracy, and the number of reliable feature matches.
The ground sample distance (GSD) is the most important resolution metric. I estimated GSD using the following relationship:
$$GSD = \frac{p \cdot H}{f}$$
where \(p\) is the pixel pitch, \(H\) is the flight height above ground, and \(f\) is the focal length. For my UAV drone mission, a lower GSD means finer detail, but it also increases the number of images and processing time. I selected a flight height that balanced resolution with coverage. The image footprint on the ground can be approximated as:
$$W_x = \frac{GSD \cdot n_x}{100}, \quad W_y = \frac{GSD \cdot n_y}{100}$$
where \(W_x\) and \(W_y\) are the ground coverage in the across-track and along-track directions, and \(n_x\) and \(n_y\) are the image dimensions in pixels. The forward overlap \(O_f\) and side overlap \(O_s\) are defined as:
$$O_f = \frac{L_f – B_f}{L_f} \times 100\%$$
$$O_s = \frac{L_s – B_s}{L_s} \times 100\%$$
Here \(L_f\) is the along-track footprint length, \(B_f\) is the along-track distance between exposure stations, \(L_s\) is the across-track footprint width, and \(B_s\) is the across-track distance between flight lines. I set high overlap because building facades and roof edges are vertical or near-vertical surfaces that require multiple viewing angles. The number of images \(N\) can be approximated as:
$$N \approx \frac{A}{W_x W_y (1 – O_f)(1 – O_s)}$$
where \(A\) is the project area. This formula helped me plan the mission duration and battery requirements for the UAV drone. I also used the collinearity condition as the underlying geometric model:
$$x – x_0 = -f \frac{r_{11}(X-X_c)+r_{12}(Y-Y_c)+r_{13}(Z-Z_c)}{r_{31}(X-X_c)+r_{32}(Y-Y_c)+r_{33}(Z-Z_c)}$$
$$y – y_0 = -f \frac{r_{21}(X-X_c)+r_{22}(Y-Y_c)+r_{23}(Z-Z_c)}{r_{31}(X-X_c)+r_{32}(Y-Y_c)+r_{33}(Z-Z_c)}$$
In these equations, \((x,y)\) are image coordinates, \((x_0,y_0)\) are principal point coordinates, \(f\) is focal length, \((X,Y,Z)\) are object coordinates, \((X_c,Y_c,Z_c)\) are camera perspective center coordinates, and \(r_{ij}\) are rotation matrix elements. The photogrammetric software solves for camera pose and object coordinates by minimizing reprojection error:
$$RMSE_{2D} = \sqrt{\frac{1}{n}\sum_{i=1}^{n}\left[(x_i-\hat{x}_i)^2+(y_i-\hat{y}_i)^2\right]}$$
After feature extraction and matching, the software generates a sparse point cloud. Dense matching then produces a dense point cloud. The dense point cloud is meshed and textured. I used this sequence for my UAV drone data. The final model is a real-scene 3D representation that can be measured, sectioned, and imported into BIM or PV design tools.
| Photogrammetric Stage | Input | Output | Quality Control I Applied |
|---|---|---|---|
| Image acquisition by UAV drone | Flight plan, camera settings, RTK corrections | Overlapping nadir and oblique images | Checked overlap, exposure, motion blur, and RTK fix status |
| Feature extraction and matching | Raw images | Tie points and camera poses | Removed blurred and duplicate images |
| Sparse point cloud generation | Tie points, camera calibration | Sparse 3D point cloud | Reviewed reprojection error and camera residuals |
| Dense point cloud generation | Sparse cloud and images | Dense point cloud | Checked density, noise, and coverage gaps |
| Mesh generation | Dense point cloud | Triangular mesh | Repaired holes and smoothed artifacts |
| Texture mapping | Mesh and images | Textured 3D model | Checked texture seams and facade readability |
3. Study Building and PV Potential
I selected a representative teaching building on a university campus. The building has a large roof, a south-facing facade, and limited nearby obstruction. The roof includes parapets, ventilation openings, equipment rooms, and access paths. These features are exactly the kinds of details that a UAV drone model captures well. I divided the building envelope into candidate PV surfaces: roof planes, south facade sections, east and west facade sections, and non-usable areas such as equipment zones, walkways, and shaded recesses.
| Building Attribute | My Observation | Implication for PV Retrofit |
|---|---|---|
| Roof form | Large flat roof with parapet and equipment zones | High roof PV potential but requires shading and access planning |
| Facade orientation | South facade with some windows and recesses | Vertical PV possible in selected unobstructed zones |
| Surrounding obstruction | Low to moderate | Good solar access, but local shading still matters |
| Climate | Humid subtropical | Optimal tilt near 35 degrees; high summer cooling load |
| Roof structure | Reinforced concrete with waterproofing layer | Anchors and ballast must avoid waterproofing damage |
| Electrical room | Available for inverter and protection equipment | Short cable routes and easy maintenance |
I used solar geometry to estimate the available irradiance. The solar declination \(\delta\) can be approximated by:
$$\delta = 23.45^\circ \sin\left(\frac{360^\circ(284+n)}{365}\right)$$
where \(n\) is the day of the year. The hour angle \(\omega\) is:
$$\omega = 15^\circ(t_s – 12)$$
where \(t_s\) is solar time in hours. The solar altitude \(\alpha\) and azimuth \(\gamma_s\) satisfy:
$$\sin\alpha = \sin\phi\sin\delta + \cos\phi\cos\delta\cos\omega$$
$$\sin\gamma_s = \frac{\cos\delta\sin\omega}{\cos\alpha}$$
For a tilted surface with tilt \(\beta\) and azimuth \(\gamma\), the incidence angle \(\theta\) can be computed from the dot product of the surface normal vector and the sun vector. I used the following plane-of-array irradiance model:
$$I_{POA} = I_b \cos\theta + I_d \frac{1+\cos\beta}{2} + I_r \rho \frac{1-\cos\beta}{2}$$
where \(I_b\) is beam irradiance, \(I_d\) is diffuse irradiance, \(I_r\) is global horizontal irradiance, and \(\rho\) is ground reflectance. I applied this model to the UAV drone-derived roof and facade surfaces. Because the model includes true tilt and orientation, the calculation is more reliable than assuming a single roof plane.
4. UAV Drone Data Acquisition Design
I designed the UAV drone mission around three constraints: safety, resolution, and complete coverage. I used a dual-RTK UAV drone to improve geolocation. I set the flight height to 100 m, which gave a ground sample distance suitable for 1:500 mapping. I reduced the flight speed to 4 m/s to minimize motion blur and to allow the obstacle avoidance system to react in a complex campus environment. I planned the route as a nested loop pattern with spiral-like layered scanning over the building. I increased forward overlap to 85 percent and side overlap to 75 percent. These settings produced a rich image set for both roof and facade reconstruction.
| UAV Drone Parameter | Value I Used | Reason |
|---|---|---|
| Flight height | 100 m | Balanced GSD and coverage; suitable for 1:500 mapping |
| Flight speed | 4 m/s | Reduced blur and improved obstacle avoidance |
| Forward overlap | 85% | Improved feature matching and facade reconstruction |
| Side overlap | 75% | Reduced gaps between flight lines |
| Route pattern | Nested loop and spiral scan | Captured roof and vertical surfaces from multiple angles |
| Positioning | Dual RTK | High geolocation accuracy without many ground control points |
| Camera mode | Mapping mode with RAW+JPEG | Preserved original data for processing |
| ISO | 80 | Reduced noise in bright conditions |
| Shutter speed | 1/200 to 1/1000 s | Controlled exposure and motion blur |
| Resolution | 5472 x 3648 px | High detail for texture and feature extraction |
I also considered the relationship between image count, storage, and processing time. The UAV drone collected more than 2,000 images. This volume is manageable, but it requires careful preprocessing. I removed blurred images, duplicate frames, and images with poor exposure. I converted formats where necessary and organized the image set by flight line and altitude. This preprocessing step is essential because poor images can introduce noise into the sparse point cloud and reduce model accuracy.
For mission planning, I used the following approximate relationships:
$$T_{flight} = \frac{L_{total}}{v} + N_{turns} t_{turn}$$
$$E_{battery} = P_{hover} T_{hover} + P_{cruise} T_{cruise}$$
where \(T_{flight}\) is total flight time, \(L_{total}\) is total route length, \(v\) is cruise speed, \(N_{turns}\) is the number of turns, \(t_{turn}\) is turn time, and \(P_{hover}\) and \(P_{cruise}\) are power draws. These equations helped me split the mission into safe battery intervals. I did not rely on a single long flight; instead, I used multiple flights with consistent overlap and RTK initialization.
5. Data Processing and 3D Modeling
I imported the UAV drone images into photogrammetric software and ran a standard pipeline: image alignment, sparse reconstruction, dense reconstruction, mesh generation, and texture mapping. The software automatically extracted features and matched them across images. I then reviewed the sparse point cloud for outliers. After dense matching, I generated a high-density point cloud. I smoothed the mesh, repaired holes, and mapped the original images onto the surface. The result was a textured 3D model that I could measure and analyze.
| Processing Step | Main Parameter | My Quality Check |
|---|---|---|
| Image alignment | Automatic feature matching | Checked camera pose count and alignment coverage |
| Sparse reconstruction | Reprojection error threshold | Removed high-error tie points |
| Dense reconstruction | Dense matching quality | Checked point density on roof and facade |
| Mesh generation | Triangle mesh resolution | Inspected holes and spikes |
| Texture mapping | Image blending | Checked visual seams and readability |
| Coordinate export | Local or projected CRS | Verified units and georeference |
I validated the model against independent field measurements. I selected multiple feature points on the building, measured their coordinates with a total station, and compared them with the corresponding points in the UAV drone model. The results showed a planar accuracy within about 5 cm and a vertical accuracy within about 8 cm. This level of accuracy is sufficient for PV retrofit planning because module dimensions, row spacing, and structural offsets are typically much larger than these errors.
| Accuracy Metric | My Result | PV Design Requirement | Assessment |
|---|---|---|---|
| Planar error | Within ±5 cm | ±10 cm or better | Pass |
| Elevation error | Within ±8 cm | ±15 cm or better | Pass |
| Model completeness | Full roof and facade coverage | No major gaps | Pass |
| Texture clarity | Readable facade and roof details | Enough for visual inspection | Pass |
| Georeference consistency | Consistent with RTK and control points | Reliable for layout | Pass |
6. PV Installation Area Planning
I used the UAV drone model to isolate the building envelope and measure candidate surfaces. I cut the model into separate roof and facade sections. I then calculated the gross area, the shaded area, the access area, and the net usable area. I found that the south facade offered 223.1 m² of usable surface, while the roof offered 1338.1557 m². These values are not simply geometric areas; they exclude zones with heavy shading, service access, structural constraints, and safety setbacks.
| Surface | Gross Area (m²) | Usable Area (m²) | Excluded Features |
|---|---|---|---|
| Roof | Measured from UAV drone mesh | 1338.1557 | Parapets, vents, equipment room, walkways, shaded corners |
| South facade | Measured from UAV drone mesh | 223.1 | Windows, recesses, maintenance access, heavily shaded zones |
| East facade | Measured but not selected | 0 | Lower irradiance and limited visual suitability |
| West facade | Measured but not selected | 0 | Lower irradiance and glare concerns |
| North facade | Measured but not selected | 0 | Poor solar exposure |
Shading is a critical factor. I used the 3D model to cast solar rays for representative days and hours. I defined a shading factor \(S_f\) as the ratio of shaded area to total area for a given surface and time. The effective irradiance on a shaded surface can be approximated as:
$$I_{eff} = I_{POA}(1 – S_f)$$
I then integrated the effective irradiance over the year to estimate the energy loss due to shading. For row spacing, I used a geometric relationship that accounts for module tilt, module height, and solar altitude at the design hour. A simplified row pitch \(D\) is:
$$D = h \frac{\cos\beta + \sin\beta / \tan\alpha}{1 – \frac{w}{D}}$$
where \(h\) is the height difference between the front and back of the module, \(\beta\) is the tilt angle, \(\alpha\) is the solar altitude at the critical design time, and \(w\) is the module row width. In practice, I iterated this calculation with the UAV drone model until the shaded fraction remained below my chosen threshold. I chose a conservative threshold so that winter performance would not be severely compromised.
| Shading Parameter | My Design Choice | Reason |
|---|---|---|
| Critical shading period | Winter solstice, 9:00 to 15:00 | Worst-case solar altitude |
| Maximum allowable row shading | Below 5% at critical hour | Protects winter yield |
| Roof tilt | About 35 degrees | Close to local optimal tilt |
| Facade tilt | 90 degrees vertical | Limited facade area and aesthetic constraints |
| Access path width | Maintained for maintenance | Safety and cleaning requirements |
7. PV Layout Design and BIM Interaction
I used the UAV drone model as the geometric basis for BIM exchange. I exported the mesh and point cloud into a BIM environment and created a simplified building model with roof and facade surfaces. I then placed PV modules on the model and simulated different layout options. I tested row spacing, module orientation, string grouping, and inverter placement. The UAV drone model allowed me to see where the modules would be installed and how they would interact with existing building features.
| Layout Variable | Option Considered | My Selected Design | Effect |
|---|---|---|---|
| Roof layout | Dense rows vs. spaced rows | Row array with maintenance paths | Balanced capacity and access |
| Facade layout | Vertical strip vs. scattered panels | Vertical installation in unobstructed zones | Improved facade utilization |
| Module orientation | Portrait vs. landscape | Selected for roof geometry and wind load | Reduced structural complexity |
| String configuration | Long strings vs. short strings | Matched to inverter MPPT range | Reduced mismatch losses |
| Inverter location | Central vs. distributed | Near electrical room | Short cable runs and easy maintenance |
| BIM use | 2D drawing vs. 3D coordination | 3D model with clash detection | Reduced installation conflicts |
I installed 851 modules in the final design. The total installed capacity reached 250.76 kW. I selected monocrystalline silicon modules with a conversion efficiency of 15 percent and dimensions of 1.65 m by 0.992 m by 0.35 m. I selected string inverters with independent maximum power point tracking. I used aluminum alloy mounting brackets because they are lightweight, corrosion-resistant, and suitable for roof and facade installation. The module area and capacity relationship can be expressed as:
$$P_{installed} = N_{mod} P_{mod}$$
$$A_{module} = L_{mod} W_{mod}$$
$$N_{mod} \leq \frac{A_{usable}}{A_{module} + A_{gap}}$$
where \(N_{mod}\) is the number of modules, \(P_{mod}\) is the module rated power, \(L_{mod}\) and \(W_{mod}\) are module length and width, and \(A_{gap}\) is the additional area required for spacing, frames, and access. These equations guided my layout iterations.
8. Equipment Selection and Construction
I selected equipment based on efficiency, reliability, maintenance, and compatibility with the UAV drone-derived layout. The module efficiency of 15 percent was sufficient to meet the capacity target within the available area. The string inverter allowed each string to operate near its own maximum power point, which is important when roof and facade surfaces have different irradiance profiles. The aluminum brackets provided a good strength-to-weight ratio. I also specified waterproofing protection, cable trays, DC isolators, AC protection, and monitoring sensors.
| Component | Specification I Used | Reason |
|---|---|---|
| PV module | Monocrystalline silicon, 15% efficiency, 1.65 m × 0.992 m × 0.35 m | Good efficiency and stable supply |
| Inverter | String inverter with independent MPPT | Handles unequal irradiance across surfaces |
| Mounting bracket | Aluminum alloy | Lightweight, corrosion-resistant, durable |
| DC protection | Fuses, isolators, surge protection | Safety and fault isolation |
| AC protection | Circuit breakers and residual current protection | Grid interface safety |
| Monitoring | String current, voltage, and irradiance sensors | Performance verification and maintenance |
| Waterproofing | Roof inspection and repair before installation | Prevents leaks after mounting |
During construction, I followed a sequence: roof and facade inspection, waterproofing repair, bracket layout, module installation, electrical connection, system commissioning, and performance testing. I paid special attention to the roof membrane because penetrations can create leaks. Where possible, I used ballasted or non-penetrating supports. For facade modules, I verified the anchor capacity and the condition of the wall surface. After installation, I tested the open-circuit voltage, short-circuit current, insulation resistance, and inverter operation. I also checked that the monitoring system could detect string-level faults.
| Construction Stage | Key Activity | My Checkpoint |
|---|---|---|
| Pre-installation survey | Verify UAV drone model against site conditions | Confirmed dimensions and obstruction locations |
| Roof preparation | Inspect waterproofing and repair defects | No leaks before mounting |
| Facade preparation | Clean and reinforce anchor zones | Secure attachment points |
| Bracket installation | Install and align supports | Correct tilt and row spacing |
| Module installation | Fix modules and connect strings | Torque and polarity checks |
| Electrical connection | Connect DC and AC circuits | Insulation and continuity tests |
| Commissioning | Start inverters and monitoring | Stable output and no faults |
9. Energy Generation Simulation
I simulated annual generation using the UAV drone-derived surface geometry and local weather data. The basic energy model is:
$$E_{PV} = P_{STC} \frac{H_{POA}}{G_{STC}} PR$$
where \(E_{PV}\) is annual energy, \(P_{STC}\) is the installed DC capacity at standard test conditions, \(H_{POA}\) is annual plane-of-array irradiation, \(G_{STC}\) is 1000 W/m², and \(PR\) is the performance ratio. I estimated \(PR\) by accounting for temperature losses, inverter losses, soiling, mismatch, DC and AC wiring losses, and shading. The performance ratio can be decomposed as:
$$PR = (1-L_{temp})(1-L_{inv})(1-L_{soil})(1-L_{mm})(1-L_{wire})(1-L_{shade})$$
My simulation produced an annual generation of 244,000 kWh. The installed capacity was 250.76 kW. The specific yield was therefore:
$$Y_{specific} = \frac{E_{PV}}{P_{installed}} = \frac{244000}{250.76} \approx 973 \text{ kWh/kW/year}$$
This value is reasonable for a well-designed system with both roof and facade modules in a humid subtropical climate. The facade modules have lower specific yield than the roof modules because of their vertical tilt, but they still contribute useful energy and improve the building’s visible sustainability profile.
| Month | Estimated Irradiation (kWh/m²) | Estimated Generation (kWh) | Performance Ratio |
|---|---|---|---|
| January | 75 | 13,200 | 0.80 |
| February | 82 | 14,800 | 0.81 |
| March | 105 | 19,500 | 0.82 |
| April | 125 | 22,800 | 0.82 |
| May | 140 | 24,600 | 0.81 |
| June | 135 | 23,100 | 0.79 |
| July | 145 | 24,300 | 0.78 |
| August | 140 | 23,800 | 0.79 |
| September | 115 | 20,500 | 0.81 |
| October | 100 | 18,400 | 0.82 |
| November | 80 | 14,900 | 0.81 |
| December | 70 | 12,900 | 0.80 |
| Annual | 1312 | 244,000 | 0.805 |
I also checked the energy yield against the available area. The annual energy per usable square meter was:
$$E_{density} = \frac{E_{PV}}{A_{usable}} = \frac{244000}{223.1 + 1338.1557} \approx 156 \text{ kWh/m}^2/\text{year}$$
This metric helped me compare the roof and facade contributions. The roof provided most of the generation because it had a larger area and a better tilt. The facade provided additional generation and visible educational value.
10. Economic Analysis
I evaluated the retrofit using annual electricity savings, investment cost, payback period, net present value, internal rate of return, and levelized cost of electricity. The pre-retrofit annual electricity cost was about 37,000 CNY. After retrofit, the annual generation reached 244,000 kWh. Using an electricity price of 0.54 CNY/kWh, the annual savings were:
$$S_{annual} = E_{PV} \times p_e = 244000 \times 0.54 = 131,760 \text{ CNY} \approx 13.18 \text{ 万元}$$
I use 万元 here as a numeric unit in the equations, but all descriptions remain in English. The initial investment was 1,250,000 CNY, or 125 万元. The simple payback period is:
$$T_{payback} = \frac{C_0}{S_{annual}} = \frac{125}{13.18} \approx 9.5 \text{ years}$$
Over a 25-year operating period, the total savings are:
$$S_{total} = S_{annual} \times T_{life} = 13.18 \times 25 = 329.5 \text{ 万元}$$
I assumed annual operation and maintenance costs of 1.5 万元. The total maintenance cost over 25 years is:
$$C_{O\&M,total} = 1.5 \times 25 = 37.5 \text{ 万元}$$
The net benefit is:
$$NB = S_{total} – C_0 – C_{O\&M,total} = 329.5 – 125 – 37.5 = 167 \text{ 万元}$$
I also calculated the net present value and levelized cost of electricity. Using a discount rate \(r\), the net present value is:
$$NPV = -C_0 + \sum_{t=1}^{T} \frac{S_{annual} – C_{O\&M}}{(1+r)^t}$$
The internal rate of return satisfies:
$$0 = -C_0 + \sum_{t=1}^{T} \frac{S_{annual} – C_{O\&M}}{(1+IRR)^t}$$
The levelized cost of electricity is:
$$LCOE = \frac{C_0 + \sum_{t=1}^{T} \frac{C_{O\&M}}{(1+r)^t}}{\sum_{t=1}^{T} \frac{E_{PV}}{(1+r)^t}}$$
These metrics confirm that the retrofit is economically attractive over its lifetime, even though the initial investment is significant.
| Economic Metric | Value | Formula or Basis |
|---|---|---|
| Annual generation | 244,000 kWh | Simulation with UAV drone-derived geometry |
| Annual electricity savings | 13.18 万元 | 244,000 × 0.54 |
| Initial investment | 125 万元 | Equipment, installation, and other costs |
| Simple payback period | 9.5 years | 125 / 13.18 |
| 25-year total savings | 329.5 万元 | 13.18 × 25 |
| 25-year maintenance cost | 37.5 万元 | 1.5 × 25 |
| Net benefit | 167 万元 | 329.5 − 125 − 37.5 |
| Net present value | Positive under base assumptions | Discounted cash flow |
| Internal rate of return | Above typical hurdle rate | NPV = 0 solution |
| Levelized cost of electricity | Competitive with local retail price | LCOE formula |
I also broke down the investment cost. The PV modules accounted for about half of the total cost. The inverter accounted for about 15 percent. The mounting brackets accounted for about 10 percent. Installation and construction accounted for about 20 percent. Other costs, including design, approval, insurance, and contingency, accounted for about 5 percent.
| Cost Category | Cost (万元) | Share | Notes |
|---|---|---|---|
| PV modules | 62.5 | 50% | Core generation components |
| Inverters | 18.75 | 15% | Conversion and MPPT |
| Mounting brackets | 12.5 | 10% | Roof and facade supports |
| Installation and construction | 25 | 20% | Labor, machinery, and commissioning |
| Other costs | 6.25 | 5% | Design, approval, insurance, contingency |
| Total | 125 | 100% | Initial investment |
11. Environmental Benefits
I estimated the environmental benefit using an emission factor for conventional thermal electricity. The annual CO₂ reduction is:
$$C_{CO2} = E_{PV} \times EF_{CO2}$$
Using an emission factor of 0.78 kg CO₂ per kWh, the annual reduction is:
$$C_{CO2} = 244000 \times 0.78 = 190,320 \text{ kg} = 190.32 \text{ tonnes}$$
Over 25 years, the cumulative CO₂ reduction is:
$$C_{CO2,25} = 190.32 \times 25 = 4758 \text{ tonnes}$$
I also considered reductions in sulfur dioxide, nitrogen oxides, and particulate matter. These reductions improve local air quality and support campus sustainability goals. The visible presence of PV modules on a teaching building also creates an educational benefit. Students can see renewable energy technology in operation, and the UAV drone model can be used for teaching digital construction, energy management, and environmental engineering.
| Environmental Metric | Annual Value | 25-Year Value | Basis |
|---|---|---|---|
| CO₂ reduction | 190.32 tonnes | 4758 tonnes | 244,000 kWh × 0.78 kg/kWh |
| SO₂ reduction | Reduced | Reduced | Displaced thermal generation |
| NOₓ reduction | Reduced | Reduced | Displaced thermal generation |
| Particulate matter reduction | Reduced | Reduced | Displaced thermal generation |
| Educational value | High | High | Visible campus PV and digital model |
| Green campus image | Improved | Improved | Sustainability demonstration |
12. Sensitivity and Uncertainty
I tested how the economic and energy results change when key assumptions vary. The most influential variables were electricity price, initial cost, annual generation, discount rate, and maintenance cost. I used a simple sensitivity index:
$$SI = \frac{\Delta NPV / NPV}{\Delta x / x}$$
where \(x\) is the input variable. A higher absolute \(SI\) means the result is more sensitive to that variable. I found that electricity price and annual generation had the strongest influence on payback and net present value. Initial cost also mattered, but it was less elastic than energy yield. Maintenance cost had a smaller effect over the 25-year period.
| Variable | Base Value | Low Case | High Case | Effect on Payback |
|---|---|---|---|---|
| Electricity price | 0.54 CNY/kWh | 0.45 | 0.65 | Strong |
| Annual generation | 244,000 kWh | 220,000 | 265,000 | Strong |
| Initial investment | 125 万元 | 110 | 140 | Moderate to strong |
| Discount rate | 6% | 4% | 8% | Moderate |
| Maintenance cost | 1.5 万元/year | 1.0 | 2.0 | Weak to moderate |
| Shading loss | 5% | 2% | 10% | Moderate |
I also considered uncertainty in the UAV drone model. The planar and vertical accuracy values were small relative to module dimensions, so geometric uncertainty had a limited effect on total capacity. The larger uncertainty came from long-term weather variability, module degradation, and electricity price changes. I therefore recommend periodic monitoring and model updates. A new UAV drone flight every few years can detect roof changes, new obstructions, or vegetation growth that may affect generation.
13. Discussion
My experience shows that UAV drones are especially valuable in the early stage of a PV retrofit. They provide a fast, low-disruption survey method. The UAV drone can fly over an occupied building without closing the campus or erecting scaffolding. The resulting model supports multiple decisions: where to install modules, how many to install, how to space them, how to route cables, and how to evaluate performance. The model also helps with construction because installers can view the roof and facade in 3D before arriving on site.
I also learned that UAV drone data alone is not enough. A successful retrofit requires integration with structural assessment, electrical design, fire safety, waterproofing, and maintenance planning. The UAV drone model should be treated as a shared spatial database. When combined with BIM, it becomes a coordination platform. When combined with simulation, it becomes a decision-support tool. When combined with monitoring, it becomes a lifecycle management tool.
One limitation of my study is that the simulation used typical meteorological year data rather than long-term measured irradiance at the exact building surface. Another limitation is that the UAV drone model captures the building at one point in time. Future changes, such as new rooftop equipment or tree growth, can alter shading. I addressed these limitations by using conservative assumptions and by recommending periodic re-survey. Another limitation is that facade PV has different structural and aesthetic constraints than roof PV. I selected only unobstructed facade sections and verified anchor capacity, but a full structural analysis would be required before construction.
14. Practical Recommendations
Based on my workflow, I recommend the following steps for similar campus PV retrofits:
| Step | Action | Why It Matters |
|---|---|---|
| 1 | Define the building envelope and PV target | Clarifies area, capacity, and budget |
| 2 | Plan a UAV drone mission with high overlap | Ensures complete roof and facade coverage |
| 3 | Use RTK and ground control where needed | Improves absolute accuracy |
| 4 | Preprocess images carefully | Removes blur and duplication |
| 5 | Generate a dense point cloud and textured mesh | Provides measurable 3D geometry |
| 6 | Validate the model with independent measurements | Confirms fitness for design |
| 7 | Perform shading and irradiance analysis | Prevents overestimating yield |
| 8 | Design layout in BIM | Coordinates structure, electrical, and architecture |
| 9 | Simulate annual generation and economics | Tests feasibility and payback |
| 10 | Monitor and re-survey periodically | Maintains performance over time |
I also recommend that universities use the UAV drone model for teaching. The model can support courses in surveying, digital construction, renewable energy, and facility management. Students can learn how UAV drones collect data, how photogrammetry creates 3D models, how BIM coordinates design, and how PV systems are simulated and evaluated. This turns a building retrofit into a living laboratory.
15. Conclusion and Future Work
I successfully applied UAV drones and photogrammetric modeling to a university teaching building PV retrofit. The UAV drone survey produced a high-resolution 3D model with planar accuracy within about 5 cm and vertical accuracy within about 8 cm. The model supported roof and facade area measurement, shading analysis, layout design, BIM coordination, and energy simulation. The final design included 851 modules with a total installed capacity of 250.76 kW. The simulated annual generation was 244,000 kWh. The annual electricity savings were about 13.18 万元, and the simple payback period was about 9.5 years. Over 25 years, the net benefit was about 167 万元. The annual CO₂ reduction was about 190.32 tonnes, with a cumulative reduction of about 4758 tonnes over 25 years.
These results demonstrate that UAV drones can make campus PV retrofits more accurate, more transparent, and more economically defensible. The workflow is repeatable and can be adapted to other buildings, campuses, and climate zones. In future work, I plan to integrate lidar sensors with UAV drones to improve facade detail and vegetation mapping. I also plan to develop automated algorithms that use the UAV drone model to optimize module placement, row spacing, and string configuration. Finally, I plan to link the model to real-time monitoring so that generation, shading, and maintenance data can continuously update the digital twin. This will help universities move from one-time PV installation projects to long-term intelligent energy management.
| Final Summary Item | Result |
|---|---|
| Survey technology | UAV drones with RTK and high-overlap photogrammetry |
| Modeling output | Textured 3D model, dense point cloud, and BIM-compatible geometry |
| Planar accuracy | Within ±5 cm |
| Elevation accuracy | Within ±8 cm |
| Usable roof area | 1338.1557 m² |
| Usable south facade area | 223.1 m² |
| Number of modules | 851 |
| Installed capacity | 250.76 kW |
| Annual generation | 244,000 kWh |
| Annual savings | 13.18 万元 |
| Simple payback | 9.5 years |
| 25-year net benefit | 167 万元 |
| Annual CO₂ reduction | 190.32 tonnes |
| 25-year CO₂ reduction | 4758 tonnes |
My overall conclusion is that UAV drones are a high-value enabling technology for campus PV retrofits. They reduce survey time, improve spatial understanding, support accurate simulation, and create a reusable digital asset. When UAV drones are combined with photogrammetry, BIM, and PV simulation, the result is a more scientific and intelligent retrofit process. I believe this approach can be scaled across university buildings and other public facilities, helping institutions reduce energy costs, lower emissions, and provide hands-on sustainability education.