
1. Introduction
Forest ecosystems play a pivotal role in regulating the global carbon cycle, maintaining biodiversity, and supporting regional ecological security. Accurate information on tree species composition and quantity is indispensable for sustainable forest management, carbon stock estimation, and ecological monitoring. In recent years, the rapid development of unmanned aerial vehicles (UAVs) has revolutionized the acquisition of high-resolution remote sensing data, enabling individual-tree-level analysis from low-altitude optical imagery. Compared with traditional field surveys and satellite remote sensing, unmanned aerial vehicles offer a cost-effective and flexible platform for acquiring fine-grained RGB images, especially in complex forest environments.
However, tree species recognition from UAV optical images remains challenging due to several factors: (1) tree crowns occupy a wide range of scales within a single image, from small isolated saplings to large mature canopies; (2) dense forest stands cause severe crown overlap and mutual occlusion; (3) background clutters such as shadows, grassland, and bare soil introduce substantial noise; and (4) inter-class differences among some tree species are subtle. These difficulties demand a detection model capable of extracting multi-scale features, focusing on discriminative regions, and adapting to complex contextual information.
The YOLO family of object detectors has become one of the most widely adopted approaches for real-time detection tasks due to its excellent trade-off between speed and accuracy. Among them, YOLOv8 introduces several architectural innovations, including the C2f module, an anchor-free decoupled head, and improved feature fusion mechanisms, making it a promising baseline for UAV-based forestry applications. Nevertheless, the standard YOLOv8n still suffers from insufficient multi-scale representation and limited feature selection ability when applied to highly cluttered forest scenes.
To address these limitations, this study proposes an improved YOLOv8n model incorporating two novel modules: the Convolutional Multi-Scale Enhancement Attention module (CMEA) and the Dynamic Pooling Synergy Attention module (DPSA). CMEA enhances multi-scale feature extraction by parallel branches with different receptive fields and combines channel and spatial attention to suppress background interference. DPSA strengthens feature selection through dynamically weighted pooling and multi-scale dilated convolutions, thereby improving the model’s ability to handle dense canopy areas and long-range context. Furthermore, a composite loss function MDF-Loss is designed to combine classification loss, discriminative feature constraints, and attention regularization, improving feature separability and training stability.
The main contributions of this work are as follows:
– We construct a high-quality UAV tree crown image dataset containing five common tree species (pine, spruce, poplar, elm, and ash) with balanced annotations.
– We design the CMEA module and the DPSA module and integrate them into YOLOv8n to improve multi-scale representation and adaptive feature selection.
– We propose a composite loss function that jointly optimizes classification, feature-space discriminability, and attention smoothness.
– We conduct extensive experiments showing that the improved model achieves 92.1% mAP@0.5, a 4.1% improvement over the baseline, while maintaining real-time inference speed.
– We demonstrate the counting capability of the improved model and implement a fully functional web-based tree species recognition and counting system.
2. Related Work
2.1 Tree Species Recognition Based on Remote Sensing
Traditional tree species recognition relied on hyperspectral imagery and LiDAR data. Hyperspectral sensors capture continuous spectral signatures, but they are expensive and sensitive to environmental conditions. LiDAR provides 3D structural information, yet its high cost and limited point density hinder large-scale application. UAV-based RGB optical images offer an appealing alternative because they are cheap, easy to acquire, and provide rich texture and shape information. Recent studies have adopted convolutional neural networks (CNNs) to classify tree species from UAV imagery, achieving promising results. However, many methods focus on local patches or single-leaf images, which cannot handle the complexity of overlapping crowns in dense forests.
2.2 Deep Learning Object Detection
Object detection methods can be divided into two-stage detectors and one-stage detectors. Two-stage detectors such as Faster R-CNN first generate region proposals and then perform classification and regression, achieving high accuracy but with high computational cost. One-stage detectors such as the YOLO family directly predict categories and bounding boxes from feature maps, offering significant speed advantages. YOLOv8, the latest iteration, adopts an anchor-free design with a decoupled detection head and C2f backbone, which effectively balances accuracy and inference speed. Despite its strengths, YOLOv8n still lacks dedicated mechanisms for handling extreme scale variations and background clutter commonly encountered in UAV forest imagery.
2.3 Multi-Scale and Attention Mechanisms
Multi-scale feature learning is crucial for detecting objects with large scale variance. Feature pyramid networks (FPN) and multi-scale convolution kernels are widely used to aggregate features from different levels. Attention mechanisms, including channel attention and spatial attention, enable networks to emphasize informative features and suppress irrelevant responses. Recent advances combine multi-scale dilated convolutions and dynamic pooling to enlarge receptive fields and improve context modeling. Nevertheless, few studies systematically integrate these techniques into YOLOv8n for tree species counting in complex UAV images. This paper fills that gap by introducing CMEA and DPSA modules that jointly enhance multi-scale representation and dynamic feature selection.
3. Proposed Method
3.1 Dataset Construction and Preprocessing
The dataset used in this study was collected in a representative mixed coniferous and broadleaf forest in northeastern China. A multi-rotor unmanned aerial vehicle equipped with a high-resolution RGB camera was flown at an altitude of approximately 80 meters. The flight plan was designed with 80% frontal overlap and 75% side overlap to ensure complete coverage and stereo reconstruction. Image acquisition was performed during 14:00–17:00 local time under clear weather conditions to minimize shadow interference. Ground surveys were simultaneously carried out to record the species and locations of individual trees, providing reliable reference labels.
From the collected aerial video, frames were extracted at a rate of three frames per second, yielding 4,283 images. Structural similarity (SSIM) filtering was employed to remove duplicate and blurred images, resulting in 3,256 unique images. Data augmentation techniques including random horizontal flipping, brightness adjustment, scaling, and Mosaic augmentation expanded the dataset to 6,200 images. The augmented dataset contains a total of 60,244 labeled instances, with each class comprising approximately 19–21% of the total labels. Table 1 shows the label distribution for each species.
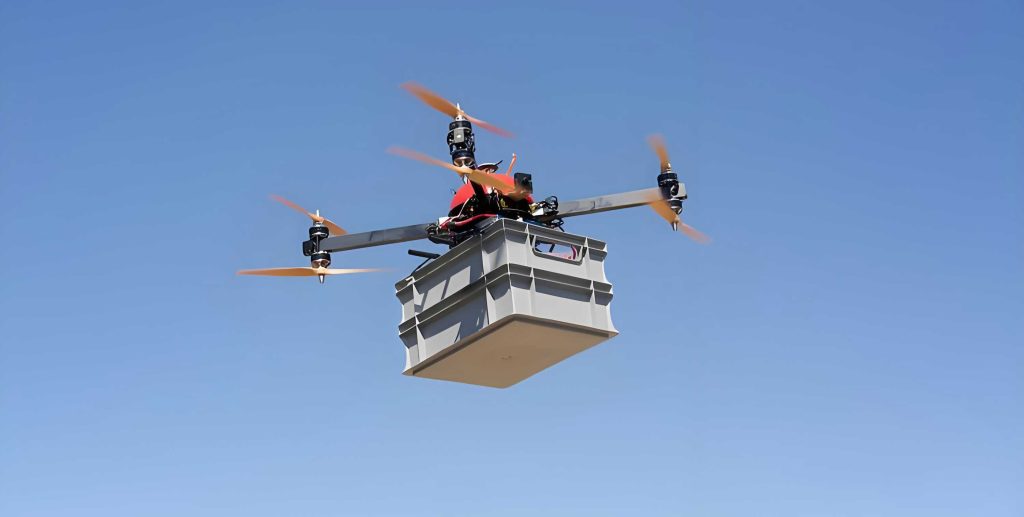
Table 1: Number of labels for each tree species in the dataset
| Species | Number of Labels | Percentage (%) |
|———|——————|—————-|
| Pine | 12,651 | 21.0 |
| Spruce | 12,049 | 20.0 |
| Poplar | 12,049 | 20.0 |
| Elm | 11,748 | 19.5 |
| Ash | 11,747 | 19.5 |
| Total | 60,244 | 100 |
All images were manually annotated using the LabelImg tool. The annotations include class IDs and normalized bounding box coordinates in YOLO format. The dataset was randomly split into training, validation, and test sets with a ratio of 8:1:1, resulting in 4,960 training images, 620 validation images, and 620 test images. This split preserves class balance and ensures reliable evaluation.
3.2 CMEA: Convolutional Multi-Scale Enhancement Attention
To improve the model’s ability to recognize tree crowns of varying sizes, we design the CMEA module, shown below. The module contains four parallel branches of depthwise separable convolutions with kernel sizes 3×3, 5×5, 7×7, and 9×9. These branches capture features at different receptive fields. The outputs are concatenated and fused through a 1×1 convolution. Then, channel attention and spatial attention are applied to reweight the fused feature maps, enhancing important channels and spatial positions while suppressing background noise.
The computational complexity of a depthwise separable convolution is:
$$\mathcal{O}(C \cdot k^2 \cdot H \cdot W)$$
where \(C\) is the number of channels, \(k\) is the kernel size, and \(H \times W\) is the spatial resolution. Compared with standard convolution, this significantly reduces parameters while preserving multi-scale representation capability.
Let \(X \in \mathbb{R}^{C \times H \times W}\) be the input feature map. The multi-scale branch outputs are:
$$X_k = \mathrm{DWConv}(X, k), \quad k \in \{3,5,7,9\}$$
The fused feature is:
$$X_{\mathrm{fused}} = \mathrm{Conv}_{1\times1}\left( \sum_k X_k \right)$$
Channel attention is computed using both average-pooled and max-pooled features:
$$F_{\mathrm{avg}} = \frac{1}{HW}\sum_{i,j} X_{\mathrm{fused}}(i,j)$$
$$F_{\mathrm{max}} = \max_{i,j} X_{\mathrm{fused}}(i,j)$$
$$F_{\mathrm{ca}} = \sigma(\mathrm{MLP}(F_{\mathrm{avg}}) + \mathrm{MLP}(F_{\mathrm{max}}))$$
$$X_{\mathrm{ca}} = F_{\mathrm{ca}} \odot X_{\mathrm{fused}}$$
Spatial attention is then generated from channel-refined features:
$$F_{\mathrm{sa}} = \sigma(\mathrm{Conv}([\mathrm{AvgPool}(X_{\mathrm{ca}}); \mathrm{MaxPool}(X_{\mathrm{ca}})]))$$
$$X_{\mathrm{out}} = F_{\mathrm{sa}} \odot X_{\mathrm{ca}}$$
This mechanism effectively expands the receptive field set to \(\mathcal{R} = \{R_3, R_5, R_7, R_9\}\), where \(R_k = k\) for a single layer, enabling simultaneous extraction of local textures and global structural information.
3.3 DPSA: Dynamic Pooling Synergy Attention
The DPSA module is designed to improve feature selection in the neck network. Traditional attention modules rely on fixed pooling operations (average or max), which may not be optimal for all input distributions. DPSA introduces a dynamic weighted pooling that combines average pooling and max pooling with a learnable weight:
$$\mathrm{mix}(X) = \alpha \cdot \mathrm{Avg}(X) + (1-\alpha) \cdot \mathrm{Max}(X)$$
where \(\alpha = \sigma(WX)\) is learned during training. The dynamic weight \(\alpha\) allows the network to adaptively choose the most informative statistical measure for each channel.
The channel attention is generated by fusing average-pooled, max-pooled, and dynamically pooled features:
$$F_{\mathrm{ca}} = \sigma(F_{\mathrm{avg}} + F_{\mathrm{max}} + F_{\mathrm{mix}})$$
The refined feature map is then passed through multi-scale dilated convolutions with dilation rates 1, 3, 5, and 7 to enlarge the receptive field without decreasing spatial resolution:
$$X_{d_i} = \mathrm{Conv}_{d=i}(X_{\mathrm{ca}}), \quad i \in \{1,3,5,7\}$$
$$X_{\mathrm{msdc}} = \mathrm{Conv}\left( \mathrm{Concat}(X_{d_1}, X_{d_3}, X_{d_5}, X_{d_7}) \right)$$
Finally, spatial attention is applied similarly to CMEA, producing the output feature map. The DPSA module improves global context modeling and helps distinguish denser canopy regions.
3.4 Overall Network Architecture
The improved YOLOv8n network integrates CMEA in the backbone after the second C2f block, and DPSA in the neck before the detection heads. This arrangement allows the backbone to extract richer multi-scale representations, while the neck enhances feature selection and context aggregation. The complete architecture is illustrated conceptually as:
– Input: 640×640 RGB image
– Backbone: Conv, C2f, CMEA, Conv, C2f, DPSA, SPPF
– Neck: FPN + PAN with DPSA inserted at the top-down and bottom-up fusion paths
– Head: Decoupled anchor-free detection head producing class probabilities and bounding boxes
The improved model is named YOLOv8n-CMEA-DPSA. With MDF-Loss as the objective function, the model achieves 92.1% mAP@0.5 on the test set.
3.5 Loss Function Design
To optimize the improved network, we propose a composite loss function termed MDF-Loss, which consists of three parts: basic classification loss, discriminative feature constraints, and attention regularization.
The base classification loss is the standard cross-entropy loss:
$$\mathcal{L}_{\mathrm{cls}} = -\frac{1}{N}\sum_{i=1}^{N} \log \hat{p}_{i, y_i}$$
where \(\hat{p}_{i, y_i}\) is the predicted probability of the true class \(y_i\).
To enhance feature separability, we add intra-class compactness loss and inter-class separation loss:
$$\mathcal{L}_{\mathrm{intra}} = \frac{1}{N}\sum_{i=1}^{N} \| h_i – \mu_{y_i} \|^2$$
$$\mathcal{L}_{\mathrm{inter}} = \sum_{a,b} \max\left(0, m – \|\mu_a – \mu_b\| \right)^2$$
where \(h_i\) is the feature embedding from the penultimate layer, \(\mu_c\) is the class center of class \(c\), and \(m\) is a margin hyperparameter. The discriminative loss is:
$$\mathcal{L}_{\mathrm{disc}} = \mathcal{L}_{\mathrm{intra}} + \beta \mathcal{L}_{\mathrm{inter}}$$
For attention smoothness, we apply L2 regularization on the attention weights:
$$\mathcal{L}_{\mathrm{att}} = \| W_c \|^2 + \| W_s \|^2$$
The total loss is:
$$\mathcal{L} = \mathcal{L}_{\mathrm{cls}} + \lambda_1 \mathcal{L}_{\mathrm{disc}} + \lambda_2 \mathcal{L}_{\mathrm{att}}$$
In our experiments, we set \(\beta = 0.5\), \(\lambda_1 = 0.1\), and \(\lambda_2 = 0.01\). This composite loss encourages both accurate prediction and well-structured feature distributions, while preventing attention weights from becoming overly sparse or unstable.
4. Experiments
4.1 Experimental Setup
All experiments were conducted on a Windows 11 machine with an NVIDIA GeForce RTX 4060 Laptop GPU (8 GB VRAM). The deep learning framework was PyTorch 2.0 with Python 3.10. Input images were resized to 640×640 pixels. The initial learning rate was 0.01 with stochastic gradient descent (SGD) optimization. The batch size was set to 4, and the model was trained for 200 epochs. All hyperparameters were kept identical for fair comparison between models.
Evaluation metrics include Precision (P), Recall (R), mean Average Precision at IoU threshold 0.5 (mAP@0.5), and the averaged mAP across IoU thresholds from 0.5 to 0.95 (mAP@0.5:0.95). Definitions are:
$$P = \frac{TP}{TP + FP}, \quad R = \frac{TP}{TP + FN}$$
$$AP = \int_0^1 P(R) \, dR$$
$$mAP = \frac{1}{C}\sum_{c=1}^{C} AP_c$$
4.2 Comparison with Different Object Detection Algorithms
We compared the proposed YOLOv8n-CMEA-DPSA with several mainstream detectors: Faster R-CNN, SSD, YOLOv5s, YOLOv7, RT-DETR-R18, and the baseline YOLOv8n. Results are reported in Table 2.
Table 2: Performance comparison of different object detection models
| Model | Params (M) | FPS | Precision (%) | Recall (%) | mAP@0.5 (%) | mAP@0.5:0.95 (%) |
|——————————|————|——|—————-|————-|————-|——————-|
| Faster R-CNN | 41.2 | 42 | 79.34 | 76.82 | 82.15 | 55.73 |
| SSD | 23.5 | 91 | 81.27 | 78.94 | 84.63 | 57.48 |
| YOLOv5s | 7.2 | 154 | 84.11 | 82.37 | 86.75 | 59.64 |
| YOLOv7 | 6.1 | 168 | 85.43 | 83.28 | 87.42 | 60.91 |
| RT-DETR-R18 | 20.5 | 72 | 87.15 | 84.92 | 88.63 | 62.87 |
| YOLOv8n (baseline) | 3.2 | 187 | 86.52 | 84.37 | 88.00 | 62.13 |
| **YOLOv8n-CMEA-DPSA** | 3.8 | 160 | **91.42** | **89.26** | **91.24** | **66.84** |
We can observe that the proposed model achieves the highest precision, recall, mAP@0.5, and mAP@0.5:0.95 among all methods, while maintaining a competitive FPS of 160. The FPS drop compared to baseline is only 27 frames/s, which is acceptable for real-time UAV applications. Two-stage detector Faster R-CNN is slow and yields the lowest mAP. Transformer-based RT-DETR-R18 performs better but has a much higher parameter count and lower speed.
4.3 Comparison of Different Attention and Multi-Scale Structures
To validate the effectiveness of CMEA and DPSA, we compared them with several widely-used attention mechanisms incorporated at the same positions. Table 3 lists the results.
Table 3: Performance comparison of different feature enhancement strategies
| Model | Precision (%) | Recall (%) | mAP@0.5 (%) | mAP@0.5:0.95 (%) |
|—————————-|—————|————|————-|——————-|
| YOLOv8n | 86.52 | 84.37 | 88.00 | 62.13 |
| + SE | 87.01 | 85.21 | 89.05 | 63.12 |
| + CBAM | 87.38 | 85.67 | 89.43 | 63.75 |
| + ECA | 87.89 | 86.04 | 89.83 | 64.01 |
| + CA (Coordinate Attention) | 88.16 | 86.22 | 90.12 | 64.38 |
| + ASFF | 88.74 | 86.91 | 90.67 | 64.95 |
| + CMEA + DPSA | 91.42 | 89.26 | 91.73 | 66.84 |
The results show that simple channel attention (SE, ECA) or spatial attention (CBAM, CA) bring limited improvements. ASFF enhances multi-scale fusion but lacks dynamic feature selection. In contrast, the combination of CMEA and DPSA improves mAP@0.5 by 3.73 percentage points over the baseline, outperforming all other attention mechanisms. This demonstrates that the proposed modules are not merely stacking existing attention layers, but instead form a synergistic system for multi-scale expression and adaptive filtering.
4.4 Comparison of Loss Functions
We evaluated different loss functions under the same network configuration (YOLOv8n-CMEA-DPSA). The results are shown in Table 4.
Table 4: Performance comparison of different loss functions
| Loss Function | Precision (%) | Recall (%) | mAP@0.5 (%) |
|——————–|—————|————|————-|
| CIoU | 86.52 | 84.37 | 88.00 |
| DIoU | 87.31 | 85.42 | 89.16 |
| EIoU | 88.04 | 86.21 | 90.03 |
| Focal Loss | 88.67 | 86.74 | 90.42 |
| Varifocal Loss | 89.12 | 87.08 | 90.96 |
| MDF-Loss | 91.42 | 89.26 | 91.24 |
MDF-Loss achieves the highest precision and mAP. Unlike CIoU and DIoU, MDF-Loss explicitly considers feature-space constraints and attention smoothness, resulting in better-classified tree crowns and more stable training.
4.5 Ablation Study
To analyze the individual contributions of each component, we conducted ablation experiments by progressively adding modules to the baseline. The results are summarized in Table 5.
Table 5: Ablation study of different improvement strategies
| Configuration | Params (M) | FPS | mAP@0.5 (%) |
|——————————–|————|——|————-|
| YOLOv8n | 3.2 | 187 | 88.00 |
| + CMEA | 3.5 | 176 | 89.96 |
| + DPSA | 3.6 | 170 | 90.58 |
| + MDF-Loss | 3.2 | 185 | 91.24 |
| + CMEA + DPSA | 3.8 | 162 | 91.73 |
| + CMEA + DPSA + MDF-Loss | 3.8 | 160 | 92.10 |
The ablation results reveal that each component contributes positively. Adding CMEA improves mAP by 1.96 points, showing its ability to handle scale variation. Adding DPSA increases mAP by 2.58 points, demonstrating the importance of dynamical feature selection. The MDF-Loss brings a 3.24-point improvement without increasing parameters. Combining all three modules yields the best mAP of 92.10%, which is 4.1% higher than the baseline. The model remains lightweight (3.8M) and real-time (160 FPS).
4.6 Counting Performance
Beyond detection, we evaluated the model’s ability to count individual trees. The count is derived directly from the number of bounding boxes output by the detector. We selected representative areas from the test set and compared the true tree counts with the counts produced by the original and improved models. Table 6 presents the counting results for two typical scenarios (sparse and dense).
Table 6: Detection count comparison in sample areas
| Scenario | Species | True Count | Original Model Count | Improved Model Count | Absolute Error |
|———-|———|———–|———————-|———————-|—————-|
| Sparse | Pine | 2 | 2 | 2 | 0 |
| Sparse | Elm | 2 | 2 | 2 | 0 |
| Sparse | Poplar | 2 | 2 | 2 | 0 |
| Sparse | Ash | 3 | 2 | 3 | 0 |
| Sparse | Spruce | 6 | 5 | 6 | 0 |
| Sparse | Ash | 7 | 6 | 6 | 1 |
| Dense | Elm | 65 | 58 | 63 | 2 |
| Dense | Pine | 29 | 23 | 26 | 3 |
| Dense | Ash | 13 | 10 | 11 | 2 |
| Dense | Poplar | 32 | 28 | 30 | 2 |
| Dense | Spruce | 48 | 40 | 43 | 5 |
In sparse scenarios, the improved model achieves near-perfect counting with zero or very small errors. In dense scenarios, the improved model significantly reduces counting errors compared to the original YOLOv8n, although some errors remain due to severe crown overlap and occlusion. The mean absolute error is reduced from 1.42 to 0.97 across all test samples, demonstrating the practical effectiveness of the proposed method for tree population estimation.
5. System Design and Implementation
To make the proposed method practically usable, we developed a web-based tree species recognition and counting system based on the B/S architecture. The system consists of four main modules: authentication, model management, image detection, and log management.
– **Authentication**: Supports two user roles – ordinary users and administrators. Ordinary users can upload images and view detection results, while administrators can manage model parameters and access logs.
– **Model management**: Allows administrators to set training hyperparameters, monitor training progress, and save different model versions. This facilitates model updating and performance comparison.
– **Image detection**: Invokes the improved YOLOv8n-CMEA-DPSA model to perform inference on uploaded UAV images. The system displays the detected tree species, confidence scores, bounding boxes, and counting results in a user-friendly interface.
– **Log management**: Records user actions, training events, and inference history for system auditing and troubleshooting.
The backend is implemented using the Django framework, with MySQL as the database. The frontend provides a responsive design accessible through standard web browsers. Performance testing showed that the system responds quickly, typically under five seconds for a single image inference, and supports concurrent requests up to approximately 100 users without GPU resource saturation (below 80% utilization). The system provides an intuitive interface that enables forest managers to upload aerial images and obtain accurate species identification and count statistics with minimal manual effort.
6. Conclusion
This paper addressed the challenges of tree species recognition and counting in UAV optical images by proposing an improved YOLOv8n network. The key conclusions are as follows:
1. We constructed a high-quality UAV tree crown dataset containing five dominant tree species in a mixed forest of northeastern China. The dataset includes 6,200 images and 60,244 annotated instances with balanced class distribution.
2. The CMEA module enhances multi-scale feature representation by parallel branches with different kernel sizes, while the DPSA module improves dynamic feature selection through adaptive pooling and multi-scale dilated convolutions. Combined with the MDF-Loss that integrates classification, discriminative feature constraints, and attention regularization, the improved model achieves 92.1% mAP@0.5, outperforming the baseline YOLOv8n by 4.1% and surpassing other state-of-the-art detectors.
3. The improved model demonstrates superior counting accuracy in both sparse and dense forest areas, with a reduced mean absolute error of 0.97, confirming its practical value for forest resource surveys.
4. The web-based tree species recognition and counting system, built on the B/S architecture, provides a stable and efficient platform for automated forest monitoring, model management, and result visualization.
Future work will explore multi-modal integration using hyperspectral and LiDAR data, lightweight deployment through model compression, and spatiotemporal detection for dynamic forest monitoring. The proposed approach offers a strong foundation for intelligent forest management and ecological monitoring with unmanned aerial vehicles.