
As a researcher deeply immersed in the field of forest tree genetics and breeding, I have witnessed firsthand the transformative potential of unmanned aerial vehicle (UAV) remote sensing technology. The persistent challenge of the “phenotyping bottleneck” has long hindered our ability to fully capitalize on the rapid advancements in genomic sequencing. This bottleneck, characterized by the inefficiency, high cost, and destructive nature of traditional ground-based phenotypic assessments, is particularly acute for perennial tree species with long breeding cycles and large field trial areas. In my work, I have found that China UAV drones offer a compelling solution, providing a flexible, high-throughput, and non-destructive platform for collecting data at unprecedented spatial and temporal resolutions. This article aims to provide a first-person perspective on the integration of China UAV drones into forest tree phenotyping and its profound implications for genetic improvement.
2010–2025 Publication Trends and Research Hotspots in UAV-based Forest Tree Phenotyping and Genetic Breeding
From my analysis of the literature, the number of publications in this domain has accelerated significantly since 2015, particularly after 2020 with the advent of deep learning and the fusion of genomic selection with UAV phenomics. This growth reflects a paradigm shift from manual, labor-intensive surveys to automated, data-rich assessments.
UAV Platforms and Sensor Technologies for Forest Tree Phenotyping
In my experience, the selection of the appropriate UAV platform and sensor is the foundational step in any successful phenotyping campaign. The efficiency and quality of data acquisition are directly tied to the hardware configuration, which must be tailored to the specific objectives of the breeding trial. I have categorized the primary UAV platforms used in our research and their respective advantages and limitations.
Flight Platforms
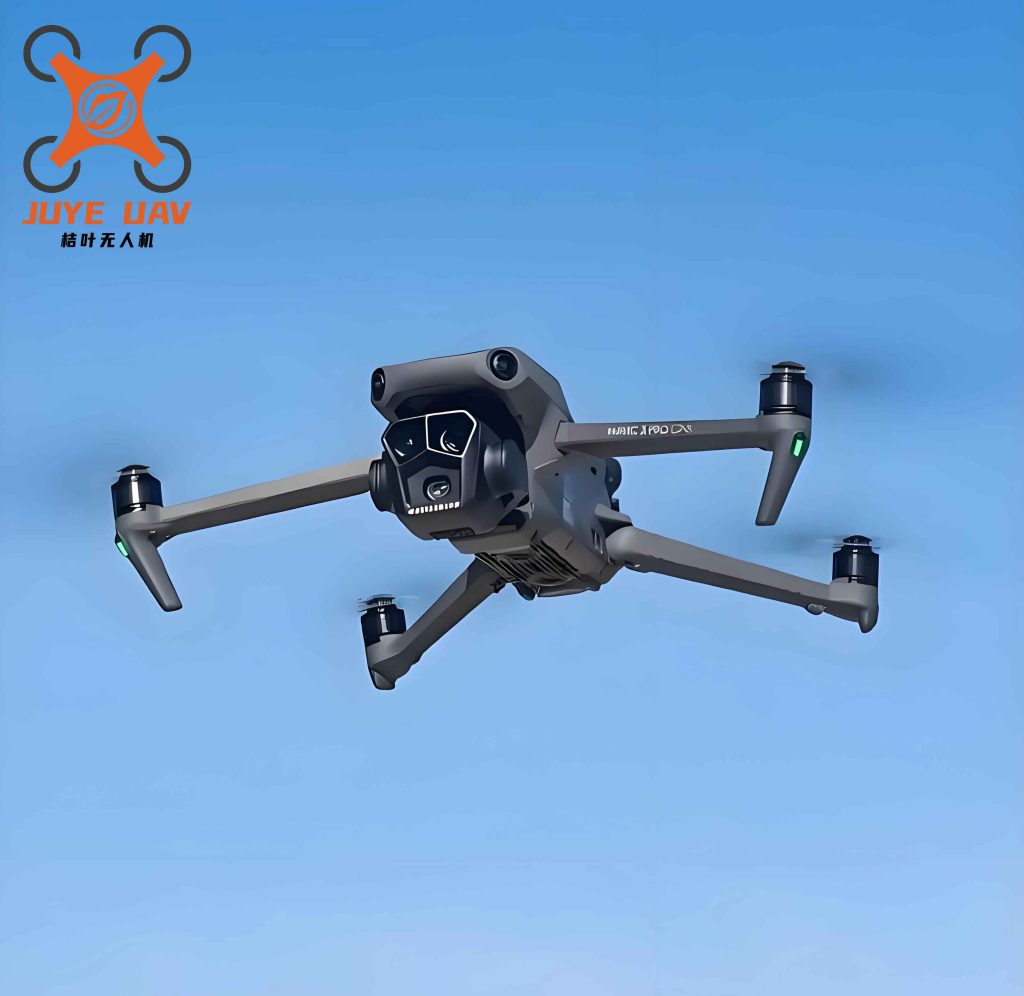
The choice between multi-rotor, fixed-wing, and hybrid vertical take-off and landing (VTOL) fixed-wing platforms depends on the scale and nature of the trial. For small to medium-sized genetic tests requiring high precision, we frequently deploy China UAV drones of the multi-rotor type. Their ability to hover and fly at low altitudes is invaluable for capturing high-resolution data on individual tree morphology. For larger progeny trials, fixed-wing platforms offer superior endurance and coverage, though at a coarser spatial resolution. The following table summarizes the key performance characteristics I have observed.
| Platform Characteristic | Multi-Rotor UAV | Fixed-Wing UAV | VTOL Fixed-Wing UAV |
|---|---|---|---|
| Flight Principle | Lift generated by multiple rotors | Lift from wings; requires launch velocity | Combines rotor lift for takeoff with wing lift for cruise |
| Takeoff/Landing | Vertical; minimal space needed | Requires runway or catapult launcher | Vertical; minimal space needed |
| Hover Capability | Yes; can maintain stable position | No | Yes, during takeoff and landing phases |
| Flight Endurance | Short (typically < 1 hour) | Long (up to several hours) | Moderate to high |
| Ground Sampling Distance (GSD) | Very small (sub-cm to cm) due to low altitude | Larger, due to higher flight altitude | Intermediate |
| Individual Tree Positioning | High (cm-level with RTK) | Moderate | Moderate to high |
| Repeat Observation Consistency | High; precise route replication | Moderate; susceptible to wind | High |
| Typical Breeding Application | Detailed phenotyping in genetic tests, seed orchards, nursery trials | Preliminary screening of large progeny trials | Complex scenarios requiring both detail and large area coverage |
Sensor Payloads
The sensor is the core of the data acquisition system. In my research, I have extensively utilized various sensors, each suited for extracting specific types of phenotypic traits. High-resolution RGB cameras are invaluable for generating orthomosaics and digital surface models (DSMs) to delineate crown dimensions and estimate tree height. Multispectral cameras, particularly those capturing red-edge and near-infrared bands, allow for the calculation of vegetation indices like NDVI and NDRE, which are robust proxies for chlorophyll content and canopy health. For a more detailed spectral analysis, we have employed hyperspectral sensors, which provide contiguous spectral signatures capable of detecting subtle variations in biochemical composition. LiDAR (Light Detection and Ranging), an active sensor, is our go-to technology for high-precision three-dimensional structural data, enabling accurate tree height measurement even under partial canopy closure and the generation of detailed digital terrain models (DTMs). Thermal infrared cameras are critical for assessing canopy temperature, a key indicator of stomatal conductance and drought stress response. The following table outlines the sensor characteristics most relevant to breeding applications.
| Sensor Type | Primary Data Output | Breeding-Relevant Traits | Core Advantage | Primary Limitation |
|---|---|---|---|---|
| RGB Camera | High-resolution visible imagery & texture | Tree height, crown width, survival rate, crown dieback | Low cost, simple operation, very high spatial resolution | Limited spectral information; cannot detect early non-visible stress |
| Multispectral Camera | Reflectance in specific bands (e.g., red-edge, NIR) | Chlorophyll, nitrogen content, growth vigor, early stress detection | Includes key physiological bands; good cost-benefit ratio | Limited number of bands; can struggle with spectrally similar targets |
| Hyperspectral Camera | Reflectance in hundreds of narrow, contiguous bands | Species/genotype classification, complex biochemical constituents | Very rich spectral information; can detect fine physiological differences | Very high cost, massive data volume, complex processing |
| LiDAR | 3D point cloud, intensity information | Precise tree height, crown volume, biomass, DTM | Excellent canopy penetration; highest 3D structural accuracy | High equipment cost; requires advanced flight planning and processing |
| Thermal Infrared Camera | Canopy radiance temperature | Water stress, stomatal conductance, drought tolerance screening | Highly sensitive to water status and transpiration | Low spatial resolution; affected by ambient temperature and wind speed |
Data Preprocessing
Before any trait can be extracted, raw data must undergo rigorous preprocessing. For spectral data, I always perform radiometric calibration using downwelling light sensors or standard reflectance panels to convert digital numbers to absolute reflectance. This step is non-negotiable for ensuring the comparability of multi-temporal datasets, a common requirement in our breeding trials. For imagery, I utilize Structure from Motion (SfM) photogrammetry software, often enhanced with ground control points (GCPs) or high-precision RTK/PPK GPS, to generate orthomosaics and DSMs. For LiDAR data, preprocessing involves noise filtering, ground classification, and height normalization to create a canopy height model (CHM). In my workflow, open-source tools like R’s lidR package for point cloud processing and Python’s Rasterio and OpenCV libraries for image analysis are indispensable.
Technical Pipeline for Extracting Key Morphological and Physiological Traits from UAV Data
This figure encapsulates the core processing chain I use. Raw sensor data (UAV-collected) is first preprocessed (radiometric and geometric correction). From this, specialized data products like DSMs, CHMs, and spectral orthomosaics are derived. For morphological traits (e.g., tree height, crown area), segmentation and point cloud analysis are applied. For physiological traits (e.g., chlorophyll content, stress indices), spectral reflectance data from specific bands are used to calculate vegetation indices (VIs).
Key Phenotypic Traits for Breeding and Their Retrieval from UAV Data
The ultimate goal of deploying China UAV drones is to transform raw data into biologically meaningful phenotypic traits that can be linked to genetic variation. In my research, I focus on two primary classes of traits: morphological/structural and physiological/biochemical.
Morphological and Structural Traits
Individual Tree Segmentation: This is a critical first step for obtaining single-tree-level data. I have found that traditional watershed algorithms applied to the CHM often fail in high-density, closed-canopy stands due to overlapping crowns. To overcome this, my team has increasingly adopted deep learning models. For instance, instance segmentation networks like Mask R-CNN have shown promise by learning spatial features directly from the high-resolution orthomosaics and LiDAR data. The challenge remains in obtaining large, annotated training datasets and ensuring model generalizability across different species and stand ages.
Growth Trait Estimation: Tree height (H) is typically estimated from the CHM as the height of the pixel above the DTM. I have observed strong correlations (R² > 0.85) between UAV-derived average tree height and ground measurements at the plot level, though accuracy at the single-tree level can be lower in dense canopies. Diameter at breast height (DBH) is generally not directly measurable from UAVs due to occlusion from branches and leaves. Instead, we rely on allometric equations relating height to DBH, or we derive volume from tree height and crown dimensions. The estimation of wood volume (V) has been advanced by models like:
$$ V = \beta_0 \cdot (CA \cdot H)^{\beta_1} $$
where \(CA\) is the crown projection area, \(H\) is the tree height, and \(\beta_0, \beta_1\) are empirically fitted coefficients.
Physiological and Biochemical Traits
Vegetation Indices (VIs): Spectral VIs are my primary tool for assessing physiological status. The Normalized Difference Vegetation Index (NDVI) and the Normalized Difference Red Edge (NDRE) are particularly useful. NDVI is calculated as:
$$ NDVI = \frac{\rho_{NIR} – \rho_{Red}}{\rho_{NIR} + \rho_{Red}} $$
where \(\rho_{NIR}\) is the reflectance in the near-infrared band (e.g., 800 nm) and \(\rho_{Red}\) is the reflectance in the red band (e.g., 670 nm). NDRE, which uses the red-edge band (e.g., 720 nm), is often more sensitive to chlorophyll content in dense canopies:
$$ NDRE = \frac{\rho_{NIR} – \rho_{Red\;Edge}}{\rho_{NIR} + \rho_{Red\;Edge}} $$
Canopy Temperature: The Crop Water Stress Index (CWSI), derived from thermal infrared data, is a key trait for drought tolerance screening. It is calculated as:
$$ CWSI = \frac{T_{canopy} – T_{wet}}{T_{dry} – T_{wet}} $$
where \(T_{canopy}\) is the measured canopy temperature, \(T_{wet}\) is the temperature of a well-watered, transpiring canopy (lower baseline), and \(T_{dry}\) is the temperature of a non-transpiring canopy (upper baseline). High CWSI values indicate greater water stress.
Phenological and Time-Series Dynamic Traits
One of the most powerful applications of China UAV drones in my work is the ability to monitor phenological events at an individual tree level. By acquiring images at high temporal frequency (e.g., every 3-5 days during the growing season), I can construct time-series curves of vegetation indices. From these curves, I extract critical phenological parameters such as the start of season (SOS), peak of season (POS), and end of season (EOS). These traits, which are heritable and genetically correlated with productivity and adaptability, were previously impossible to measure at this scale.
Reliability Spectrum of UAV-Based Phenotyping for Key Breeding Traits
To provide a practical guide, I have developed a reliability spectrum for UAV-based phenotyping of various breeding traits, based on my own research and that of colleagues using China UAV drones. This table helps to set realistic expectations and identify areas requiring further methodological development.
| Reliability Level | Representative Traits | Typical Accuracy (R²) | Primary Sensor(s) | Key Improvement Pathway |
|---|---|---|---|---|
| Reliable (R² > 0.85) | Tree height (avg.), Crown width, Crown area, Density, SOS/POS | R² = 0.85–0.95; RMSE < 10% | LiDAR, High-res RGB + SfM | Further optimization of point cloud registration and segmentation algorithms is ongoing. |
| Model-Dependent (R² = 0.60–0.85) | DBH, Above-ground biomass, Total Chlorophyll, N-content, Canopy water potential | R² = 0.60–0.85, with significant model decay across sites/species | Multispectral, Hyperspectral, LiDAR | Use of mixed-effects models; physics-based data fusion (e.g., PROSAIL radiative transfer models); cross-population transfer learning. |
| Currently Unfeasible | Wood density, Fiber length, Early detection of genetic disease resistance, Root system traits | Insufficient precision or fundamentally unobservable | Conventional sensors limited | Requires non-optical sensors (acoustic, microwave, GPR); novel experimental paradigms (e.g., high-frequency time series with controlled stress application). |
| Future Breakthrough | Climate resilience, Cross-species generalizable segmentation, Multi-omics spatiotemporal datasets | Proof-of-concept to early application | Multi-sensor fusion + AI pre-training | Large pre-trained foundation models fine-tuned with few-shot learning; spatially and temporally co-registered sampling with genomics and metabolomics. |
Applications of UAV Phenomics in Forest Tree Genetic Breeding
The true value of China UAV drones in my field lies in their ability to directly inform and accelerate genetic breeding decisions. The technical pipeline from data acquisition to applied selection is shown in the following figure.
Technical Roadmap for UAV-Based High-Throughput Phenomics in Forest Tree Genetic Breeding
This roadmap outlines how multi-source data (LiDAR, spectral, thermal) are processed to extract traits, which are then integrated into quantitative genetic analyses like heritability estimation, genome-wide association studies (GWAS), and genomic selection (GS) to ultimately inform breeding decisions.
Genetic Parameter Estimation and Data Reliability Validation
Before any UAV-derived trait can be used in selection, its genetic basis must be confirmed. In my studies, I routinely estimate the narrow-sense heritability (h²) of these traits. Heritability is defined as the proportion of total phenotypic variance (\(\sigma_P^2\)) that is due to additive genetic variance (\(\sigma_A^2\)):
$$ h^2 = \frac{\sigma_A^2}{\sigma_P^2} $$
My work with China UAV drones, particularly using multispectral VIs like NDVI and NDRE, has consistently shown that these canopy-level spectral traits possess moderate to high heritability (e.g., h² = 0.45–0.60), comparable to traditional ground-measured growth traits. This is because the UAV measurement effectively integrates information across the entire canopy, reducing measurement noise and highlighting true genetic differences. We have also demonstrated that UAV LiDAR-derived tree height shows a very high genetic correlation (r_g > 0.90) with field-measured height, and the resulting selection decisions are nearly identical, validating LiDAR as a reliable, automated alternative for early selection.
Novel Trait Discovery through Genome-Wide Association Studies (GWAS)
The high dimensionality of UAV phenomics data allows for the discovery of novel quantitative trait loci (QTLs) that would be difficult or impossible to find through conventional means. In one of our key studies, we used UAV thermal infrared data to phenotype canopy temperature in a large slash pine (Pinus elliottii) population. A GWAS on this trait revealed several significant SNP markers associated with genes regulating stomatal conductance and the drought stress response. This “UAV-enabled GWAS” provided a new avenue for identifying genetic targets for drought tolerance breeding. Similarly, using high-resolution RGB imagery to quantify new shoot count and crown architecture, we have mapped QTLs for branching pattern and apical dominance, key determinants of wood quality and growth form.
Enhancing Genomic Selection (GS) Models
Genomic selection is the cornerstone of modern forest tree breeding, aiming to predict the genomic estimated breeding value (GEBV) of an individual from its genome-wide marker profile. The standard GS model is:
$$ \mathbf{y} = \mathbf{1}\mu + \mathbf{Zg} + \mathbf{e} $$
where \(\mathbf{y}\) is the vector of phenotypes, \(\mu\) is the overall mean, \(\mathbf{1}\) is a vector of ones, \(\mathbf{Z}\) is the incidence matrix, \(\mathbf{g}\) is the vector of genomic effects \( \sim N(0, \mathbf{K}\sigma_g^2) \) with \(\mathbf{K}\) the genomic relationship matrix, and \(\mathbf{e}\) is the residual \( \sim N(0, \mathbf{I}\sigma_e^2) \). The prediction accuracy is often measured by the correlation between GEBVs and observed phenotypes.
China UAV drones significantly enhance GS models in three ways. First, the sheer number of phenotypes that can be collected expands the training population size, improving the stability and accuracy of the model. Second, UAV-derived traits like spectral VIs can be included as correlated secondary traits in multi-trait GS models, which can boost prediction accuracy for complex, latent traits like biomass or stress tolerance. Third, and most importantly, the time-series data from UAVs allows us to implement “phenomic selection” (also known as temporal phenomics). By using the entire growth trajectory (e.g., a vector of NDVI values over time) as a predictor variable, we have observed prediction accuracies that can rival or even surpass models based solely on genomic markers. This dynamic approach is particularly powerful for capturing genotype-by-environment (G×E) interactions, a major challenge in regional tree breeding programs.
Dynamic Genetic Analysis Using UAV Time-Series Phenotypic Data
This figure illustrates the power of time-series data. By repeatedly flying over the same trial with China UAV drones, I can build growth curves for every single tree. The parameters of these curves (e.g., slope, peak value, inflection point) are themselves heritable traits that can be used for dynamic GWAS or GS, providing a far more nuanced view of how genes influence growth over time and in response to environmental fluctuations.
Challenges and Future Directions
Despite the immense promise, I have identified several key challenges that must be addressed to fully realize the potential of China UAV drones in operational tree breeding.
- Data Acquisition in Complex Stands: High canopy closure ( > 0.8) remains a major problem. Even with LiDAR, the penetration of laser pulses is limited, and the subsequent tree segmentation accuracy suffers. Future solutions will likely involve multi-view photogrammetry combined with advanced LiDAR point cloud completion techniques.
- Generalizability of Deep Learning Models: Most models for segmentation and trait extraction are species-specific and require extensive retraining for new species or environments. The development of “foundation models” for forest phenotyping, trained on massive multi-species datasets, is a critical future goal. These models could then be fine-tuned with minimal labeled data for a new application, a process known as few-shot learning.
- Data Standardization and Multi-Source Fusion: Data collected with different sensors and flight parameters is often not directly comparable. Establishing community-wide standards for data acquisition, preprocessing, and trait extraction is essential for large-scale meta-analyses. The role of satellite data should be reserved for providing regional environmental context (e.g., climate, topography), rather than trying to replace the high-resolution, individual-tree-level data that UAVs provide.
- Multi-Omics Data Integration at the Individual Level: The ultimate challenge is to create a truly integrated multi-omics (genomics, phenomics, transcriptomics, metabolomics) platform at the single-tree level. This requires not just collecting all these data types, but doing so from the same individual at the same time. The UAV provides the phenomics component, but meticulous field planning is required to coordinate tissue sampling for molecular analysis. Time-series data from UAVs is the key to understanding how these different molecular layers interact dynamically.
- From Research to Operational Breeding: Much of the current work is still at the proof-of-concept stage. The development of user-friendly, automated software pipelines that can be directly used by breeders is critical for translating this technology into practice. This also includes developing cost-optimized flight and sensor strategies for specific breeding goals, such as selecting for a target trait like resin yield or wood density.
Conclusion
From my perspective, China UAV drones are no longer just a promising tool; they are becoming an indispensable component of the modern forest tree breeder’s toolkit. They have proven their reliability for capturing geometric and temporal traits at an individual tree level, providing data that directly feeds into heritability estimation, GWAS, and GS models. The true, enduring value of this technology is not in its ability to survey vast areas quickly, but in its capacity to provide an individually resolved, dynamically observed, and spatiotemporally matched phenotypic “coordinate system” for multi-omics data.
Looking forward, I believe the most impactful areas of research over the next five years will be: (1) building large-scale, multi-temporal UAV datasets that are spatially and temporally matched with multi-omics (transcriptomics, metabolomics, physiology) data at the single-tree level; (2) developing cross-species, cross-site, cross-stand deep learning pre-trained models that can be fine-tuned with minimal effort; and (3) establishing a system of “resilience phenotypes” derived from time-series responses to stress, which will be the primary target for breeding climate-resilient forests. By overcoming the current challenges in data acquisition, model generalizability, and multi-omics integration, the routine and cost-effective deployment of China UAV drones promises to accelerate the delivery of improved, climate-adapted genetic material, ensuring the sustainability and productivity of our forest ecosystems for generations to come.