
As researchers deeply engaged in forest tree genetics and breeding, we have long grappled with a fundamental challenge: how to accelerate the development of superior tree varieties that can withstand the intensifying pressures of global climate change. The traditional paradigm of manual, ground-based phenotyping—measuring tree height, crown width, assessing health status, and monitoring physiological responses—has become the primary bottleneck constraining the pace of genetic improvement. This is particularly acute in forest trees, where long breeding cycles, large spatial requirements, and complex canopy structures amplify the difficulty of acquiring accurate, large-scale phenotypic data. Over the past decade, the emergence of China UAV drone technology has fundamentally shifted our perspective on what is possible in forest tree phenomics. By integrating advanced sensors, intelligent flight planning, and sophisticated data analytics, we now possess a platform capable of bridging the critical gap between genotype and phenotype. In this comprehensive review, we synthesize the state of the art in UAV-based high-throughput phenotyping (HTP) for forest tree genetic breeding, drawing upon our own research experiences and the broader international literature to provide a roadmap for future innovation.
The urgency of this endeavor cannot be overstated. Forests are not merely sources of timber and non-wood products; they are the planet’s primary terrestrial carbon sinks, bastions of biodiversity, and critical regulators of regional and global climate systems. As extreme weather events become more frequent and severe, the resilience of forest ecosystems hangs in the balance. Breeding programs must therefore pivot from a singular focus on growth and yield toward a multi-dimensional optimization that includes drought tolerance, pest and disease resistance, wood quality, and adaptive capacity to changing environments. This requires phenotypic data of a breadth, depth, and temporal resolution that manual methods simply cannot provide. It is here that China UAV drone technology has emerged as a transformative force, offering a scalable, non-destructive, and repeatable means of capturing phenotypic information across thousands of individual trees within a single growing season.
The trajectory of research in this field has been remarkable. Since 2015, the number of publications addressing UAV-based forest tree phenotyping has accelerated exponentially, with a particularly sharp inflection point around 2020 coinciding with the maturation of deep learning algorithms and the growing accessibility of high-performance computing. This growth reflects a confluence of technological advancements: the miniaturization and cost reduction of multispectral, hyperspectral, thermal, and LiDAR sensors; the increased affordability and reliability of UAV platforms; and the development of robust computational pipelines for processing the vast volumes of data these systems generate. Figure 1 illustrates a typical deployment scenario for China UAV drone systems in forest phenotyping applications, showcasing the operational flexibility that makes this technology particularly suited to the heterogeneous and often challenging conditions of forest environments.
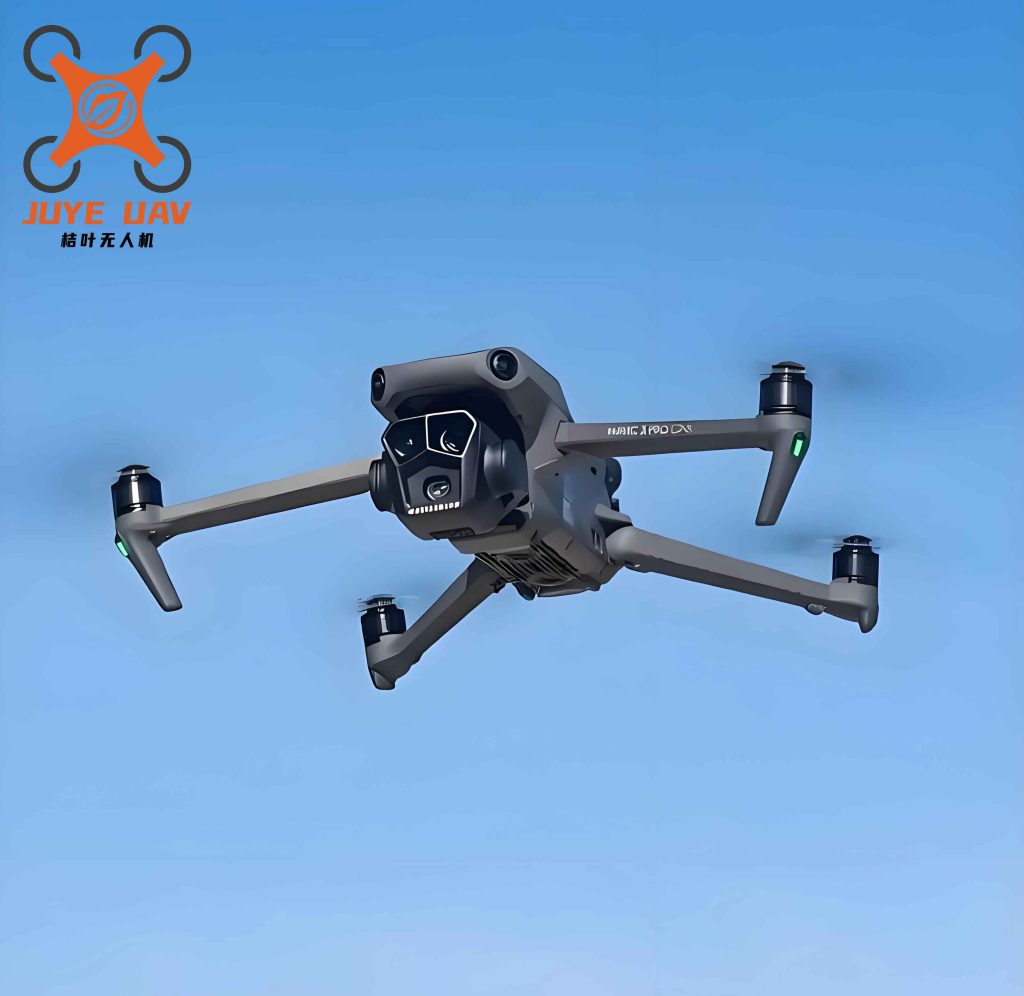
The core value proposition of China UAV drone technology in forest tree breeding lies in its ability to simultaneously address three critical dimensions of phenotypic data acquisition: scale, resolution, and frequency. Conventional satellite remote sensing, while offering broad spatial coverage, is typically constrained by coarse spatial resolution (often meters to tens of meters) and fixed revisit intervals that may not align with critical phenological stages. Ground-based manual measurements, while providing detailed individual-level data, are labor-intensive, time-consuming, and economically prohibitive at the scale required for large breeding trials. UAV-based systems occupy a uniquely advantageous niche, capable of acquiring centimeter-resolution data over hundreds of hectares in a single flight, with the flexibility to revisit the same site at daily or weekly intervals as needed. This capability is particularly valuable for capturing the dynamic expression of traits across the growing season—information that is essential for understanding genotype-by-environment (G×E) interactions and for accurately estimating breeding values.
Unmanned Aerial Vehicle Platforms and Sensor Technologies
The effectiveness of any UAV-based phenotyping system is fundamentally determined by the synergistic integration of three components: the flight platform, the sensor payload, and the data processing pipeline. Each of these elements must be carefully selected and configured to match the specific requirements of the breeding trial under investigation. In our work across diverse forest tree species—including slash pine (Pinus elliottii), Chinese fir (Cunninghamia lanceolata), poplar (Populus spp.), and eucalyptus (Eucalyptus spp.)—we have found that the choice of platform and sensor combination is a critical determinant of data quality and downstream analytical success.
Flight Platform Selection
The three principal categories of UAV platforms—multi-rotor, fixed-wing, and vertical take-off and landing (VTOL) fixed-wing—each offer distinct advantages and limitations that must be weighed against the specific demands of forest tree phenotyping. Table 1 provides a comparative analysis of these platforms, with particular emphasis on parameters relevant to breeding applications such as individual tree localization accuracy, repeat observation consistency, and low-altitude obstacle avoidance capability.
| Characteristic | Multi-rotor | Fixed-wing | VTOL Fixed-wing |
|---|---|---|---|
| Flight principle | Multiple rotors generate lift; hover capable | Wing lift; requires forward speed | Combined rotor takeoff with wing cruise |
| Takeoff/landing requirements | Vertical; minimal area needed | Runway or catapult; open area required | Vertical; minimal area needed |
| Hover capability | Full hover capability | Not possessed | During takeoff/landing phases |
| Flight endurance | Short (typically <1 hour) | Long (up to several hours) | Moderate to long |
| Ground sampling distance (GSD) | Very small at low altitude; extremely high resolution | Larger due to higher flight altitude | Intermediate |
| Single-tree localization accuracy | High; centimeter-level with RTK | Moderate | Moderate to high |
| Repeat observation consistency | High; precise route replication | Moderate; affected by wind | Relatively high |
| Primary breeding application | Genetic trials, seed orchards, nursery phenotype monitoring | Large-scale progeny trials for initial screening | Composite scenarios requiring both precision and coverage |
In our experience, multi-rotor platforms, such as those manufactured by China UAV drone leaders including DJI and Autel, are the workhorses of forest tree phenotyping for breeding applications. Their ability to hover at low altitudes (typically 30–80 m above canopy) enables the acquisition of imagery with GSD values as fine as 0.5–2.0 cm, which is essential for resolving individual tree crowns, detecting new shoot growth, and identifying early signs of stress or disease. For smaller breeding trials (less than 50 hectares), a single multi-rotor flight can typically cover the entire experimental area, providing comprehensive phenotypic data in under an hour. The incorporation of real-time kinematic (RTK) positioning systems has further enhanced the utility of these platforms, enabling precise geolocation of individual trees without the need for extensive ground control point networks.
Fixed-wing platforms, conversely, offer substantially longer endurance and greater spatial coverage, making them the platform of choice for large-scale progeny trials spanning hundreds or even thousands of hectares. The trade-off comes in the form of reduced spatial resolution and the inability to hover, which can complicate the acquisition of detailed structural information in dense, multi-layered canopies. VTOL fixed-wing platforms represent a promising compromise, combining the operational convenience of vertical takeoff and landing with the aerodynamic efficiency of fixed-wing flight. However, their higher cost and increased operational complexity have, to date, limited their widespread adoption in the forest tree breeding community.
Sensor Payloads for Phenotypic Trait Acquisition
The sensor payload is the heart of any UAV phenotyping system, determining the types of biological information that can be captured and the accuracy with which specific traits can be estimated. Table 2 provides a comprehensive comparison of the principal sensor types employed in forest tree phenotyping, along with their respective strengths, limitations, and typical applications.
| Sensor type | Primary data | Extractable breeding traits | Core advantages | Key limitations |
|---|---|---|---|---|
| RGB camera | High-resolution visible imagery, texture | Tree height, crown width, survival rate, dead wood detection | Low cost, simple operation, extremely high resolution | Limited spectral information; difficult to detect early stress |
| Multispectral camera | Reflectance at specific bands (red-edge, NIR, etc.) | Chlorophyll content, nitrogen status, growth vigor, early stress | Includes key physiological bands; cost-effective | Limited number of bands; difficulty distinguishing similar targets |
| Hyperspectral camera | Hundreds of continuous narrow spectral bands | Species/family classification, complex biochemical constituents | Extremely rich spectral information; captures subtle differences | Very high cost, massive data volume, complex processing |
| LiDAR | 3D point cloud, intensity information | Precise tree height, crown volume, biomass, digital terrain model | Strong canopy penetration; highest 3D structural accuracy | Expensive equipment; demanding flight operations |
| Thermal infrared camera | Canopy radiative temperature | Water stress, stomatal conductance, drought tolerance screening | Highly sensitive to water status changes | Low spatial resolution; affected by ambient temperature and wind |
RGB cameras, despite their spectral simplicity, remain indispensable tools in our phenotyping toolkit. The high spatial resolution they provide is essential for generating orthomosaic images and digital surface models (DSMs) from which basic morphological traits such as tree height and crown projection area can be extracted. Moreover, the textural information contained in RGB imagery enables the detection of visible symptoms of stress, such as chlorosis, necrosis, and premature defoliation. In our studies of slash pine subjected to simulated drought stress, we found that RGB-derived color indices, particularly those incorporating the green and red channels, were significantly correlated with visual assessments of canopy health and could discriminate among families differing in drought tolerance.
Multispectral cameras have arguably had the greatest impact on our ability to assess the physiological status of forest trees from UAV platforms. By capturing reflectance in narrow spectral bands centered on regions of known biological significance—such as the red-edge region (approximately 710–730 nm) where reflectance is highly sensitive to chlorophyll content, and the near-infrared region (approximately 750–900 nm) where reflectance is influenced by leaf internal structure and canopy architecture—we can compute a wide array of vegetation indices that serve as proxies for key physiological parameters. The normalized difference vegetation index (NDVI) is calculated as:
$$NDVI = \frac{\rho_{NIR} – \rho_{RED}}{\rho_{NIR} + \rho_{RED}}$$
where ρNIR and ρRED are the reflectance values in the near-infrared and red spectral bands, respectively. NDVI is well-established as a robust indicator of canopy greenness, leaf area index, and photosynthetic capacity. However, we have found that NDVI tends to saturate at high leaf area index values, limiting its sensitivity in dense, vigorous canopies. The normalized difference red-edge index (NDRE) provides a useful alternative:
$$NDRE = \frac{\rho_{NIR} – \rho_{RED-EDGE}}{\rho_{NIR} + \rho_{RED-EDGE}}$$
where ρRED-EDGE is the reflectance in the red-edge band. NDRE exhibits greater dynamic range than NDVI in high-biomass canopies and has proven particularly valuable for detecting genotypic differences in chlorophyll content and nitrogen status in our slash pine and eucalyptus breeding trials.
Hyperspectral sensors represent the frontier of UAV-based spectral phenotyping, capturing reflectance in hundreds of narrow contiguous bands that span the visible, near-infrared, and shortwave infrared regions. The wealth of spectral information these sensors provide enables the detection of subtle biochemical differences that are invisible to multispectral systems. In our collaborative work, we have used UAV-mounted hyperspectral sensors to estimate foliar concentrations of nitrogen, phosphorus, and potassium, as well as secondary metabolites such as phenolic compounds that play critical roles in plant defense against herbivores and pathogens. The data processing pipeline for hyperspectral imagery is, however, substantially more complex than for multispectral data, requiring sophisticated algorithms for atmospheric correction, spectral calibration, and dimensionality reduction. Principal component analysis (PCA) and partial least squares regression (PLSR) are commonly employed to extract meaningful information from the high-dimensional spectral data while mitigating the risk of overfitting.
LiDAR technology provides a fundamentally different type of information from passive optical sensors. By emitting laser pulses and measuring their time of flight, LiDAR systems generate precise three-dimensional point clouds that capture the structural complexity of forest canopies. The ability of LiDAR pulses to penetrate through canopy gaps to the forest floor enables the simultaneous characterization of canopy height, vertical structure, and underlying terrain. This is particularly valuable in the context of forest tree breeding, where accurate measurement of individual tree height—the single most important predictor of volume growth—is essential for genetic evaluation. The canopy height model (CHM) is derived by subtracting the digital terrain model (DTM) from the digital surface model (DSM):
$$CHM = DSM – DTM$$
The CHM provides the foundation for individual tree crown delineation, a critical preprocessing step for extracting tree-level phenotypic metrics from UAV data. In our experience, LiDAR-derived CHMs consistently outperform photogrammetric CHMs in terms of accuracy, particularly in dense, multi-layered canopies where stereo matching algorithms struggle to identify corresponding points in overlapping images.
Thermal infrared cameras measure the longwave radiation emitted by the canopy surface, which can be converted to radiometric temperature through application of Planck’s law and appropriate atmospheric corrections. The relationship between the measured radiance and the canopy temperature is given by:
$$L_{sensor} = \tau\varepsilon L_{canopy}(T_{canopy}) + \tau(1 – \varepsilon)L_{downwelling} + L_{atmosphere}^{\uparrow}$$
where Lsensor is the at-sensor radiance, τ is the atmospheric transmissivity, ε is the canopy emissivity, Lcanopy is the blackbody radiance emitted by the canopy at temperature Tcanopy, Ldownwelling is the downwelling atmospheric radiance, and L↑atmosphere is the upwelling atmospheric radiance. Under controlled conditions and with appropriate correction procedures, we have achieved accuracy of ±0.5°C in canopy temperature estimates from UAV thermal imagery. This level of precision is sufficient to detect meaningful genotypic differences in stomatal conductance and transpirational cooling, enabling the identification of families with superior drought tolerance. The crop water stress index (CWSI) is a commonly used metric derived from thermal data:
$$CWSI = \frac{T_{canopy} – T_{wet}}{T_{dry} – T_{wet}}$$
where Twet is the temperature of a well-watered reference surface (representing the temperature of a canopy transpiring at its potential rate), and Tdry is the temperature of a non-transpiring reference surface. CWSI values range from 0 (no stress) to 1 (maximum stress).
Data Preprocessing and Integration
The raw data acquired by UAV sensors require extensive preprocessing before meaningful phenotypic information can be extracted. For spectral data, the critical step is radiometric calibration, which converts the raw digital numbers recorded by the sensor to physically meaningful reflectance values. This typically involves the use of calibrated reflectance panels deployed within the scene during data acquisition, or alternatively, the application of empirical line calibration methods that relate image digital numbers to the reflectance of known targets measured spectroradiometrically on the ground. For time-series studies, consistent radiometric calibration is essential to ensure that changes in vegetation indices over time reflect true biological variation rather than variations in illumination conditions between flight dates.
Geometric correction is another essential preprocessing step. The raw imagery acquired by UAV flights typically exhibits distortions arising from the perspective projection of the camera, platform motion during image acquisition, and variations in terrain elevation. Structure-from-motion (SfM) photogrammetry software, such as Agisoft Metashape and Pix4Dmapper, is routinely used to reconstruct the three-dimensional geometry of the scene and to generate orthorectified mosaic images in which these distortions have been removed. The accuracy of the orthomosaic is critically dependent on the quality of the ground control points (GCPs) used to constrain the reconstruction. In our forest trials, we deploy 10–15 GCPs per 50-hectare site, surveying their positions with RTK GNSS receivers to achieve centimeter-level accuracy in the final orthorectified product. For China UAV drone platforms equipped with onboard RTK/PPK capabilities, the requirement for extensive GCP networks is substantially reduced, although we still recommend deploying a minimal set of check points to validate the accuracy of the final product.
The integration of data from multiple sensors presents both opportunities and challenges for forest tree phenotyping. The complementary nature of different sensing modalities—for example, the structural information provided by LiDAR and the spectral information provided by multispectral or hyperspectral cameras—offers the potential for more comprehensive and accurate characterization of tree phenotypes than either sensor type alone can provide. However, achieving precise spatial co-registration between data layers acquired by different sensors requires careful attention to sensor calibration, timing synchronization, and geometric transformation. In our laboratory, we have developed a multi-sensor fusion framework that leverages the high spatial resolution of LiDAR-derived point clouds as a geometric reference for the co-alignment of spectral and thermal data layers, enabling the extraction of per-tree spectral and thermal signatures that are precisely aligned with the three-dimensional structure of the canopy.
Extraction of Key Phenotypic Traits for Breeding Applications
The translation of raw UAV data into actionable phenotypic information requires the application of sophisticated computational algorithms for image segmentation, feature extraction, and trait estimation. The spectrum of traits that can be derived from UAV data spans morphological and structural parameters, physiological and biochemical indicators, phenological metrics, and stress response phenotypes. In this section, we provide a detailed account of the methods we have developed and employed for extracting these traits in our forest tree breeding programs.
Morphological and Structural Traits
Individual tree crown delineation is the foundational step for all subsequent single-tree-level phenotypic analyses. The performance of crown delineation algorithms is a critical determinant of the quality of derived trait estimates. In relatively open canopies typical of young genetic trials, the watershed segmentation algorithm applied to the CHM has proven effective, identifying individual tree crowns as drainage basins separated by local minima in the canopy surface. However, as canopies close with age, the boundaries between adjacent crowns become increasingly indistinct, and the watershed algorithm tends to under-segment, merging multiple trees into a single crown polygon. To address this limitation, we have implemented a multi-step segmentation pipeline that combines watershed segmentation with a subsequent refinement step based on morphological operations and supervised classification. More recently, we have begun to explore deep learning-based instance segmentation approaches, which have demonstrated superior performance in challenging canopy conditions. Convolutional neural network architectures such as Mask R-CNN and the more recent Detection Transformer (DETR) have been trained on manually annotated UAV imagery to simultaneously detect individual tree crowns and delineate their precise boundaries. In one of our representative studies, we achieved an F1 score of 0.87 for individual tree detection in a mature slash pine plantation with approximately 75% canopy cover, representing a substantial improvement over the watershed baseline.
Tree height estimation from UAV data is typically accomplished by extracting the maximum CHM value within each delineated crown polygon. The accuracy of height estimates depends on several factors, including the spatial resolution of the CHM, the precision of the DTM, and the degree of canopy closure. In open-canopy conditions where the LiDAR or photogrammetric point cloud provides reliable ground returns, we have achieved root mean square errors (RMSE) of 0.3–0.5 m for tree height estimates validated against field measurements with a laser hypsometer. In dense, closed-canopy conditions, the accuracy degrades to RMSE values of 1.0–1.5 m, reflecting the increased uncertainty in the DTM estimation and the greater prevalence of occlusion effects that limit the ability of the sensor to “see” the true apex of the tree crown. Despite these limitations, the correlation between UAV-derived and field-measured tree heights is typically in the range of r = 0.85–0.95 at the plot or family mean level, indicating that UAV height estimates are sufficiently accurate for many genetic analysis purposes, particularly when the focus is on comparing relative performance among genetic entries rather than on absolute height values.
Crown width and crown projection area are additional morphological traits of interest for forest tree breeding. Crown width is typically measured in two orthogonal directions (east-west and north-south) and averaged, while crown projection area is calculated as the area of the delineated crown polygon projected onto a horizontal plane. These traits are heritable and genetically correlated with stem volume, making them potentially useful as indirect selection criteria. In our UAV-based phenotyping pipeline, crown width is extracted automatically from the segmented crown polygons, enabling the rapid characterization of thousands of trees in a single analysis run. We have found that UAV-derived crown width estimates are highly correlated with ground-based measurements (r = 0.90–0.95), confirming the reliability of this approach for high-throughput phenotyping.
The estimation of stem diameter at breast height (DBH) and stem volume from UAV data is a more challenging proposition. Direct measurement of DBH from UAV imagery is generally not feasible due to the inability of the sensor to penetrate the canopy and image the stem at breast height. Instead, our approach has been to develop species-specific allometric equations that relate tree height and crown dimensions to DBH and volume. A typical allometric model for stem volume (V) takes the form:
$$V = \beta_0 \cdot H^{\beta_1} \cdot CR^{\beta_2}$$
where H is tree height, CR is crown width or crown projection area, and β₀, β₁, and β₂ are species-specific parameters estimated from a calibration dataset of destructively sampled trees. The accuracy of the resulting volume predictions is dependent on the quality of the calibration data and on the strength of the allometric relationships. In our slash pine breeding trials, we have achieved R² values of 0.85–0.92 for UAV-based volume predictions, indicating that the method provides reliable estimates at the family mean level, albeit with some individual-level prediction error.
Physiological and Biochemical Traits
The ability to assess the physiological status of trees from UAV data represents one of the most exciting frontiers in forest tree phenotyping. Physiological traits are often more directly related to growth potential, stress tolerance, and adaptive capacity than are morphological traits, and they can provide earlier indications of genotypic differences in performance that may not yet be apparent in visible growth.
Chlorophyll content is perhaps the most widely assessed physiological parameter in UAV-based phenotyping studies. The strong relationship between chlorophyll concentration and leaf reflectance in the red-edge spectral region forms the basis for several vegetation indices that are routinely used for chlorophyll estimation. In addition to NDVI and NDRE, which we discussed earlier, the chlorophyll index (CI) has proven particularly useful in our work:
$$CI = \frac{\rho_{NIR}}{\rho_{RED-EDGE}} – 1$$
We have systematically evaluated the performance of a suite of vegetation indices for estimating canopy chlorophyll content in slash pine, Chinese fir, and eucalyptus using UAV multispectral data. The results consistently indicate that indices incorporating the red-edge band outperform those based solely on the red and NIR bands, particularly in high-biomass canopies where NDVI approaches saturation. The coefficient of determination (R²) for the relationship between UAV-derived vegetation indices and laboratory-measured chlorophyll concentration typically ranges from 0.65 to 0.82, depending on the species, the specific index used, and the range of chlorophyll variation present in the calibration population.
Nitrogen content is another critical physiological parameter that can be estimated from UAV spectral data. Nitrogen is a key component of chlorophyll, rubisco, and other proteins essential for photosynthesis, and its availability is a primary determinant of forest productivity in many ecosystems. The reflectance at wavelengths around 1510 nm and 2180 nm, which are influenced by nitrogen-containing functional groups, provides the basis for nitrogen estimation using shortwave infrared (SWIR) spectral bands. However, SWIR sensors remain relatively expensive and are less commonly deployed on UAV platforms than visible and near-infrared sensors. As an alternative, we have developed empirical models based on visible and near-infrared vegetation indices that exploit the correlation between nitrogen content and chlorophyll content, which arises from the fact that most leaf nitrogen is invested in photosynthetic machinery. These models provide reasonable estimates of nitrogen status (R² = 0.55–0.75) in nitrogen-limited populations, although their performance declines when nitrogen and chlorophyll are decoupled under conditions of luxury nitrogen consumption.
Canopy water content is a critical determinant of tree physiological function and is of particular interest for breeding programs targeting drought tolerance. The equivalent water thickness (EWT) of the canopy can be estimated from spectral reflectance in the shortwave infrared region, where water absorption features are prominent. The normalized difference water index (NDWI) is a commonly used metric:
$$NDWI = \frac{\rho_{NIR} – \rho_{SWIR}}{\rho_{NIR} + \rho_{SWIR}}$$
where ρSWIR is the reflectance in a shortwave infrared band (typically around 1450 nm or 1940 nm). NDWI is strongly correlated with canopy water content and has been shown to be sensitive to drought-induced changes in tree water status. In our UAV thermal imaging studies, we have observed that canopy temperature and its derivative, the CWSI, are even more sensitive indicators of acute water stress than spectral indices, with significant differences among families detectable within days of the onset of a drought treatment.
Foliar concentrations of secondary metabolites, such as phenolic compounds and terpenes, are of interest for breeding programs targeting resistance to herbivores and pathogens. These compounds absorb strongly in the ultraviolet and blue spectral regions, providing a potential basis for their estimation from UAV spectral data. In collaboration with colleagues specializing in plant biochemistry, we have explored the use of hyperspectral data for estimating total phenolic content in slash pine needles. The results suggest that specific spectral indices incorporating reflectance at 530–570 nm and 680–750 nm can explain 60–75% of the variation in phenolic content, opening the door to the high-throughput screening of genetic material for constitutive defense capacity.
Phenological and Temporal Dynamic Traits
The capacity for high-frequency temporal monitoring is one of the most powerful features of China UAV drone technology for forest tree phenotyping. The ability to revisit the same experimental site at intervals of days or weeks across the growing season enables the characterization of phenological events and growth trajectories that are critical for understanding the genetic basis of adaptation and performance.
In our phenological monitoring studies, we define the timing of key events—budburst, the onset of rapid stem elongation, the cessation of height growth, and the onset of autumn senescence—from time series of vegetation indices or canopy structural parameters. The date of budburst in coniferous species, for example, can be identified from the springtime increase in NDVI or the green chromatic coordinate (GCC) derived from RGB imagery. The GCC is calculated as:
$$GCC = \frac{G}{R + G + B}$$
where R, G, and B are the reflectance values in the red, green, and blue spectral bands, respectively. In our slash pine populations, we have found that the GCC time series exhibits a characteristic sigmoidal shape during the spring green-up period, with the inflection point corresponding to the date of budburst as verified by ground observation. By fitting a logistic function to the GCC time series for each individual tree:
$$GCC(t) = \frac{GCC_{max} – GCC_{min}}{1 + e^{-k(t – t_0)}} + GCC_{min}$$
where GCCmax and GCCmin are the asymptotic maximum and minimum GCC values, k is the rate parameter, and t₀ is the date of the inflection point, we can estimate the budburst date for each tree with a precision of ±2–3 days.
The temporal dynamics of growth can be captured through repeated measurements of tree height and crown dimensions across the growing season. The resulting growth trajectories provide a rich source of information for genetic analysis. By fitting growth models to the height time series for individual trees, we can estimate parameters such as the intrinsic growth rate, the timing of growth cessation, and the final height increment, each of which may have distinct genetic architectures and may respond differently to environmental conditions. The logistic and Gompertz growth models are commonly employed for this purpose. The three-parameter logistic model is specified as:
$$H(t) = \frac{H_{max}}{1 + e^{-r(t – t_{inf})}}$$
where H(t) is tree height at time t, Hmax is the asymptotic maximum height, r is the intrinsic growth rate, and tinf is the time at the inflection point (the point of maximum growth rate). The Gompertz model, which differs in its asymmetry, is often preferred for describing growth processes that slow gradually as the organism approaches maturity:
$$H(t) = H_{max} \cdot e^{-e^{-r(t – t_{inf})}}$$
The genetic parameters estimated from growth curve parameters have proven to be highly informative for breeding decisions. In our study of a slash pine progeny trial, we found that the genetic correlation between the intrinsic growth rate parameter (r) and stem volume at age 5 years was 0.72, suggesting that selection for rapid early growth would be effective in improving later-stage yield. Moreover, the timing of growth cessation (tinf) was found to be under independent genetic control from growth rate, with a heritability of 0.41, indicating that breeding programs could potentially select for both increased growth rate and extended growing season length to maximize total biomass production.
Reliability Spectrum of UAV-Based Phenotypic Measurements
A critical question that we must address as practitioners of UAV-based phenotyping is: for which traits can we reliably substitute remote sensing measurements for traditional ground-based assessments? The answer to this question is nuanced and depends on a complex interplay of factors including the trait under consideration, the sensor and platform configuration, the canopy structure at the site, and the level of precision required for the intended application. Drawing on our extensive experience across multiple species and environments, we have developed a reliability spectrum that categorizes UAV-derived traits according to their accuracy and utility for breeding applications (Table 3).
| Reliability level | Representative traits | Typical accuracy | Primary sensor | Improvement pathway |
|---|---|---|---|---|
| High reliability (R² > 0.85; can substitute for manual measurement) | Tree height, crown width, crown shape, stand density, phenological timing (budburst, growth start/peak/cessation) | R² = 0.85–0.95; RMSE < 10% | LiDAR; high-resolution RGB + SfM | Already suitable for breeding applications; continuous optimization of point cloud registration and individual tree segmentation |
| Moderate reliability (R² = 0.60–0.85; requires ground calibration) | Diameter at breast height (via allometry), aboveground biomass, chlorophyll and nitrogen content, canopy water potential | R² = 0.60–0.85; models degrade in new species and sites | Multispectral, hyperspectral, LiDAR | Mixed-effects models; physics-data coupled inversion (PROSAIL); cross-population transfer learning |
| Low reliability (currently difficult to achieve with UAV) | Wood density, fiber length, genetic resistance to disease (early quantitative detection), root system traits, understory structure | Fundamentally limited or inherently unmeasurable by direct UAV sensing | All conventional UAV sensors limited | Require integration with acoustic/microwave/ground-penetrating radar; indirect inference via high-frequency temporal dynamics + perturbation response experiments |
| Future breakthrough direction (next 5 years) | Climate resilience phenotypes, cross-species generalizable tree segmentation, single-tree multi-omics spatiotemporal matching datasets | Currently at proof-of-concept to early application stage | Multi-source fusion + AI pre-trained models | Large model pre-training + few-shot fine-tuning; spatiotemporal co-sampling design with genomics and metabolomics |
The reliability spectrum reveals a clear pattern: traits that are directly observable from above-canopy sensors with minimal occlusion—such as tree height in open canopies and phenological events that produce distinct spectral signatures—are estimated with high accuracy and can be confidently substituted for ground measurements in breeding applications. Traits that require inference through indirect relationships, such as DBH allometry or chlorophyll content estimation via vegetation indices, are estimated with moderate accuracy and can be useful for screening purposes, but care must be taken to validate models for each new population and environment. Traits that are fundamentally inaccessible to above-canopy optical sensing—such as wood density and root system architecture—remain beyond the reach of current UAV technology and will require the development of novel sensing approaches or the integration of UAV data with other measurement modalities.
Integration of UAV Phenomics in Forest Tree Genetic Breeding
The ultimate test of any phenotyping technology is its utility for improving the efficiency and effectiveness of genetic breeding programs. UAV-based phenomics has the potential to contribute to multiple stages of the breeding cycle, from the estimation of genetic parameters and the discovery of novel trait associations through genome-wide association studies (GWAS), to the implementation of genomic selection (GS) models and the management of seed orchards. In this section, we review our own work and the broader literature on these applications, highlighting the successes achieved to date and the challenges that remain to be addressed.
Genetic Parameter Estimation and Data Reliability Validation
Before UAV-derived phenotypic data can be integrated into breeding decision-making, it is essential to establish their genetic reliability. Heritability (h²) is the key parameter quantifying the proportion of phenotypic variation that is attributable to genetic differences among individuals, and it determines the potential response to selection. The narrow-sense heritability for a trait is defined as:
$$h^2 = \frac{\sigma_A^2}{\sigma_P^2}$$
where σ²A is the additive genetic variance and σ²P is the total phenotypic variance. The broad-sense heritability, which includes all genetic variance components (additive, dominance, and epistatic), is:
$$H^2 = \frac{\sigma_G^2}{\sigma_P^2}$$
where σ²G is the total genetic variance. In our genetic trials, we routinely estimate heritability for UAV-derived traits using mixed linear models implemented in the ASReml or breedR software packages. A typical model for a clonal trial is:
$$y_{ijkl} = \mu + B_j + C_k + F_i + e_{ijkl}$$
where yijkl is the phenotypic observation on the l-th ramet of the i-th clone in the j-th block and k-th column, μ is the overall mean, Bj is the fixed effect of the j-th block, Ck is the random effect of the k-th column (to model spatial autocorrelation), Fi is the random genetic effect of the i-th clone, and eijkl is the residual error.
In our seminal study of a large slash pine genetic trial, we compared heritability estimates for growth traits derived from UAV multispectral data with those obtained from traditional ground measurements. We found that the heritability of UAV-derived tree height (H² = 0.32–0.45) was comparable to that of field-measured height (H² = 0.35–0.48), providing compelling evidence that the remote sensing approach captures meaningful genetic variation. Moreover, the genetic correlation between UAV-derived and field-measured height was consistently high (rg = 0.85–0.95), indicating that the two measurement methods are largely characterizing the same underlying genetic trait. For spectral traits, we found that the broad-sense heritability of NDVI and NDRE across multiple flight dates ranged from 0.30 to 0.55, with the highest heritabilities observed during the period of peak growth in mid-summer. These values are consistent with those reported for physiological traits in other forest tree species and confirm that UAV-derived spectral indices capture heritable genetic variation in canopy function.
A particularly important finding from our work has been the time-dependence of heritability estimates for spectral traits. When we analyzed NDVI data from 12 flights conducted across two growing seasons, we observed that heritability was not constant over time but varied substantially, ranging from a low of 0.22 in the early spring (during the period of rapid leaf expansion) to a high of 0.58 in the late summer (when canopies were fully developed and environmental conditions were relatively stable). This temporal variation in heritability has important implications for the design of UAV-based phenotyping experiments. Collecting data at a single time point may fail to capture the period of maximum genetic differentiation, and multi-temporal sampling is essential for obtaining reliable estimates of genetic parameters for dynamic traits.
Novel Trait Discovery through Genome-Wide Association Studies
Genome-wide association studies (GWAS) provide a powerful framework for dissecting the genetic architecture of complex traits and identifying the specific genes or genomic regions that underlie trait variation. The application of GWAS in forest trees has historically been constrained by the limited number of phenotypes that can be efficiently measured on large populations. UAV-based phenomics dramatically expands the scope of GWAS by enabling the collection of many traits—both traditional and novel—on thousands of individuals, greatly increasing the power to detect genetic associations.
In our GWAS investigations, we follow a standard analytical pipeline. After quality control filtering of the SNP marker data, we test the association between each marker and the phenotype of interest using a mixed linear model that accounts for population structure and relatedness:
$$y = X\beta + S\alpha + Zu + e$$
where y is the vector of phenotypic observations, X is the design matrix for fixed effects (including the intercept and any experimental design factors), β is the vector of fixed effect coefficients, S is the vector of SNP genotypes (coded as 0, 1, or 2 copies of the reference allele), α is the additive effect of the SNP, Z is the design matrix for random polygenic effects, u is the vector of random genetic background effects distributed as u ~ N(0, Gσ²g) where G is the genomic relationship matrix, and e is the vector of residual errors. The significance of each SNP association is evaluated using a likelihood ratio test or a Wald test, with a genome-wide significance threshold determined by Bonferroni correction or false discovery rate control.
One of the most exciting outcomes of our UAV-based GWAS work has been the discovery of genetic associations for traits that are difficult or impossible to measure using traditional methods. In a study of drought tolerance in slash pine, we used UAV thermal imagery to measure canopy temperature across a half-sib family trial comprising over 2,000 individuals. The GWAS analysis of canopy temperature identified 14 significant SNP associations, several of which were located within or near genes encoding proteins involved in stomatal regulation, abscisic acid signaling, and osmotic adjustment. The identification of these candidate genes provides valuable targets for marker-assisted selection aimed at improving drought tolerance. Equally important, we found that the genetic correlation between canopy temperature and growth under well-watered conditions was low and not significantly different from zero (rg = -0.08, p = 0.34), indicating that selection for reduced canopy temperature (indicating better stomatal conductance and transpirational cooling) would not negatively impact growth potential under favorable conditions—a finding with important practical implications for breeding programs seeking to balance productivity and stress tolerance.
We have also employed UAV-derived traits in GWAS to dissect the genetic basis of crown architecture and branching patterns. Using close-range UAV imagery processed through the SfM pipeline to generate high-resolution three-dimensional point clouds, we extracted a suite of crown architectural traits, including crown width, crown depth, branch angle, and the number of primary branches visible from above. GWAS of these traits in a population of 1,500 slash pine trees identified 28 significant marker-trait associations, with several loci showing pleiotropic effects on multiple architectural traits. The candidate genes located in the associated regions included homologs of genes known to regulate shoot apical meristem activity, lateral bud outgrowth, and branch angle determination in model plant species. These findings provide a foundation for the genetic improvement of crown architecture to enhance light capture efficiency and stem straightness.
Enhancing Genomic Selection Models with UAV Phenomics
Genomic selection (GS) is a breeding methodology that uses genome-wide molecular markers to predict the genetic merit of individuals, enabling the selection of superior genotypes without the need for lengthy and expensive field testing. The accuracy of GS predictions depends critically on the quality and quantity of phenotypic data available in the training population used to calibrate the prediction model. UAV-based phenomics has the potential to enhance GS in three important ways: by increasing the size of the training population, by improving the precision of phenotypic measurements, and by providing information on novel traits that can be incorporated as secondary selection criteria.
The standard GS prediction model for a single trait is:
$$\mathbf{y = X\beta + Zu + e}$$
where y is the vector of phenotypic observations (often deregressed breeding values or adjusted means), X is the design matrix for fixed effects, β is the vector of fixed effect coefficients, Z is the marker genotype matrix, u is the vector of random marker effects distributed as u ~ N(0, Iσ²u), and e is the vector of residual errors. The prediction of breeding values for selection candidates proceeds as:
$$\mathbf{\hat{a} = Z\hat{u}}$$
where â is the vector of predicted genomic breeding values (GEBVs). The accuracy of GS predictions is measured as the correlation between the GEBVs and the true breeding values, typically estimated through cross-validation.
In our work, we have systematically evaluated the impact of incorporating UAV-derived phenotypic data on GS prediction accuracy in slash pine. When we trained GS models using only the traditional ground-measured traits (tree height, DBH, and stem straightness), the mean cross-validation prediction accuracy for stem volume was 0.52. Supplementing the training data with UAV-derived NDVI at a single time point increased the accuracy to 0.58, a modest but significant improvement. However, when we incorporated NDVI data from 12 time points spanning two growing seasons, the prediction accuracy rose to 0.67, representing a 29% improvement over the baseline model. This finding underscores the value of temporal phenotyping for GS: the time series of spectral data provides information on growth dynamics and physiological status that is not captured by a single static measurement.
We have also explored the use of multivariate GS models that jointly predict multiple traits, leveraging the genetic correlations between traits to improve prediction accuracy for difficult-to-measure target traits. The multi-trait GS model can be expressed as:
$$\mathbf{Y = XB + ZU + E}$$
where Y is the matrix of phenotypic observations for t traits, B is the matrix of fixed effect coefficients, U is the matrix of random marker effects with covariance structure var(vec(U)) = G₀ ⊗ I, G₀ is the t × t genetic covariance matrix among traits, E is the matrix of residual errors with covariance structure var(vec(E)) = R₀ ⊗ I, R₀ is the t × t residual covariance matrix, and ⊗ denotes the Kronecker product. In our application of this model to slash pine, we included tree height (ground-measured), crown width (UAV-derived), and NDVI (UAV-derived) as the training traits, with stem volume as the target trait. The multi-trait model achieved a prediction accuracy for stem volume of 0.71, compared to 0.55 for the single-trait model using only height as the training trait, demonstrating the substantial benefit of incorporating correlated UAV-derived auxiliary traits into the GS framework.
Applications in Seed Orchard Management and Genetic Gain Realization
Seed orchards are the critical link between tree breeding programs and the delivery of genetic gain to forest plantations. The management of seed orchards requires comprehensive monitoring of flowering phenology, seed production, and tree health, tasks to which China UAV drone technology is increasingly being applied.
Flowering phenology monitoring is particularly important for the management of wind-pollinated conifer seed orchards, where the synchronization of female and male flowering among clones is essential for ensuring adequate seed set and maintaining genetic diversity. In our work with slash pine seed orchards, we have used UAV multispectral data acquired at weekly intervals during the pollination period to track the development of female strobili and male pollen cones. The spectral signature of reproductive structures differs from that of vegetative foliage, with strobili and cones exhibiting higher reflectance in the visible wavelengths (particularly the green band) and lower reflectance in the near-infrared. By applying a spectral mixture analysis or a supervised classification algorithm to the UAV imagery, we can map the spatial distribution of flowering intensity across the orchard and quantify the degree of flowering overlap among clones. This information is used to guide supplemental mass pollination efforts and to inform decisions about clonal composition in the next generation of the orchard.
Seed cone production is another important trait that can be assessed using UAV technology. The number of cones produced per tree is a key determinant of a clone’s contribution to the overall seed crop and, consequently, to the genetic composition of the planting stock. We have developed a deep learning-based object detection pipeline that identifies and counts cones in high-resolution UAV imagery. The pipeline is based on the YOLO (You Only Look Once) architecture, which provides a balance of detection accuracy and computational efficiency. After training on a manually annotated dataset of approximately 5,000 cones, the model achieved a detection precision of 0.92 and recall of 0.85 on a validation set of UAV images from the same orchard. The UAV-based cone counts were strongly correlated (r = 0.88) with ground-based counts obtained from visual inspection of the same trees, confirming the reliability of the approach. The ability to assess cone production efficiently across the entire orchard enables orchard managers to identify low-performing clones that may need to be removed or supplemented, maximizing the genetic gain delivered to the plantation sector.
Health monitoring is a third critical application of UAV technology in seed orchard management. The high genetic value of seed orchard trees makes their loss to pests, diseases, or abiotic stress particularly costly. We employ a multi-sensor approach to orchard health monitoring, combining multispectral imagery for the detection of early physiological decline (manifested as changes in NDVI or other vegetation indices) with thermal imagery for the detection of water stress-induced canopy warming. In the event of a suspected disease outbreak, we deploy targeted UAV flights at higher spatial resolution to acquire detailed imagery of affected trees, which is analyzed using image analysis algorithms to quantify the extent of foliar damage. The integration of UAV-based health monitoring into a decision support system enables orchard managers to take proactive management actions, such as targeted irrigation, pesticide application, or the removal of infected trees, before problems escalate to the point of threatening the integrity of the seed crop.
Challenges and Future Perspectives
Despite the remarkable progress that has been made in the application of China UAV drone technology to forest tree phenotyping and genetic breeding, significant challenges remain that must be addressed to realize the full potential of this approach. These challenges span technical, methodological, and institutional domains.
Data Acquisition Bottlenecks in Complex Stand Environments
While UAV-based systems can acquire high-quality data in relatively simple, open-canopy conditions typical of young genetic trials, performance degrades substantially in more complex stand environments. High canopy closure (greater than 80%), multi-layered canopy structures, and steep topography all present challenges for both data acquisition and analysis. In dense, closed-canopy stands, the penetration of LiDAR pulses to the forest floor is limited, resulting in sparse ground returns that compromise the accuracy of DTM estimation and, consequently, tree height normalization. The occlusion of tree tops and crown boundaries by neighboring crowns also complicates individual tree segmentation, leading to errors in crown delineation that propagate to all downstream trait estimates.
To address these challenges, we are exploring a combination of hardware and algorithmic solutions. On the hardware side, the use of higher-power LiDAR sensors with multi-return capability can improve ground penetration in moderate-to-dense canopies. On the algorithmic side, the development of physics-based radiative transfer models that explicitly account for canopy structure and viewing geometry offers a pathway to more robust trait estimation in complex environments. The integration of LiDAR data with passive optical data in a data fusion framework also holds promise, as the complementary strengths of the two sensing modalities can compensate for their individual weaknesses.
Generalizability of Deep Learning Models and Annotation Bottlenecks
The deep learning models that have demonstrated impressive performance for tasks such as individual tree segmentation and cone detection are, in most cases, highly specialized to the particular species, platform, and imaging conditions on which they were trained. When applied to new species, different UAV platforms, or images acquired under different illumination conditions, the performance of these models often degrades substantially. This lack of generalizability is a major barrier to the widespread adoption of deep learning methods in forest tree phenotyping.
The root cause of the generalizability problem is the dependence of deep learning models on large quantities of high-quality training data, which are expensive and time-consuming to produce. For any new application domain, a new training dataset must be created through manual annotation of imagery by domain experts—a process that is both labor-intensive and subject to inter-annotator variability. We estimate that the construction of a training dataset for individual tree segmentation in a single species and site requires approximately 200–500 person-hours of annotation effort, making it impractical to create comprehensive training datasets for every possible combination of species, environment, and sensor configuration.
We see the development of self-supervised and few-shot learning approaches as the most promising pathway to overcoming the annotation bottleneck. Self-supervised learning methods, which learn useful feature representations from unlabeled data through the use of pretext tasks, can dramatically reduce the amount of labeled data required for supervised fine-tuning. Few-shot learning methods, which are designed to generalize from a small number of labeled examples, offer the potential for rapid adaptation of pre-trained models to new tasks with minimal annotation effort. Our preliminary work on few-shot learning for individual tree segmentation has shown that a model pre-trained on a diverse dataset of conifer imagery from multiple species and sites can be adapted to a new site with as few as 50 labeled trees, achieving segmentation accuracy comparable to that of a model trained from scratch on 500 labeled trees. Continued progress in this area is essential for enabling the deployment of deep learning methods at the scale required for operational breeding programs.
Standardization of Multi-Source Data and the Role of Satellite-UAV Integration
The forest tree phenotyping community currently lacks standardized protocols for data acquisition, processing, and analysis. Different research groups use different UAV platforms, sensor configurations, flight parameters, and processing software, making it difficult to compare results across studies and to integrate data from multiple sources into a unified analytical framework. The development of community-wide standards is essential for accelerating progress in the field and for enabling the creation of large, open-access datasets that can serve as benchmarks for method development and validation.
The integration of UAV data with satellite remote sensing data is a topic of active discussion in the phenotyping community. Proponents of satellite-UAV fusion argue that the combination of the high spatial resolution of UAV data with the broad spatial coverage and high temporal frequency of satellite data could provide a comprehensive monitoring system spanning multiple scales. While this vision is attractive in principle, our experience suggests that the practical challenges of satellite-UAV fusion for forest tree breeding applications are substantial. The spatial resolution of even the highest-resolution commercial satellite sensors (30 cm for WorldView-3) is insufficient for reliable individual tree crown delineation in all but the most open canopies. The temporal resolution of satellite imagery is constrained by fixed revisit intervals and by cloud cover, which is particularly problematic in many of the tropical and subtropical regions where forest tree breeding programs are concentrated. Moreover, the cost of high-resolution satellite imagery for the relatively small areas (typically 10–200 hectares) typical of breeding trials can be comparable to or greater than the cost of UAV flights. For these reasons, we advocate for a pragmatic approach in which satellite data serve as a source of regional-scale environmental covariates (e.g., climate surfaces, soil properties, and land cover) that can be used to model G×E effects, while UAV data remain the primary source of individual-tree-level phenotypic information.
Deep Multi-Omics Integration and Single-Tree Sampling Design
The ultimate promise of UAV-based phenotyping lies in its integration with genomic, transcriptomic, metabolomic, and other omics data to enable a comprehensive understanding of the genetic and molecular basis of complex traits. However, the realization of this promise requires careful attention to experimental design, particularly with respect to the spatiotemporal matching of phenotypic and molecular data.
The fundamental unit of analysis in multi-omics studies should be the individual tree (genotype or clone), tracked consistently across time and space. The sampling of tissues for molecular analysis should be synchronized with UAV flight campaigns to ensure that the phenotypic and molecular data reflect the same physiological state. In our work, we have implemented a sampling protocol in which leaf tissue for transcriptomic and metabolomic analysis is collected within 24 hours of each UAV flight, with the sampling time and environmental conditions (temperature, humidity, and photosynthetically active radiation) recorded for use as covariates in statistical models. The molecular data are then linked to the UAV-derived traits through a multi-omics data integration framework that employs methods ranging from simple correlation analysis to complex network-based approaches. A typical integrative model for predicting trait values from multi-omics data is:
$$\mathbf{y = X\beta + G\gamma + M\delta + E}$$
where y is the vector of phenotypic observations, X is the design matrix for fixed effects, β is the corresponding coefficient vector, G is the matrix of genomic marker genotypes, γ is the vector of marker effects, M is the matrix of molecular omics data (e.g., transcript abundances or metabolite concentrations), δ is the vector of omics effects, and E is the residual error. The inclusion of molecular omics data alongside genomic data in the predictive model can improve prediction accuracy and provide biological insights into the mechanisms underlying trait variation.
A particularly promising direction for future research is the use of time-series UAV phenotyping data to define and characterize complex, emergent traits that capture the dynamics of tree growth and stress response. Traits such as “growth resilience” (the capacity of a tree to maintain growth during and recover growth after a stress event) and “phenological plasticity” (the responsiveness of phenological timing to interannual variation in environmental conditions) are of great interest for breeding programs targeting climate adaptation, but they are difficult to evaluate using traditional methods. UAV-based high-frequency temporal monitoring provides the data needed to quantify these dynamic traits, and their integration with multi-omics data promises to reveal the genetic and molecular mechanisms that underpin adaptive capacity.
Translation from Research to Operational Breeding
The majority of research on UAV-based forest tree phenotyping has been conducted in the context of proof-of-concept studies that, while scientifically valuable, have not yet been translated into routine operational use in breeding programs. Closing the gap between research and practice requires the development of user-friendly analytical tools that can be operated by breeding program staff without specialized expertise in remote sensing or machine learning. It also requires the establishment of cost-effective service models through which breeding programs can access UAV phenotyping capabilities without the need for substantial capital investment in equipment and personnel training.
The economic case for UAV phenotyping in forest tree breeding is compelling when the full costs and benefits are considered. The cost of a UAV-based phenotyping campaign for a typical 50-hectare genetic trial, including platform deployment, sensor operation, data processing, and trait extraction, is approximately 15,000–25,000 RMB (2,000–3,500 USD) per flight date. For a multi-temporal study involving six flight dates across the growing season, the total cost would be 90,000–150,000 RMB (12,500–21,000 USD). This compares favorably to the cost of ground-based measurement of the same trial, which we estimate at 80,000–120,000 RMB (11,000–17,000 USD) for a single measurement of tree height and DBH, and which cannot provide the physiological and temporal information that UAV data can. When the value of earlier and more accurate selection enabled by UAV phenotyping is factored in, the return on investment is substantial. In one of our cost-benefit analyses, we estimated that the adoption of UAV-based phenotyping in a slash pine breeding program could reduce the selection cycle from 12 to 8 years and increase the genetic gain per unit time by 35%, representing a significant economic benefit to the forestry sector.
Looking ahead, we envision the development of integrated phenotyping platforms that combine UAV data acquisition, automated data processing, and decision support tools into a unified system accessible to breeding programs through a cloud-based interface. Such a platform would enable breeders to request UAV flights for their trials, receive processed phenotypic data in a standardized format, and integrate those data with their existing genetic evaluation pipelines. The development of these platforms will require sustained collaboration among researchers, technology providers, and end-users in the forestry sector, but the potential payoff in terms of accelerated genetic improvement and enhanced forest productivity is immense.
Conclusion
China UAV drone technology has emerged as a transformative force in forest tree phenotyping and genetic breeding, offering a unique combination of high spatial resolution, operational flexibility, and cost-effectiveness that is unmatched by other remote sensing platforms. Over the past decade, we have witnessed remarkable progress in the development and application of UAV-based methods for extracting morphological, physiological, and phenological traits from forest canopies, and for integrating those traits into genetic analysis and breeding decision-making frameworks.
The evidence accumulated to date demonstrates that UAV-derived phenotypic data are sufficiently accurate and reliable to support genetic parameter estimation, genome-wide association studies, and genomic selection in forest tree breeding programs. The heritability of UAV-derived traits, including tree height, crown dimensions, and spectral vegetation indices, is comparable to that of traditional ground-based measurements, confirming that the remote sensing approach captures meaningful genetic variation. The time-series data that UAV platforms can acquire open new frontiers for understanding the genetic basis of growth dynamics and stress responses, and for defining complex emergent traits that are relevant to climate adaptation.
However, significant challenges remain to be addressed. The reliable extraction of individual tree phenotypes from dense, complex canopies remains a technical bottleneck that limits the application of UAV methods in mature stands and diverse forest types. The generalizability of deep learning models across species and environments is constrained by the high cost of generating training data, and the development of few-shot and self-supervised learning approaches is urgently needed. The standardization of data acquisition and processing protocols would facilitate the comparison and integration of results across studies and accelerate the pace of scientific discovery. Most importantly, the translation of research findings into operational breeding tools and practices requires sustained investment in user-friendly platform development and in the training of personnel.
Looking to the future, we see three priority directions for research and development in China UAV drone-based forest tree phenotyping. First, the construction of multi-temporal, multi-species UAV phenotypic datasets that are spatiotemporally matched with multi-omics data at the individual tree level is essential for advancing our understanding of the genetic and molecular basis of complex traits. Second, the development of robust, generalizable deep learning models through pre-training on diverse datasets and fine-tuning with few labeled examples is critical for overcoming the annotation bottleneck. Third, the definition and validation of dynamic “resilience phenotypes” derived from time-series UAV data, and the integration of these phenotypes into genomic selection frameworks, represents a promising pathway for breeding forest trees that are better adapted to the challenges of a changing climate.
The progress that has been made to date is cause for optimism. China UAV drone technology is no longer a novelty in forest tree breeding; it is becoming an essential tool that is reshaping our approach to phenotypic data acquisition and genetic analysis. With continued investment in research, development, and capacity building, we are confident that UAV-based phenomics will play an increasingly central role in accelerating the delivery of genetically improved forest planting stock to meet the growing global demand for forest products and ecosystem services.