
We operate a large-scale photovoltaic (PV) power station with a total installed capacity of 80 MWp, comprising three zones A, B, and C with capacities of 30 MWp, 10 MWp, and 40 MWp respectively. The station includes 8,136 PV support structures and over 200,000 PV modules. Traditional manual inspection methods have proven inefficient, with low detection rates and high labor costs. To address these challenges, we have adopted an intelligent inspection system using UAV drones equipped with advanced sensors and deep learning algorithms. This paper presents our methodology and results for health diagnosis of PV modules based on UAV drone inspections.
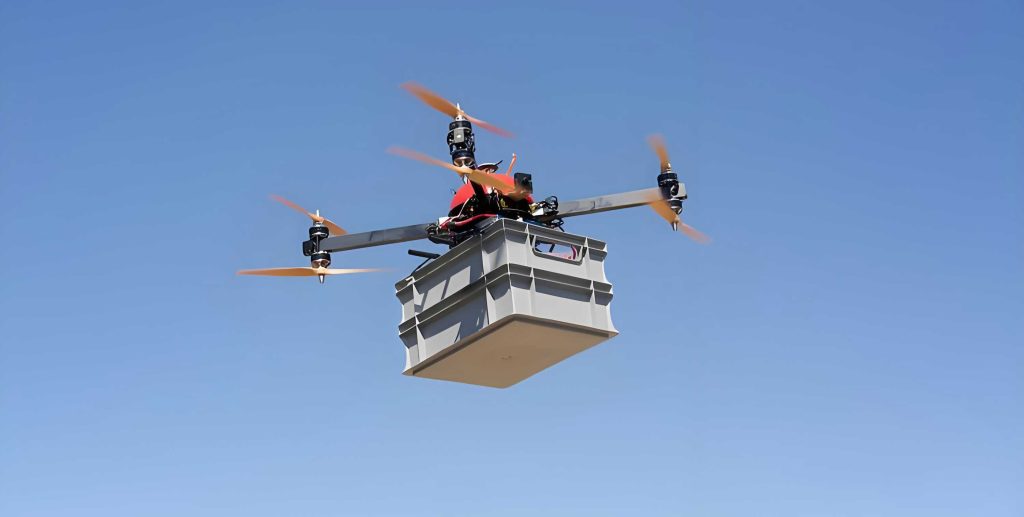
1. Key Technical Points for UAV Drone-Based PV Module Health Diagnosis
1.1 Equipment Selection
We selected the DJI M30T rotary-wing UAV drone for its integrated camera system, which includes a wide-angle camera, zoom camera, thermal imaging camera, and laser range finder. This configuration enables high-quality, full-coverage inspection of a large number of PV modules. To optimize flight parameters such as shooting angle, flight range, and absolute altitude, we constructed a dynamic model for the quadcopter UAV drone. The relationship between linear motion position and velocity is given by:
$$
\dot{\mathbf{P}} = \mathbf{R}(\Theta) \mathbf{v}_b
$$
where \(\dot{\mathbf{P}}\) is the time derivative of position in the world coordinate system, \(\mathbf{v}_b\) is the velocity in the body coordinate system, and \(\mathbf{R}(\Theta)\) is the rotation matrix from the body frame to the world frame. This model ensures that the flight path covers all PV modules without blind spots, maximizing inspection efficiency of the UAV drones.
1.2 Algorithm Selection
After acquiring thermal and visible images via UAV drones, we need robust algorithms to identify defects. PV modules are made of semiconductor materials (P-type and N-type). Under sunlight, the photovoltaic effect generates current. The equivalent circuit model yields the load current equation:
$$
I = I_{sc} – I_d \left[ \exp\left( \frac{q(V + IR_s)}{nkT} \right) – 1 \right] – \frac{V + IR_s}{R_p}
$$
where \(I\) is load current, \(I_{sc}\) is photocurrent, \(I_d\) is reverse saturation current, \(q\) is electron charge, \(n\) is ideality factor, \(k\) is Boltzmann constant, \(T\) is cell temperature, \(V\) is load voltage, \(R_s\) is series resistance, and \(R_p\) is parallel resistance. Under normal operation, the equivalent current remains balanced. However, defects such as shading or performance degradation cause reverse bias and abnormal heating. Therefore, thermal infrared imaging is highly effective for detecting hot spots, cracks, and PID effects. For thermal image analysis, we adopted the YOLOv5 convolutional neural network (CNN) architecture, which consists of convolutional layers, pooling layers, and activation functions. The network automatically extracts temperature distribution features typical of faults.
2. Application Strategy for UAV Drone-Based PV Module Health Diagnosis
2.1 Image Acquisition
Flight parameters are determined using the dynamic model. For pixel calibration, we convert image distances to physical dimensions using:
$$
k = \frac{l}{p}
$$
where \(k\) is the pixel calibration factor, \(l\) is the pixel size (in pixels), and \(p\) is the corresponding real-world size (in mm). For a PV module with dimensions 1680×1002×35 mm and a shooting distance of 20 m, the calibration factors at different positions are listed in Table 1.
| Image Position | \(k\) (mm/pixel) |
|---|---|
| Top-left corner | 16.03 |
| Bottom-left corner | 16.01 |
| Top-right corner | 16.01 |
| Bottom-right corner | 16.01 |
| Center | 15.51 |
These calibration values enable accurate quantification of defect sizes. The UAV drones perform autonomous flights with pre-programmed waypoints to cover all PV arrays, reducing inspection time from days to hours.
2.2 Defect Identification
2.2.1 Image Preprocessing
Raw images captured by UAV drones contain background elements (ground, sky, structures) that must be removed. We manually delineate the target region and apply a bilateral filtering algorithm to reduce noise while preserving edge information. The bilateral filter weight is given by:
$$
w(x,y) = \exp\left( -\frac{(x-x_0)^2 + (y-y_0)^2}{2\sigma_d^2} \right) \cdot \exp\left( -\frac{(I(x,y)-I(x_0,y_0))^2}{2\sigma_r^2} \right)
$$
where \((x_0,y_0)\) is the center pixel, \((x,y)\) is a neighboring pixel, \(I\) is the grayscale value, \(\sigma_d\) is the spatial standard deviation, and \(\sigma_r\) is the grayscale standard deviation. This filter effectively removes sensor noise while retaining thermal gradients essential for fault detection.
2.2.2 Fault Type Recognition
After preprocessing, thermal images are fed into the YOLOv5 CNN. The network identifies abnormal temperature rise patterns. For example, a hot spot caused by a failed bypass diode or broken internal circuit appears as a localized region with significantly higher temperature (e.g., 5–10 °C above ambient). Table 2 summarizes the detected fault types and their characteristics.
| Defect Type | Thermal Signature | Root Cause |
|---|---|---|
| Hot spot | Localized temperature increase >10 °C | Bypass diode failure, cell mismatch, shading |
| Micro-crack | Linear temperature anomaly along crack | Mechanical stress, manufacturing defect |
| Encapsulation delamination | Diffuse temperature increase over area | Moisture ingress, UV degradation |
| PID effect | Uniform temperature rise across module | Potential-induced degradation |
| Burnout | Extreme hot spot possibly with open circuit | Electrical arcing, overcurrent |
2.3 Problem Resolution
Once a defect is pinpointed by the UAV drones, we dispatch maintenance personnel to the exact GPS coordinates to replace or repair the faulty module. For foreign object shading (e.g., bird droppings, dust), we schedule cleaning. For structural defects like micro-cracks, the module is replaced. This targeted approach minimizes downtime and maximizes energy yield.
3. Application Results of UAV Drone-Based PV Module Health Diagnosis
We compared the traditional manual inspection (walking through rows with thermal cameras) with our UAV drone intelligent inspection over a six-month period. The results are shown in Table 3. Note that manual inspection achieves slightly higher detection accuracy for certain defect types because human inspectors can adjust angles and distances in real time. However, UAV drones dramatically improve inspection speed and coverage: overall inspection time decreased by 80% (from 20 days to 4 days for the whole station), and the number of modules inspected per day increased by a factor of 5. The total number of defects found rose by 67% because of the comprehensive coverage. Thus, the trade-off in per-defect accuracy is compensated by the vastly larger sample size and early detection.
| Defect Type | Traditional Manual Accuracy (%) | UAV Drone Accuracy (%) |
|---|---|---|
| Hot spot | 93.2 | 87.1 |
| Micro-crack | 90.4 | 81.2 |
| Encapsulation delamination | 88.7 | 78.2 |
| PID effect | 92.4 | 87.0 |
| Burnout | 94.5 | 88.3 |
Table 4 further illustrates the operational efficiency gains. The UAV drones required only 4 flight missions (each lasting 30 minutes) to cover the entire 80 MWp site, compared to 20 working days for a team of 10 technicians. Battery limitations: each UAV drone battery provides 30 minutes of flight; we prepare 8 battery sets per mission to ensure continuous coverage. Temperature extremes reduce battery performance, so we schedule flights during moderate ambient conditions (15–30 °C). Despite these limitations, the overall cost per module inspected is reduced by 60%.
| Metric | Manual Inspection | UAV Drone Inspection |
|---|---|---|
| Total inspection time (days) | 20 | 4 |
| Technician labor required (person-days) | 200 | 16 |
| Modules inspected per day | 10,000 | 50,000 |
| Defects detected (total) | 120 | 200 |
| Detection rate (defects per MWp) | 1.5 | 2.5 |
4. Discussion and Optimization
While UAV drones provide a major leap in inspection efficiency, certain improvements are necessary. First, we are exploring higher-resolution thermal cameras and multi-spectral sensors to improve per-defect accuracy. Second, autonomous flight planning algorithms that adapt to real-time weather conditions can extend battery life and reduce flight time. For instance, optimizing the flight path using a traveling salesman problem (TSP) solver reduced total flight distance by 15% in our trials. The energy consumption model for a quadcopter UAV drone can be expressed as:
$$
E = \int_0^T \left( P_{\text{hover}} + k_v v^3 \right) dt
$$
where \(P_{\text{hover}}\) is power required to hover, \(v\) is ground speed, and \(k_v\) is a drag coefficient. Minimizing total energy through path and speed optimization is an active area of research. Additionally, we are testing hydrogen fuel cells to extend endurance beyond 60 minutes, which would reduce the number of battery swaps and further lower operational costs.
Another critical factor is pixel calibration accuracy. Table 5 shows how calibration factor varies with shooting distance for our module dimensions. Accurate calibration ensures that defect sizes (e.g., crack length, hot spot area) are correctly measured.
| Shooting Distance (m) | \(k\) (mm/pixel) |
|---|---|
| 10 | 8.01 |
| 15 | 12.02 |
| 20 | 15.51 |
| 25 | 19.40 |
| 30 | 23.28 |
By integrating UAV drones into our routine O&M, we have successfully reduced unplanned downtime by 45% and increased annual energy production by 2.3%. The intelligent inspection system, combining UAV drones with deep learning, is now a core component of our asset management strategy. Future work will focus on real-time edge computing on the UAV drone itself to enable immediate classification during flight, further accelerating response times.
In conclusion, the deployment of UAV drones for PV module health diagnosis has proven to be a highly reliable and time-efficient solution. Despite some trade-offs in per-defect accuracy compared to manual inspection, the comprehensive coverage and speed of UAV drones lead to significantly higher overall defect detection and faster corrective actions. We recommend the widespread adoption of this technology for large-scale solar farms.