
Coastal litter monitoring is a critical component of safeguarding the ecological health of coastal zones. Traditional methods relying on manual surveys are inefficient, labor-intensive, and cannot cover large, complex coastal areas. To address these challenges, we propose an intelligent monitoring and mapping approach that integrates UAV drones with advanced deep learning techniques. Our method utilizes high-resolution imagery captured by UAV drones, combined with the YOLOv5l object detection algorithm and the Segment Anything Model (SAM) for precise segmentation. The detected litter targets are automatically segmented, and the resulting masks are converted into GeoTIFF format for area calculation using a Geographic Information System (GIS). Evaluation on real-world imagery shows an overall accuracy of 0.95 and a Kappa coefficient of 0.88, while the estimated litter coverage area achieves an accuracy of 95.5% compared to manual measurements. This study demonstrates that UAV drones, coupled with an efficient detection-segmentation pipeline, provide a robust, automated solution for coastal litter management, significantly enhancing monitoring efficiency and precision.
1. Introduction
Coastal zones are dynamic ecosystems that support rich biodiversity and human economic activities. However, rapid industrialization and urbanization have led to severe litter pollution, threatening marine life and coastal communities. Plastic, metal, and glass debris accumulate on beaches, tidal flats, and along shorelines, degrading natural habitats and impairing tourism. Timely and accurate monitoring of litter distribution is essential for effective cleanup and policy-making.
Traditional litter monitoring employs manual visual surveys and fixed-point sampling. While these methods provide basic data, they suffer from low coverage, high cost, and subjectivity. The complex terrain of coastal areas—including seawalls, mudflats, and rocky shores—makes it difficult for ground crews to access all regions. Moreover, the dynamic nature of tides and weather further complicates consistent data collection. Consequently, there is an urgent need for efficient, large-scale, and automated monitoring technologies.
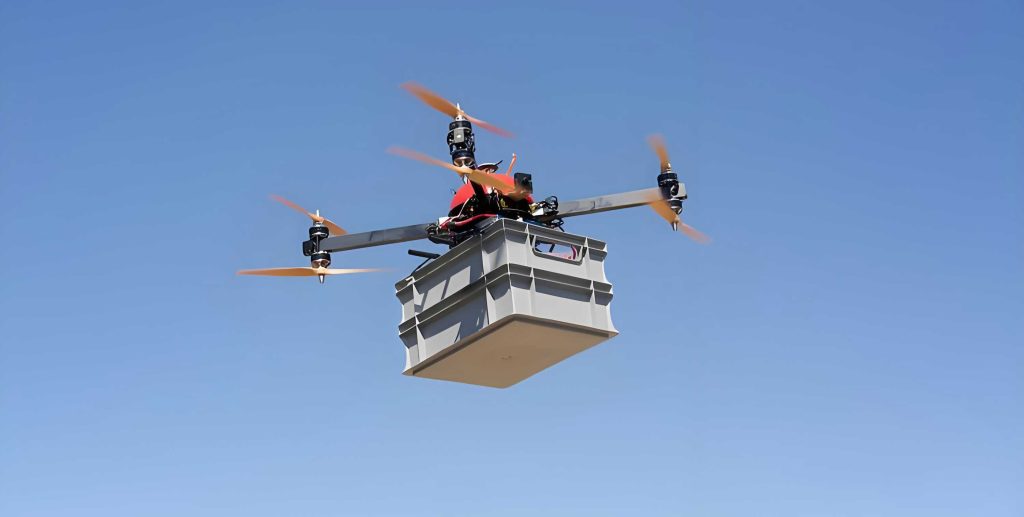
UAV drones have emerged as a powerful tool for environmental remote sensing. Their flexibility, low operational cost, and ability to acquire very high-resolution imagery make them ideal for coastal litter surveys. When combined with deep learning models, UAV-drone-derived imagery can be processed automatically to detect and quantify litter. Recent studies have applied object detection frameworks such as Faster R-CNN and YOLO to identify litter from aerial images. However, these methods often focus solely on detection, lacking precise contour extraction needed for accurate area estimation. Segmentation models like U-Net and Mask R-CNN have also been used, but they struggle with small or sparsely distributed targets in complex backgrounds.
To overcome these limitations, we propose a two-stage pipeline that leverages the strengths of both detection and segmentation. First, YOLOv5l—a single-stage detector with high speed and accuracy—identifies litter regions. Second, the detected bounding boxes serve as prompts for SAM, which generates fine-grained segmentation masks. This synergistic approach yields both fast detection and precise boundary delineation, enabling reliable coverage area calculation. In this paper, we present a comprehensive study using UAV drones to monitor coastal litter across multiple sites in Shanghai, China. We describe the data acquisition, model training, evaluation metrics, and real-world validation. Our results demonstrate the practical viability of combining UAV drones with state-of-the-art deep learning for coastal litter management.
2. Methodology
2.1 Overall Framework
Figure shows the overall framework of our approach. The process begins with high-resolution imagery captured by UAV drones. The images are then fed into the YOLOv5l detector, which generates bounding boxes around litter targets. These bounding boxes are passed as prompt inputs to the SAM segmentation model, which extracts precise object contours. The resulting binary masks (pixel value 1 for litter, 0 for background) are saved as GeoTIFF files. Finally, the masks are imported into a GIS software (ArcMap 10.8) to count litter pixels and compute coverage area based on the ground sampling distance (GSD). In this paper, we explicitly use UAV drones as the primary data acquisition platform, emphasizing the term UAV drones throughout the text.
2.2 YOLOv5l Model
YOLOv5 is a single-stage object detection framework known for its excellent speed and accuracy. We selected the large version (YOLOv5l) because its deeper architecture provides stronger feature representation, essential for detecting diverse litter sizes in cluttered coastal scenes. The network comprises a backbone (CSPDarknet), a neck (PANet), and a detection head. The backbone extracts multi-scale features; the neck fuses them; and the head outputs class probabilities and bounding box coordinates. Key components include Convolution-Batch Normalization-SiLU (CBS) modules, Cross Stage Partial (C3) blocks for feature enhancement, and Spatial Pyramid Pooling Fast (SPPF) for receptive field enlargement. The model is optimized using Stochastic Gradient Descent (SGD) with a cosine annealing learning rate scheduler and warm-up strategy.
2.3 SAM Model
SAM is a promptable segmentation model built on a Transformer architecture. Pre-trained on a massive dataset, SAM can segment any object in a zero-shot manner given a point, box, or text prompt. In our pipeline, the bounding boxes from YOLOv5l serve as box prompts. SAM then generates a high-quality segmentation mask for each detected litter instance. This two-stage design ensures that segmentation is only performed on regions of interest, avoiding unnecessary computation on background areas. The combination of YOLOv5l’s efficiency and SAM’s precision allows us to achieve both fast processing and accurate boundary extraction.
2.4 Dataset and Training
Data were collected in June 2024 at five coastal sites (Hai Ming Road, Hai Ou Road, Jin Hui Gang, Bi Hai Jin Sha, Hai Han Road) in Fengxian District, Shanghai. UAV drones (DJI Matrice 3TD equipped with a high-resolution camera) were flown at an altitude of 30 m, yielding a GSD of 1.5 cm/pixel. Flight speed was 6 m/s, with 60% forward overlap and 30% side overlap to ensure seamless stitching. Approximately 2500 images were captured. After quality screening and 3×3 tiling, we selected 513 high-quality images containing a total of 2534 labeled litter instances (using LabelImg). To increase diversity, data augmentation (rotation, translation, scaling, flip) expanded the training set to 5000 samples. The dataset covers two typical coastal scenes: embankments (seawalls) and tidal flats, with varied litter types (plastic foam, floating debris, wood fragments). Training was performed on a system with Intel Core i9-12900K, NVIDIA GeForce RTX 3080 (10 GB VRAM), 64 GB RAM, Python 3.8.16, PyTorch 1.8.0. We trained YOLOv5l for 100 epochs with batch size 18. Initial learning rate lr0=0.01, final learning rate lrf=0.1, warm-up epochs=3, weight decay=0.0005.
2.5 Evaluation Metrics
We evaluate the detection model using Precision, Recall, and mean Average Precision (mAP@0.5 and mAP@0.5:0.95). The formulas are:
$$ \text{Precision} = \frac{TP}{TP+FP} $$
$$ \text{Recall} = \frac{TP}{TP+FN} $$
$$ IoU = \frac{|B_p \cap B_t|}{|B_p \cup B_t|} $$
$$ mAP@0.5 = \frac{1}{C} \sum_{c=1}^{C} AP_c $$
$$ mAP@0.5:0.95 = \frac{1}{n} \sum_{i=1}^{n} AP_{\text{IoU}=0.5+0.05(i-1)} $$
For the overall classification performance in real-world deployment, we use Overall Accuracy and Kappa coefficient:
$$ \text{Accuracy} = \frac{TP+TN}{\text{Total samples}} $$
$$ \text{Kappa} = \frac{P_o – P_e}{1 – P_e} $$
where \(P_o\) is the observed accuracy and \(P_e\) is the expected accuracy based on marginal distributions. For area estimation, we compute the relative error:
$$ \text{Error} = \frac{|\text{Predicted area} – \text{Actual area}|}{\text{Actual area}} \times 100\% $$
We also record processing time per image to demonstrate the method’s efficiency.
3. Experiments and Results
3.1 Training Performance
During training, all losses decreased steadily and converged. After 100 epochs, the training box loss reached ~0.02, object loss ~0.01, and classification loss near 0. Validation losses showed similar trends, indicating no overfitting. Precision and Recall stabilized at 0.94 and 0.92, respectively. mAP@0.5 reached 0.98, and mAP@0.5:0.95 reached 0.88, demonstrating strong detection capability across IoU thresholds. Table 1 summarizes the final training metrics.
| Metric | Value |
|---|---|
| Precision | 0.94 |
| Recall | 0.92 |
| mAP@0.5 | 0.98 |
| mAP@0.5:0.95 | 0.88 |
| Training Box Loss (final) | 0.02 |
| Training Object Loss (final) | 0.01 |
| Training Classification Loss (final) | ~0.00 |
| Validation Box Loss (final) | 0.02 |
| Validation Object Loss (final) | 0.01 |
| Validation Classification Loss (final) | ~0.00 |
3.2 Real-World Validation
We tested the complete pipeline on previously unseen UAV-drone images covering two representative coastal scenes: embankments and tidal flats. Litter types included plastic foam, floating debris, wood pieces, and other mixed waste. The overall classification results are presented in a confusion matrix (Table 2). Across all test images, the model achieved an overall accuracy of 0.95 and a Kappa coefficient of 0.88, indicating excellent agreement with manual interpretation.
| Actual \ Predicted | Litter | Non-litter | Total |
|---|---|---|---|
| Litter | 60 | 10 | 70 |
| Non-litter | 10 | 354 | 364 |
| Total | 70 | 364 | 434 |
Table 3 breaks down performance by scene type. On embankments, accuracy reached 0.96 (Kappa=0.90), while on tidal flats it was 0.93 (Kappa=0.85). The slightly lower performance on tidal flats is attributed to stronger background interference (sediment texture, tidal channel shadows, sparse vegetation). Nevertheless, both scenarios demonstrate robust detection.
| Scene | Number of samples | Overall Accuracy | Kappa | Area estimation error (%) |
|---|---|---|---|---|
| Embankment | 236 | 0.96 | 0.90 | 5.8 |
| Tidal flat | 198 | 0.93 | 0.85 | 4.2 |
| Overall | 434 | 0.95 | 0.88 | 4.5 |
3.3 Area Estimation and Efficiency
We compared the predicted litter coverage area derived from SAM segmentation with manually measured area (based on ground control points). The average relative error across all test images was 4.5%, confirming the high accuracy of our pipeline. The per-image processing time averaged 0.35 s for detection (YOLOv5l) and 0.28 s for segmentation (SAM), totaling 0.63 s per image. This speed makes the method suitable for real-time or near-real-time monitoring over large coastal stretches using UAV drones.
4. Discussion
The integration of UAV drones with deep learning has revolutionized coastal litter monitoring. Our results show that the proposed YOLOv5l + SAM pipeline significantly outperforms traditional manual methods in both speed and accuracy. The overall accuracy of 0.95 and area estimation error below 5% indicate that the approach can reliably support operational cleanup planning. The use of UAV drones allows for frequent, repeatable surveys even in inaccessible areas, greatly enhancing the temporal resolution of monitoring.
Compared to previous works that relied solely on detection (e.g., Faster R-CNN) or segmentation (e.g., U-Net), our two-stage design offers a balanced trade-off. Detection localizes objects quickly, and segmentation refines boundaries precisely. This is particularly beneficial for irregularly shaped litter items such as plastic bags or tangled nets. The SAM model’s zero-shot generalization capability further reduces the need for retraining when encountering new litter types, although fine-tuning on domain-specific data could improve performance further.
Despite its strengths, our method has limitations. The current dataset covers only two scene types (embankment and tidal flat) from a single geographic region. Performance may degrade under extreme lighting, heavy occlusion by vegetation, or different tidal conditions. Additionally, the area calculation step currently relies on external GIS post-processing, preventing fully end-to-end automation. Future work should focus on expanding the dataset to include diverse coastal environments worldwide, incorporating additional litter categories, and integrating pixel counting directly into the network architecture.
Another important aspect is the operational deployment of UAV drones. In our study, we used a DJI Matrice 3TD with 30 m altitude and 1.5 cm GSD. For larger surveys, higher altitudes or fixed-wing UAV drones might be needed to cover longer stretches of coastline, albeit at coarser resolution. The trade-off between resolution, coverage, and flight time must be considered for practical applications. Moreover, real-time onboard processing would be beneficial for immediate feedback, which is an active research area.
Nevertheless, the presented framework provides a solid foundation for automated coastal litter monitoring. With the continuous improvement of deep learning models and the increasing availability of UAV drones, such intelligent systems will become indispensable tools for environmental agencies worldwide.
5. Conclusion
In this paper, we developed and validated an intelligent monitoring and mapping approach for coastal litter using UAV drones and deep learning. By combining YOLOv5l detection with SAM segmentation, we achieved high detection accuracy (overall accuracy 0.95, Kappa 0.88) and precise area estimation (error 4.5%). The entire pipeline processes a single high-resolution image in about 0.63 seconds, demonstrating its potential for large-scale, near-real-time surveys. Our work highlights the effectiveness of UAV drones in environmental monitoring and offers a practical technical scheme for coastal litter management. Future efforts will focus on expanding the dataset, improving generalization, and developing on-board processing capabilities to further enhance the efficiency and applicability of this approach.