The rapid advancement of remote sensing technologies has fundamentally transformed the way we approach engineering surveys, particularly in the context of railway infrastructure projects. As a participant in the Baoji-Chengdu railway capacity expansion project, I had the opportunity to lead the implementation of an integrated UAV LiDAR survey system that addressed numerous challenges inherent to mountainous terrain surveying. This article presents a comprehensive account of our methodology, technical workflow, and empirical findings, demonstrating how the synergy between UAV drones and LiDAR sensors revolutionizes railway engineering surveys.
China’s railway network has expanded to 162,000 kilometers by the end of 2024, with conventional railways accounting for 70.4 percent of the total length. The development focus has progressively shifted from new construction to a balanced emphasis on both new lines and renovation of existing infrastructure. Railway renovation projects demand simultaneous surveys of existing lines and newly planned segments. Traditional manual survey methods, however, exhibit significant limitations in complex terrain conditions, struggling to meet modern requirements for efficiency and precision.
The integration of UAV drones with LiDAR technology has emerged as a transformative solution in railway survey engineering. Compared with conventional approaches, this technology offers three distinct advantages. First, survey efficiency improves dramatically. Fixed-wing UAV drones can cover tens of square kilometers in a single flight, while multi-rotor UAV drones can survey several square kilometers per mission, substantially reducing field operation time. Second, measurement accuracy reaches centimeter levels without blind spots. UAV drones equipped with RTK or PPK modules achieve planar accuracy at the centimeter level, which can be further improved to better than two centimeters after target correction. The LiDAR sensor penetrates vegetation to capture ground surface data, effectively resolving issues related to data acquisition in vegetated areas. Third, operational safety and economic efficiency are significantly enhanced. UAV drones replace human surveyors in hazardous zones, eliminating personnel safety risks while reducing overall project costs.
Project Background and Technical Challenges
The Baoji-Chengdu railway, specifically the Baoji to Yangpingguan section, is a single-track line spanning 268.3 kilometers through Shaanxi and Gansu provinces. The route originates in Baoji City, traverses the Qinling Mountains along the Qingjiang River valley, follows the Jialing River southward through Liangdang County and Hui County in Gansu, then continues through Lueyang and Ningqiang counties in Shaanxi before reaching Yangpingguan Station. This railway segment faces three critical issues: first, the original construction standards are low, with single-track sections having only 650-meter arrival-departure lines, resulting in insufficient transport capacity that cannot meet growing demand; second, geological hazards and structural defects threaten operational safety; third, multiple bottlenecks exist where line capacity, station capacity, and equipment capability are mismatched, constraining overall transport efficiency.
The survey requirements for this renovation project encompassed two primary tasks: comprehensive re-survey of the existing railway to assess current conditions, and topographic survey of new alignment segments to acquire spatial data for engineering design. The terrain along the railway corridor is extremely complex, featuring steep mountain slopes, deep valleys, dense vegetation, and frequent geological hazards. Traditional survey methods relying on total stations, GPS rovers, and manual leveling proved inadequate in such conditions, with field teams struggling to access cliff faces, traverse dense undergrowth, and maintain safety in landslide-prone areas.
Our team recognized that the deployment of UAV drones equipped with LiDAR sensors offered a viable solution to these challenges. The ability to capture high-density point cloud data from an aerial platform, combined with the penetration capability of laser pulses through vegetation canopy, made this technology particularly suitable for the mountainous terrain characteristic of the Baoji-Chengdu railway corridor.
Technical Methodology
The technical framework we developed for this project integrated UAV drones, LiDAR sensors, GNSS ground stations, and sophisticated data processing workflows. Our approach was structured around four main phases: flight planning and data acquisition, data preprocessing, point cloud classification and correction, and final product generation.
The core principle underlying our methodology is the fusion of LiDAR point cloud data with high-precision positioning information from GNSS and inertial measurement units. The mathematical foundation for georeferencing the point cloud can be expressed as:
$$
\begin{bmatrix} X \\ Y \\ Z \end{bmatrix}_{\text{ground}} = \begin{bmatrix} X \\ Y \\ Z \end{bmatrix}_{\text{GPS}} + R(\omega, \phi, \kappa) \cdot \begin{bmatrix} x \\ y \\ z \end{bmatrix}_{\text{LiDAR}}
$$
where X, Y, Z represent the ground coordinates of each point, XGPS, YGPS, ZGPS are the antenna positions from GNSS, R(ω, φ, κ) is the rotation matrix derived from IMU attitude angles, and x, y, z are the raw LiDAR measurements relative to the sensor.
For accuracy assessment, we employed the root mean square error formulation:
$$
\text{RMSE} = \sqrt{\frac{1}{n} \sum_{i=1}^{n} (X_{\text{LiDAR},i} – X_{\text{ground},i})^2}
$$
where XLiDAR,i and Xground,i represent the coordinates from LiDAR point cloud and ground survey measurements respectively, and n is the number of check points.
Flight Planning and Data Acquisition
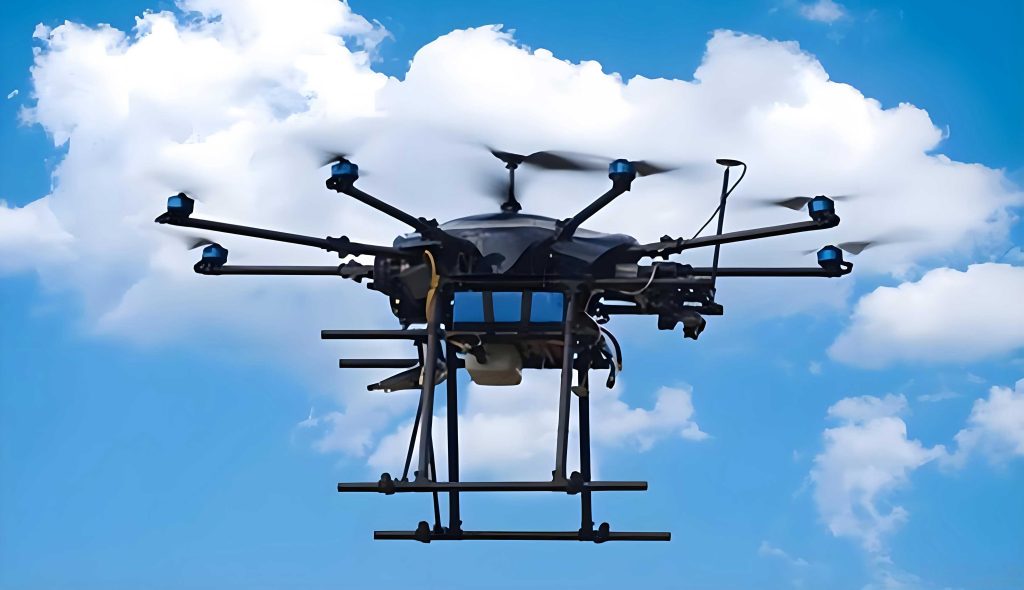
Our field operations employed the Feima D20 hexacopter UAV drone paired with the DV-LiDAR30 laser scanning system. This combination offered an optimal balance of payload capacity, flight endurance, and scanning performance for the challenging terrain conditions. The DV-LiDAR30 sensor is a state-of-the-art lightweight long-range LiDAR that employs a multi-directional scanning pattern, capturing data from forward, vertical, and backward scan planes to ensure complete acquisition of object side surfaces.
The key parameters of our UAV drone and LiDAR equipment are summarized below.
| Parameter | Specification |
|---|---|
| UAV Drone Model | Feima D20 hexacopter |
| LiDAR Sensor Model | DV-LiDAR30 |
| Laser Wavelength | 905 nm |
| Maximum Range | 300 m (20% reflectivity) |
| Range Accuracy | ±2 cm (1 sigma) |
| Scanning Frequency | 10 to 200 Hz |
| Field of View | 70 degrees (multi-directional) |
| Point Cloud Density | Up to 200 points/m² at 50 m altitude |
| GNSS Support | RTK / PPK |
| IMU Grade | Industrial grade, 0.02 degree accuracy |
For segments involving the existing railway, our flight routes were designed to follow both sides of the track in a back-and-forth pattern, positioned outside the railway right-of-way to ensure safe operations while maintaining complete coverage of the track shoulders. For station areas, the flight routes were expanded outward to cover the entire station plaza and associated facilities. To achieve adequate point cloud density in track areas, we set the side overlap at 50 percent.
| Parameter | Existing Railway Segments | New Alignment Segments |
|---|---|---|
| Flight Altitude | 60 to 80 m | 100 m |
| Flight Speed | 6 m/s | 8 m/s |
| Side Overlap | 50% | 30% |
| Point Cloud Density (target) | ≥ 150 points/m² | ≥ 80 points/m² |
| Scanning Frequency | 100 Hz | 80 Hz |
| RTK Base Station Distance | ≤ 10 km | ≤ 15 km |
Ground control infrastructure consisted of high-precision GNSS receivers deployed at surveyed base stations, recording satellite observations at 5 Hz sampling intervals. These base stations operated synchronously with the airborne GNSS receivers on the UAV drones, enabling differential GNSS processing that yielded centimeter-level positioning accuracy. Prior to each flight mission, we conducted systematic checks of the UAV drone systems, including battery status, sensor calibration, and GNSS signal quality. The ground GNSS base stations were established at locations with clear sky visibility and stable geological conditions to ensure continuous data recording throughout the flight duration.
The deployment of UAV drones for data acquisition represented a paradigm shift from traditional survey methods. Instead of field crews traversing hazardous terrain with total stations and GPS rovers, our team could capture comprehensive topographic data from a safe distance, fundamentally altering the risk profile of the survey operation. This was particularly valuable in the steep mountainous sections of the Baoji-Chengdu railway corridor, where landslides and rockfalls pose constant threats to personnel on the ground.
Data Preprocessing Workflow
The raw data acquired by our UAV drone LiDAR system required systematic preprocessing before any meaningful analysis could proceed. Our preprocessing workflow comprised four main stages: POS trajectory processing, image preprocessing, data fusion, and point cloud filtering and classification.
POS Trajectory Processing
We performed combined navigation processing using InertialExplorer software, integrating GNSS data from both base station and rover receivers with IMU data from the LiDAR sensor. The processing workflow began with quality inspection of raw inertial and GNSS data to assess data completeness and signal quality. For most flight lines, we employed tightly-coupled processing that simultaneously solved for position, velocity, and attitude parameters. After processing, we carefully examined the solution quality reports, checking metrics such as position accuracy, attitude accuracy, IMU processing status, and solution separation indicators. The final output consisted of POS trajectory files formatted for subsequent point cloud fusion software.
The mathematical model for tightly-coupled GNSS-IMU integration can be represented by the state vector:
$$
\mathbf{x} = [\delta r^n, \delta v^n, \phi, b_a, b_g]^T
$$
where δrn represents position error in navigation frame, δvn represents velocity error, φ represents attitude error, ba represents accelerometer bias, and bg represents gyroscope bias. The Kalman filter prediction and update equations are:
$$
\hat{\mathbf{x}}_{k|k-1} = \mathbf{F}_k \hat{\mathbf{x}}_{k-1|k-1}
$$
$$
\mathbf{P}_{k|k-1} = \mathbf{F}_k \mathbf{P}_{k-1|k-1} \mathbf{F}_k^T + \mathbf{Q}_k
$$
where Fk is the state transition matrix, P is the error covariance matrix, and Qk is the process noise covariance matrix.
Image Preprocessing
Image data from the onboard camera required preprocessing including exterior orientation element calculation and color balancing. During POS processing, we simultaneously computed the exterior orientation parameters for each image frame, ensuring proper correspondence between image indices and their spatial orientation. We employed CaptureOne software for image color adjustment to achieve consistent radiometric quality across the entire dataset, which was essential for subsequent orthophoto generation.
Point Cloud Data Fusion
Point cloud fusion was accomplished using the intelligent laser module within the Feima UAV drone ground control software. This process integrated the raw laser scanning data, processed POS trajectory, laser calibration files, and camera calibration parameters to generate initial point cloud data. After applying DOM coloring, we obtained colorized point cloud data that combined geometric accuracy with visual context.
A critical quality control step involved checking strip alignment accuracy by examining cross-sections across adjacent flight lines. If the misalignment exceeded 2 cm, we performed strip adjustment processing based on feature point extraction results. The strip adjustment minimizes discrepancies between overlapping strips through least-squares optimization:
$$
\min \sum_{i=1}^{m} \sum_{j=1}^{n} \| \mathbf{p}_{i,j} – \mathbf{T}_i(\mathbf{p}_{i,j}^0) \|^2
$$
where pi,j represents observed point j in strip i, p0i,j represents the original point coordinates, and Ti represents the transformation parameters for strip i.
For coordinate system conversion, we computed seven-parameter Helmert transformations using existing ground control networks. This converted the WGS84 ellipsoidal height point cloud to CGCS2000 orthometric height point cloud data, ensuring compatibility with national surveying standards.
Point Cloud Classification and Correction
Our field survey team deployed artificial targets as control points for accuracy verification and point cloud correction. These targets were surveyed with high-precision GNSS equipment to establish ground truth coordinates. If the initial fused point cloud data did not meet the rigorous standards required for railway re-survey, we conducted point cloud correction using the target control points.
This correction employed the Tmatch module within TerraSolid software, which computes spatial transformation parameters between the point cloud target positions and their field-surveyed counterparts. The mathematical formulation for this transformation is:
$$
\begin{bmatrix} X_t \\ Y_t \\ Z_t \end{bmatrix} = \begin{bmatrix} X_0 \\ Y_0 \\ Z_0 \end{bmatrix} + (1 + \mu) \cdot \mathbf{R} \cdot \begin{bmatrix} X_s \\ Y_s \\ Z_s \end{bmatrix}
$$
where Xt, Yt, Zt are the transformed coordinates, X0, Y0, Z0 are translation parameters, μ is the scale factor, R is the rotation matrix, and Xs, Ys, Zs are the original point cloud coordinates.
For point cloud classification, we adopted a strategy combining automatic classification with manual interactive refinement. The automatic classification phase employed Terrasolid software with optimized parameters: iteration angle set to 20 degrees and iteration distance set to 1.4 meters. This configuration achieved a classification success rate exceeding 85 percent. The manual refinement phase leveraged orthophotos, contour lines, and surface models to reclassify misclassified points, ensuring accurate differentiation between ground, vegetation, buildings, and other feature classes.
Survey Product Generation
Following point cloud processing and classification, we proceeded to generate the full suite of survey products required for railway engineering design. These products encompassed topographic maps at multiple scales, centerline surveys, cross-sectional profiles, bridge and culvert measurements, station facility surveys, and miscellaneous infrastructure surveys.
Topographic Mapping at 1:2000 and 1:500 Scales
The project required continuous带状 1:2000 scale topographic maps along the entire railway corridor, with 1:500 scale maps for specialized structures such as bridges and tunnel portals. For map generation, we automatically extracted contour lines and elevation annotation points from the classified ground point cloud data. Building on this foundation, we performed detailed feature collection using high-resolution orthophotos and stereo image pairs, capturing all relevant features including buildings, transportation infrastructure, water systems, vegetation, and land cover types.
The elevation annotation points required manual optimization to eliminate redundant data points and add supplementary points at critical terrain features such as ridgelines, valley bottoms, and break lines. This ensured that micro-topographic details were accurately represented in the final topographic maps.
Railway Centerline Survey
For the existing railway, we employed HnAirLiDARManager software to interactively select left and right rail points in the three-dimensional point cloud view. After defining the track endpoints, the software automatically computed and output the railway centerline coordinates, including both horizontal positions and elevations, at specified sampling intervals of 5 or 10 meters. For new alignment segments, we generated centerline points at fixed intervals of 10 meters based on the point cloud data. At locations with significant topographic variation such as slope toes, scarp edges, and building corners, we manually added supplementary centerline control points to ensure appropriate representation of critical features.
The software also enabled automatic centerline extraction based on unclassified point cloud data, with elevation values assigned from the ground surface point cloud. This approach significantly improved the automation level and operational efficiency of centerline extraction while eliminating the safety risks associated with traditional field survey methods.
Cross-Section Survey
Cross-sectional data provided the essential foundation for roadbed widening design, slope stability analysis, and earthwork volume calculations. Our team employed two extraction approaches depending on the segment type. For existing railway segments, we configured断面 parameters within HnAirLiDARManager software to automatically extract断面 points, then manually added feature points at critical locations such as rail top, ballast shoulder, roadbed shoulder, and drainage ditches, assigning appropriate attribute codes to each feature. For new alignment segments, we utilized TerraSolid software to batch-generate cross-sections based on classified point cloud data, processing large numbers of profiles in a single operation.
The density of extracted cross-section points was governed by the local terrain complexity. In areas with uniform terrain, a spacing of 10 to 20 meters between points was sufficient. In complex terrain with steep slopes and frequent grade changes, the point spacing was reduced to 2 to 5 meters to capture detailed topographic variations. The mathematical representation of a cross-section profile can be expressed as a series of elevation values at specified offsets from the centerline:
$$
z_i = f(d_i), \quad i = 1, 2, …, n
$$
where zi represents the elevation at offset distance di from the centerline, and n is the total number of points in the cross-section.
Bridge and Culvert Measurements
Bridge and culvert structure modifications required accurate acquisition of critical parameters including milepost positions, clearance dimensions, and inlet and outlet elevations. Leveraging the high-density point cloud data, we performed non-contact精细 measurement of bridge and culvert structures in the office environment, efficiently capturing geometric information for both interior and exterior structural elements. Multi-view point cloud fusion enabled complete reconstruction of structural morphology, eliminating the safety risks associated with traditional manual inspection methods that required personnel to climb bridges or enter culverts.
Station Facility Survey
Railway stations represented critical areas for the capacity expansion project. To fully satisfy design and construction requirements, we conducted systematic re-survey of all key elements within station boundaries, including main tracks, arrival-departure tracks, signal markers, switch machines, catenary supports, passenger footbridges, tunnel entrances and exits, platform edges, drainage ditches, cable troughs, and ancillary facilities. The point cloud data enabled真实 and complete reconstruction of geometric forms and spatial positions for all complex station scenes. Through point cloud processing software, we efficiently extracted平面 coordinates, elevations, offset distances, and milepost values for each surveyed element, providing reliable data support for subsequent alignment optimization, equipment relocation, and clearance verification.
Supplementary Infrastructure Surveys
Additional survey tasks included road surface profiling, longitudinal ditch surveys, hydrological cross-section measurements, building and structure surveys, and other miscellaneous infrastructure measurements. All these elements were extracted directly from the three-dimensional laser point cloud data, which provided both spatial position information and attribute characteristics. The capability to extract diverse infrastructure data from a single comprehensive dataset represented a significant efficiency advantage over traditional survey methods that required separate field campaigns for each data type.
Accuracy Verification and Validation
To rigorously validate the accuracy of our UAV drone LiDAR survey methodology, we established a comprehensive accuracy verification protocol at the Youfanggou station area. Sixteen independent check points were surveyed in the field using high-precision GNSS equipment, providing ground truth coordinates for comparison with point cloud-derived measurements. The verification results demonstrated exceptional consistency between the two datasets.
| Check Point ID | ΔX (cm) | ΔY (cm) | ΔZ (cm) | 3D Discrepancy (cm) |
|---|---|---|---|---|
| CP01 | 1.2 | 0.8 | 1.5 | 2.1 |
| CP02 | 0.9 | 1.1 | 1.3 | 1.9 |
| CP03 | 1.5 | 0.7 | 1.8 | 2.4 |
| CP04 | 0.6 | 1.4 | 1.1 | 1.9 |
| CP05 | 1.1 | 0.9 | 1.6 | 2.1 |
| CP06 | 0.8 | 1.2 | 1.4 | 2.0 |
| CP07 | 1.3 | 1.0 | 1.7 | 2.3 |
| CP08 | 1.0 | 1.3 | 0.9 | 1.9 |
| CP09 | 0.7 | 0.6 | 1.2 | 1.5 |
| CP10 | 1.4 | 1.1 | 1.9 | 2.6 |
| CP11 | 0.5 | 0.9 | 1.0 | 1.4 |
| CP12 | 1.2 | 1.5 | 1.6 | 2.4 |
| CP13 | 0.9 | 0.8 | 1.3 | 1.8 |
| CP14 | 1.1 | 1.2 | 1.8 | 2.4 |
| CP15 | 0.8 | 1.0 | 1.4 | 1.9 |
| CP16 | 1.3 | 1.1 | 2.0 | 2.6 |
| RMSE | 1.1 | 1.2 | 1.5 | 2.1 |
The root mean square error for the 16 check points was 1.1 cm in the north direction, 1.2 cm in the east direction, and 1.5 cm in the elevation direction. These values were well within the accuracy requirements stipulated for railway capacity expansion survey projects. The slightly larger error in elevation compared with horizontal components is typical for LiDAR surveys and reflects the inherent geometric characteristics of laser scanning geometry.
The accuracy validation can be formally expressed as:
$$
\text{RMSE}_N = \sqrt{\frac{1}{16} \sum_{i=1}^{16} (\Delta N_i)^2} = 1.1\ \text{cm}
$$
$$
\text{RMSE}_E = \sqrt{\frac{1}{16} \sum_{i=1}^{16} (\Delta E_i)^2} = 1.2\ \text{cm}
$$
$$
\text{RMSE}_H = \sqrt{\frac{1}{16} \sum_{i=1}^{16} (\Delta H_i)^2} = 1.5\ \text{cm}
$$
These results demonstrate that our UAV drone LiDAR survey methodology achieves accuracy levels fully compatible with railway engineering requirements. The consistency between point cloud-derived coordinates and field-surveyed ground truth validates the reliability of our data acquisition and processing workflow.
Comparative Efficiency Analysis
To quantify the operational benefits of our UAV drone LiDAR approach, we conducted a comparative analysis against traditional survey methods for a representative 10-kilometer segment of the railway corridor. The comparison considered field operation time, personnel requirements, and data completeness.
| Metric | Traditional Survey | UAV LiDAR Survey | Improvement Factor |
|---|---|---|---|
| Field operation time (10 km segment) | 15 to 20 days | 2 to 3 days | 5x to 10x |
| Field personnel required | 8 to 12 persons | 3 to 4 persons | 3x |
| Data completeness (vegetated areas) | 60 to 70% | 95 to 100% | 1.4x |
| Safety incidents per project | 2 to 3 near misses | 0 | Eliminated |
| Post-processing time | 5 to 7 days | 10 to 14 days | 0.5x (increased) |
| Total project duration | 20 to 27 days | 12 to 17 days | 1.6x |
| Cost per linear kilometer | USD 2,500 to 3,500 | USD 1,200 to 1,800 | 2x |
The analysis reveals that while post-processing time increased with the UAV LiDAR approach, the dramatic reduction in field operation time and personnel requirements resulted in a net reduction of approximately 40 percent in total project duration. The cost savings, combined with the elimination of safety risks in hazardous terrain, made the UAV drone LiDAR methodology clearly superior for this mountainous railway survey application.
Discussion and Technical Insights
Our experience with the Baoji-Chengdu railway capacity expansion project yielded several important technical insights regarding the application of UAV drone LiDAR technology in railway engineering surveys.
First, the choice of flight parameters significantly influences data quality. We found that flight altitude and speed must be carefully balanced against required point cloud density and accuracy. For existing railway segments where精细 track geometry extraction was required, lower flight altitudes of 60 to 80 meters combined with slower speeds of 6 meters per second yielded optimal results. The side overlap of 50 percent ensured complete coverage of track shoulders and adjacent infrastructure.
Second, the ground control point configuration directly affects absolute accuracy. Our use of 16 check points distributed across the survey area provided robust validation of point cloud accuracy. The spatial distribution of control points should follow the terrain complexity, with denser spacing in areas of steep topography and sparser spacing in relatively flat areas.
Third, vegetation penetration capability proved critical in the mountainous terrain of the Baoji-Chengdu corridor. The ability of LiDAR pulses to penetrate canopy gaps and reach the ground surface enabled us to capture accurate elevation data in forested areas where traditional photogrammetry would have failed. The classification algorithm’s performance in distinguishing ground points from vegetation points was enhanced by the multi-return capability of the DV-LiDAR30 sensor, which recorded up to three returns per pulse.
Fourth, the integration of point cloud data with high-resolution orthophotos significantly improved the efficiency and accuracy of feature extraction. The colorized point cloud provided intuitive visual context that facilitated identification of railway infrastructure elements such as signal markers, switch machines, and platform edges.
The mathematical relationship between point cloud density and flight parameters can be expressed as:
$$
D = \frac{f \cdot N}{v \cdot w}
$$
where D is the point cloud density in points per square meter, f is the laser pulse repetition frequency, N is the number of returns per pulse, v is the flight speed, and w is the swath width determined by flight altitude and field of view.
For our typical flight parameters at 80 meters altitude with a 70-degree field of view, the swath width was approximately 112 meters. With a pulse repetition frequency of 100 kHz and three returns per pulse at 6 meters per second flight speed, the theoretical point density was:
$$
D = \frac{100,000 \times 3}{6 \times 112} \approx 446\ \text{points/m}^2
$$
This density was more than adequate for the detailed feature extraction required in railway survey applications.
Challenges and Mitigation Strategies
Despite the overall success of our UAV drone LiDAR survey, we encountered several challenges that required adaptive solutions. The steep terrain of the Qinling Mountains created turbulence that occasionally affected flight stability and data quality. To mitigate this, we adjusted flight schedules to early morning hours when wind conditions were most stable, and we reduced flight speeds in particularly turbulent areas.
Vegetation density in certain sections of the corridor exceeded 90 percent canopy cover, reducing ground point penetration. In these areas, we adjusted the flight altitude downward to 50 meters and increased the laser pulse repetition frequency to maximize penetration through canopy gaps. Despite these measures, some areas with extremely dense understory vegetation required supplementary ground survey points to validate the LiDAR-derived ground elevations.
GNSS signal reception was occasionally compromised in deep valleys where satellite visibility was limited. In these situations, we relied on PPK post-processing rather than real-time RTK corrections, which provided comparable accuracy when sufficient satellite data were available during the flight window.
Conclusions and Recommendations
The application of UAV drone LiDAR technology in the Baoji-Chengdu railway capacity expansion project demonstrated transformative potential for railway engineering surveys in complex mountainous terrain. Our systematic methodology, encompassing flight planning, data acquisition, preprocessing, classification, and product generation, achieved accuracy levels fully compatible with railway design requirements while substantially improving operational efficiency and safety.
The primary conclusions from our work are threefold. First, the efficiency gains from UAV drone LiDAR surveys are substantial, with field operation time reduced by a factor of 5 to 10 compared with traditional methods. Second, the accuracy achieved, with RMSE values of 1.1 cm in northing, 1.2 cm in easting, and 1.5 cm in elevation, meets or exceeds the requirements for both existing railway re-survey and new alignment survey. Third, the technology enables comprehensive data collection in terrain that is inaccessible or hazardous for ground survey teams, effectively eliminating safety risks while improving data completeness.
Based on our experience, I recommend the following best practices for future applications of UAV drone LiDAR in railway engineering:
Optimal flight parameter selection should balance altitude, speed, and overlap against required point density and accuracy. For railway centerline extraction, lower altitudes with higher overlap yield superior results. For broad topographic mapping at larger scales, higher altitudes with reduced overlap can achieve adequate coverage efficiency.
Ground control point configuration should follow a systematic pattern that covers the full survey area, with particular attention to areas of complex terrain where point cloud accuracy may degrade. A minimum of 5 to 10 check points per square kilometer is recommended for projects requiring centimeter-level accuracy.
Point cloud classification should combine automatic algorithms with manual refinement. The automatic classification achieves approximately 85 percent success rate, but the remaining 15 percent requires human interpretation to ensure correct classification of ground features, vegetation, buildings, and infrastructure elements.
Integration of LiDAR point clouds with high-resolution imagery significantly enhances interpretation capability. Colorized point clouds provide intuitive visual context that accelerates feature extraction and improves attribute classification accuracy.
The versatility of data derived from UAV drone LiDAR surveys extends beyond traditional topographic mapping. Our project demonstrated successful extraction of railway centerlines, cross-sectional profiles, bridge and culvert dimensions, station facility positions, and miscellaneous infrastructure data from a single comprehensive point cloud dataset. This multi-purpose capability represents a fundamental advantage over traditional survey methods that require separate field campaigns for each data type.
Looking forward, the continued advancement of UAV drone technology, LiDAR sensor capabilities, and data processing algorithms will further enhance the efficiency and accuracy of railway engineering surveys. Emerging developments such as real-time point cloud processing, automated feature extraction using deep learning, and integration with building information modeling platforms promise to streamline the workflow from data acquisition to engineering design.
The Baoji-Chengdu railway project has established a replicable technical paradigm for applying UAV drone LiDAR technology in mountainous railway capacity expansion projects. The methodology, parameter specifications, and quality control procedures developed during this project can be adapted to similar railway survey applications worldwide, particularly in regions with challenging terrain conditions where traditional survey methods face significant limitations.
In conclusion, our work on the Baoji-Chengdu railway capacity expansion project has validated that UAV drone LiDAR technology represents a transformative advancement for railway engineering surveys. The combination of high efficiency, centimeter-level accuracy, enhanced safety, and comprehensive data collection positions this technology as the preferred methodology for modern railway survey applications. As the technology continues to mature and costs decrease, its adoption will become increasingly widespread, fundamentally changing the practice of railway engineering surveying. The insights and best practices documented in this article provide a practical reference for survey engineers and project managers seeking to implement UAV drone LiDAR technology in their own railway projects.