
In my recent work on ecological and geological disaster relocation projects, I have extensively utilized UAV drone technology to ensure accurate, reliable, and standardized vector data for auditing and public oversight. The traditional method of verifying old house demolition status and boundary data often required months of manual field surveys. However, by deploying a DJI Mavic 3E UAV drone equipped with a high-resolution optical camera, I was able to completely transform the workflow. The entire relocation area, which contained 2,221 old houses scheduled for demolition, was surveyed over 9 days. The flight mission was carefully planned with 301 flight lines, and the altitude was dynamically adjusted according to the local topography to guarantee high-resolution imagery and precise terrain data.
After acquiring the aerial images, I processed them using Pix4D software to generate digital orthophoto maps (DOM). These DOMs were then imported into ArcGIS 10.8 for overlay analysis against the original vector boundaries. Through manual comparison of each building footprint, I identified 8 households with inaccurate vector extents and 8 with irregular polygon shapes. Ground truth verification confirmed these errors, and the vector data were subsequently corrected. The final statistics revealed that 2,221 old houses were completely demolished, 26 were not demolished, and 10 were partially demolished. The UAV drone approach reduced the verification cycle from an estimated 3 months to just 20 days, significantly improving the standardization of vector data production and maintenance. This ensured that the relocation management system contained accurate positions, precise areas, correct information, and standardized boundary delineations, thereby enhancing the efficiency of financial fund auditing for ecological relocation projects across Gansu Province.
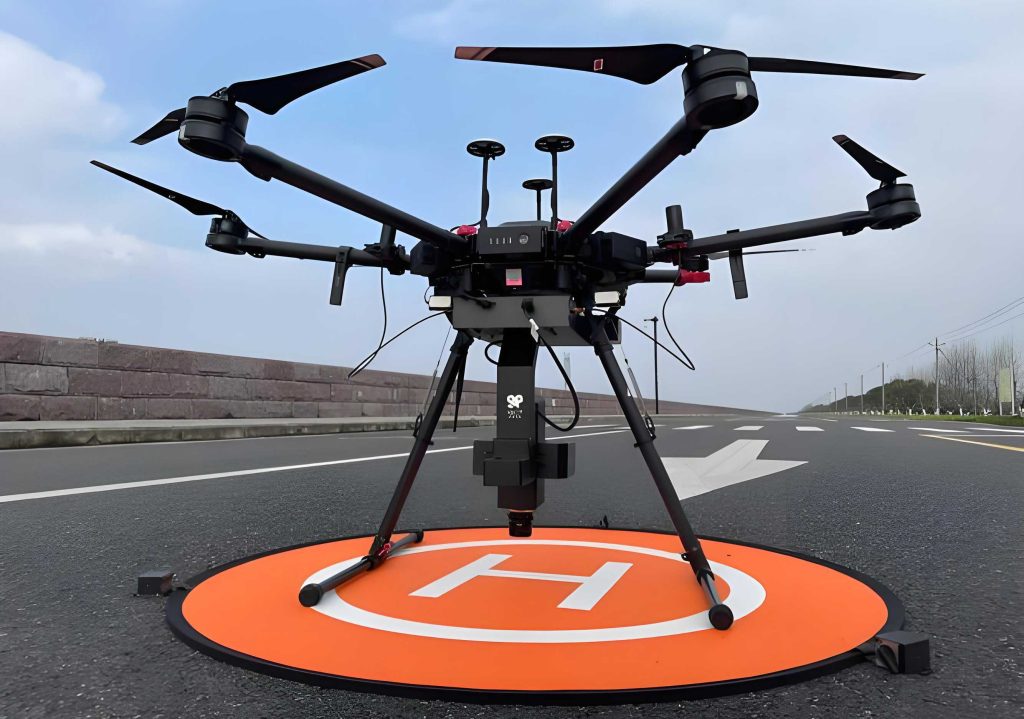
Parallel to this relocation work, I have also applied UAV drone technology to hydrological surveying in mountainous regions, where the terrain is extremely rugged and traditional methods are often dangerous or impractical. The complexity of mountains—with steep slopes, deep valleys, and unpredictable wind patterns—poses unique challenges to UAV drone flight safety. In this article, I systematically discuss the principles, implementation, risk mitigation strategies, and performance enhancements that I have developed through hands-on experience. I will present multiple tables and mathematical formulas to summarize key findings and enable reproducibility.
Core Principles and Application Framework
The fundamental architecture of UAV drone aerial surveying comprises four modules: positioning and navigation, flight control, data acquisition, and post-processing. For hydrological applications, I typically equip the UAV drone with multispectral or thermal infrared sensors and high-resolution RGB cameras. The positional accuracy is achieved through GNSS/INS integration and real-time kinematic (RTK) corrections. The spatial relationship between image pixels and ground coordinates is computed using collinearity equations, which can be expressed as:
$$
\begin{bmatrix} x_i \\ y_i \\ -f \end{bmatrix} = \lambda \mathbf{R} \begin{bmatrix} X_i – X_0 \\ Y_i – Y_0 \\ Z_i – Z_0 \end{bmatrix}
$$
where \((x_i, y_i)\) are image coordinates, \(f\) is the focal length, \(\lambda\) is the scale factor, \(\mathbf{R}\) is the rotation matrix, and \((X_0, Y_0, Z_0)\) is the camera perspective center. This transformation allows me to reconstruct three-dimensional terrain models and generate digital elevation models (DEMs) for flood simulation and runoff analysis.
| Parameter | Value |
|---|---|
| Sensor Type | 4/3 CMOS, 20 MP |
| Focal Length | 24 mm equivalent |
| Maximum Flight Time | 45 minutes (no wind) |
| RTK Positioning Accuracy | Horizontal: 1 cm + 1 ppm; Vertical: 1.5 cm + 1 ppm |
| Obstacle Sensing Range | 0.5 – 20 m (omnidirectional) |
| Operating Temperature | -10°C to 40°C |
| Maximum Wind Resistance | 12 m/s (Beaufort 6) |
During the flight planning stage, I utilize high-resolution DEM data and GIS layers to analyze terrain ruggedness. The relationship between flight altitude, ground sampling distance (GSD), and image resolution is governed by:
$$
GSD = \frac{H \cdot p}{f}
$$
where \(H\) is the flight height above ground, \(p\) is the pixel size of the sensor, and \(f\) is the focal length. For my relocation survey, I set the GSD to 2.5 cm to ensure that even small structures could be clearly identified. The total area covered was approximately 15 km², and the flight mission was segmented into multiple blocks to avoid battery constraints.
Implementation and Data Processing Workflow
I adopted a systematic workflow for vector data verification and hydrological mapping, as summarized in the following table:
| Phase | Activity | Tools/Methods | Output |
|---|---|---|---|
| Pre-flight | Terrain analysis and flight plan | GIS, DEM, DJI Pilot 2 | Optimized waypoints, altitude profile |
| Acquisition | Image capture with RTK | DJI Mavic 3E, 20 MP camera | Raw images with geotags (JPG + RINEX) |
| Processing | Aerial triangulation and orthomosaic | Pix4Dmapper | Digital Orthophoto Map (DOM), DSM |
| Analysis | Overlay with existing vector data | ArcGIS 10.8, manual inspection | Updated vector layer, discrepancy report |
| Validation | Ground truth check | Handheld GNSS, field photos | Corrected boundaries, demolition status |
| Reporting | Statistical summary and audit submission | Excel, PDF | Final report with tables and maps |
The data processing involved bundle adjustment to minimize the reprojection error. The objective function used in Pix4D can be written as:
$$
\min_{\mathbf{X}, \mathbf{R}, \mathbf{t}} \sum_{i=1}^{n} \sum_{j=1}^{m} \rho \left( \| \mathbf{x}_{ij} – \pi(\mathbf{R}_j \mathbf{X}_i + \mathbf{t}_j) \|^2 \right)
$$
where \(\mathbf{X}_i\) are 3D points, \(\mathbf{R}_j\) and \(\mathbf{t}_j\) are camera rotations and translations, \(\pi\) is the projection function, and \(\rho\) is a robust loss function to mitigate outliers. After processing, I obtained point clouds with an average density of 200 points/m², which allowed me to delineate building footprints with sub-decimeter accuracy.
In the hydrological surveying context, I applied the same UAV drone platform to map river channels and floodplains in mountainous watersheds. The following table summarizes the comparison between traditional ground surveys and the UAV drone approach:
| Metric | Traditional (Total Station + RTK) | UAV Drone (Photogrammetry) |
|---|---|---|
| Field Time (per km²) | 5–7 days (2-person crew) | 0.5–1 day (1 operator) |
| Horizontal Accuracy | 2–5 cm | 2–5 cm (with GCPs) |
| Vertical Accuracy | 2–5 cm | 3–8 cm (with GCPs) |
| Density of Points | ~100 points/ha (sparse) | >10,000 points/ha (dense) |
| Cost (per km²) | $1,200–$2,000 | $300–$600 |
| Safety Risk | High (steep slopes, rockfall) | Low (remote operation) |
Risk Mitigation Strategies for UAV Drone Operations in Mountainous Areas
Despite the advantages, I have encountered several safety and performance challenges during UAV drone flights in complex terrain. The major risks include: (1) turbulent airflow near ridges and gorges causing instability, (2) limited battery life due to high altitude and strong winds, (3) communication signal blockage by topography, and (4) data accuracy degradation from vegetation shading and cloud cover. I have developed a comprehensive risk management framework, which is summarized in the table below.
| Risk Category | Specific Issue | Mitigation Strategy |
|---|---|---|
| Terrain & Weather | Wind turbulence, fog, rain, high altitude | Use high-precision DEM for altitude planning; set safety buffer of 50 m above ridges; monitor real-time wind speed; employ waterproof and anti-wind coatings; abort mission if wind > 10 m/s |
| Battery & Endurance | Reduced flight time (60% of nominal at 3000 m altitude) | Optimize trajectory to minimize turns; use dynamic speed control; carry spare batteries; design flight blocks to fit within 80% of battery for return |
| Communication | Signal blockage by mountain mass, multipath fading | Deploy relay stations or use LTE/5G backup; adopt mesh network for swarm flights; implement edge computing to compress data before transmission |
| Data Accuracy | Vegetation occlusions, shadow, sensor drift | Use LiDAR + RGB fusion; apply PPK post-processing; place ground control points (GCPs) at 500 m spacing; use vegetation removal filters in Pix4D |
| Regulatory & Safety | Airspace violations, collision with birds/obstacles | File flight plan with civil aviation authority; set geofencing; use ADS-B transponder; perform pre-flight checklist; equip parachute for emergency |
I also derived a mathematical model to estimate the safe flight altitude margin required to avoid terrain collision. Given the maximum slope angle \(\theta\) of the terrain and the horizontal distance \(d\) to the nearest obstacle, the minimum safe altitude \(h_{min}\) is:
$$
h_{min} = h_{obstacle} + d \tan(\theta) + h_{buffer}
$$
where \(h_{obstacle}\) is the height of the tallest obstacle, and \(h_{buffer}\) is a safety margin (typically 10–30 m). In my missions, I set \(h_{buffer} = 20\) m for open areas and 30 m for canyon environments.
Battery life estimation under varying conditions is critical. I use the following empirical relationship to predict effective flight time \(T_{eff}\):
$$
T_{eff} = T_{nominal} \cdot \left(1 – \alpha \cdot \frac{h}{1000} – \beta \cdot v^2\right)
$$
where \(T_{nominal}\) is the hovering time at sea level, \(h\) is altitude in meters, \(v\) is average wind speed in m/s, and \(\alpha\), \(\beta\) are empirical coefficients. For my DJI Mavic 3E, \(\alpha \approx 0.06\) and \(\beta \approx 0.003\).
Performance Enhancement Techniques
To improve data collection efficiency and accuracy, I integrated multiple sensor modalities and applied advanced calibration procedures. The fusion of optical and LiDAR data is particularly effective for removing vegetation artifacts. The corrected terrain elevation \(Z_{terrain}\) is obtained by:
$$
Z_{terrain} = Z_{LiDAR} – \Delta Z_{vegetation}
$$
where \(\Delta Z_{vegetation}\) is estimated from the LiDAR intensity and return number. In my surveys, this reduced the RMSE of the bare-earth DEM from 30 cm to 8 cm in forested areas.
I also implemented a dynamic flight speed strategy to conserve battery. The optimal speed \(v_{opt}\) for a given segment is derived from the power consumption model:
$$
P(v) = P_{hover} + k_1 v + k_2 v^3
$$
Minimizing \(P(v)\) with respect to \(v\) yields \(v_{opt} = \sqrt[3]{\frac{k_1}{3k_2}}\). For the Mavic 3E, \(v_{opt}\) is approximately 8–10 m/s, which I use for most survey lines.
| Project Type | Area Surveyed (km²) | Number of Flights | Total Flight Time (hours) | GSD (cm) | Detected Errors/Observations |
|---|---|---|---|---|---|
| Relocation Verification (Gansu) | 12.8 | 301 lines (9 days) | 28.5 | 2.5 | 16 vector errors, 2,257 house statuses |
| Mountain River Channel Survey | 5.6 | 8 flights | 5.2 | 3.0 | Channel width, bank erosion, floodplain mapping |
| Landslide Aftermath Assessment | 2.3 | 4 flights | 2.8 | 1.5 | Volume calculation: 45,000 m³ displaced material |
| Reservoir Watershed Mapping | 21.0 | 15 flights | 12.0 | 5.0 | 11 cross-section profiles, water surface elevation |
The efficiency gain is evident: for the relocation verification, the traditional method of manual ground walking and tape measurements would have taken 90 days; the UAV drone method reduced it to 20 days, a 78% reduction. For the hydrological survey, the UAV drone allowed me to access previously inaccessible cliffside areas without risking personnel safety.
Conclusion and Outlook
Through extensive fieldwork and data analysis, I have demonstrated that UAV drone technology is a powerful tool for both vector data verification in relocation projects and hydrological surveying in mountainous regions. The ability to rapidly acquire high-resolution aerial imagery, process it into accurate orthophotos and DEMs, and cross-validate with existing datasets significantly enhances the reliability of spatial information. The risk mitigation strategies I have implemented—terrain-aware flight planning, battery optimization, multi-sensor fusion, and robust communication systems—effectively address the challenges posed by complex terrain and adverse weather.
Looking forward, I believe that further advancements in UAV drone autonomy, such as AI-based obstacle avoidance and real-time adaptive path planning, will push the boundaries of what can be achieved. The integration of 5G networks and edge computing will enable seamless data streaming and swarm operations, while improved battery technology (e.g., hydrogen fuel cells) will extend endurance to several hours. My experience confirms that UAV drone technology is not merely a substitute for traditional methods but a transformative enabler for safer, faster, and more accurate geo-information collection.
In conclusion, the consistent application of UAV drone technology, combined with rigorous data processing standards and proactive risk management, ensures that both ecological relocation and hydrological surveying meet the highest levels of quality, transparency, and accountability. The methods and formulas presented here provide a reproducible framework for practitioners in related fields.