
The rapid proliferation of unmanned aerial vehicles (UAVs) has brought unprecedented convenience to our work and daily lives. However, it also introduces significant risks and challenges, as a large proportion of drone operations remain unregulated—often referred to as “black flights.” These unauthorized flights, conducted without proper training or flight plan submission, threaten not only personal safety and property but also public security, aviation safety, and even national air defense. Addressing these concerns requires a robust technological framework for effective drone regulation. In this paper, we present the design of G-Cloud, a general aviation drone supervision system that leverages cloud computing, radar surveillance, and real-time telemetry to achieve comprehensive monitoring and management of UAV activities.
G-Cloud integrates airborne data acquisition devices, low-altitude surveillance equipment, a central monitoring platform, and various user terminals. The system continuously collects position, altitude, speed, and other flight parameters from drones via onboard modules. It employs ground-based radar and optical sensors to detect and track targets, while the cloud platform processes, stores, and visualizes the data. By combining internet technology with cloud services, G-Cloud transforms massive amounts of telemetry into intuitive graphical displays. Key functionalities include automatic detection and tracking of single or multiple targets, customizable alert zones, intelligent automatic duty, trajectory playback, and target identification. The system is designed to comply with the latest civil aviation regulations in China, providing a practical solution for drone regulation authorities.
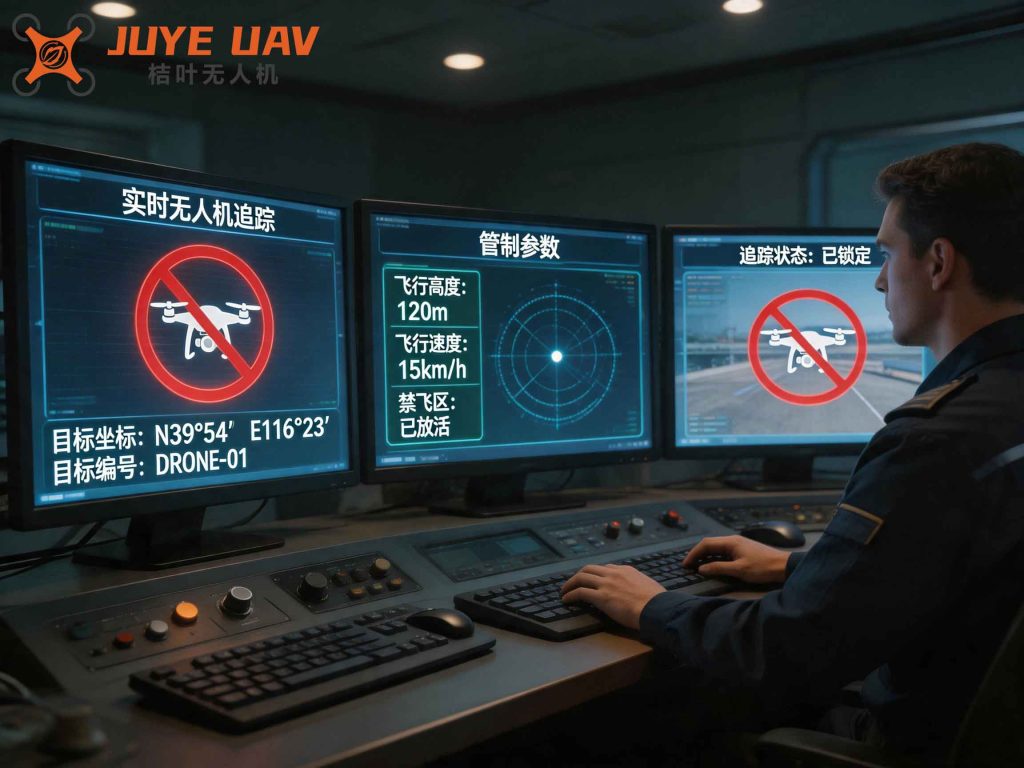
1. Overall System Architecture
As depicted in the conceptual diagram above, G-Cloud consists of four primary subsystems: (1) airborne data acquisition devices, (2) low-altitude surveillance equipment, (3) the monitoring center, and (4) user terminals. Each component is described in detail below.
1.1 Airborne Data Acquisition Devices
Each drone is equipped with an onboard unit that includes a GNSS positioning module, a wireless communication module, and an ADS-B (Automatic Dependent Surveillance–Broadcast) module. During flight, the positioning module receives satellite signals at a fixed rate (e.g., 1 Hz or 10 Hz) to obtain the drone’s current latitude, longitude, altitude, and time. The onboard unit then transmits this information to the cloud platform through both terrestrial wireless networks (3G/4G/5G) and ADS-B broadcasts. The dual-path transmission ensures redundancy and reliability, even in areas with limited cellular coverage. The transmitted data fields are summarized in Table 1.
| Field | Description | Unit |
|---|---|---|
| Timestamp | UTC time of position fix | s |
| Latitude | Geodetic latitude (WGS84) | ° |
| Longitude | Geodetic longitude (WGS84) | ° |
| Altitude | Height above mean sea level | m |
| Ground Speed | Speed over ground | m/s |
| Course | True heading angle | ° |
| UAV ID | Unique identifier (serial number) | — |
| Battery Level | Remaining battery percentage | % |
1.2 Low-Altitude Surveillance Equipment
Ground-based surveillance equipment includes low-altitude surveillance radars and high-definition PTZ cameras installed at monitoring sites. The radar continuously scans the airspace, detecting drones and other moving targets. For each detected target, the radar computes the three-dimensional position (range, azimuth, elevation) and the radial velocity. These measurements are time-stamped and sent to the radar data processing server. The cameras are intelligent pan-tilt-zoom units that can be automatically slewed to track a target based on radar cues. This combination of radar and optical sensors provides both wide-area detection and high-resolution visual confirmation, essential for robust drone regulation.
1.3 Monitoring Center
The monitoring center is the core of G-Cloud. It comprises several dedicated servers and storage devices:
- Airborne Data Processing Server: Receives telemetry from drones via wireless and ADS-B links, validates the data, and stores it in the database.
- Radar Data Processing Server: Ingests radar detection data (target coordinates, velocity, track ID, etc.), performs coordinate transformation and tracking algorithms, and stores the results.
- Optical Data Processing Server: Controls camera pan/tilt/zoom based on target tracks, receives video streams, and forwards them to the display system and video storage.
- Web Server: Hosts the system’s graphical user interface for operators.
- APP Interface Server: Pushes real-time alerts and status to mobile devices of security personnel.
- Database Server: Uses a master‑slave replication architecture with read‑write separation to store all historical records, including flight paths, radar tracks, and system configuration.
- Video Storage: Adopts an IP-SAN (Storage Area Network) solution for high‑capacity and scalable video recording.
- Management Host: Monitors the health of all servers and network performance.
Table 2 lists the key servers and their primary functions.
| Server Name | Input | Output / Function |
|---|---|---|
| Airborne Data Proc. | UAV telemetry (GNSS, ADS‑B) | Validate, store, generate alerts |
| Radar Data Proc. | Radar plots (x,y,z, v, azimuth, range) | Track association, Kalman filtering, store tracks |
| Optical Data Proc. | Camera control commands, video streams | PTZ control, video distribution, recording |
| Web Server | HTTP requests | Dashboard, historical queries, settings |
| APP Interface | Alert events | Push notifications to mobile apps |
| Database | All persistent data | Shared storage with master‑slave replication |
1.4 User Terminals
Operators can access the G-Cloud system via three types of terminals:
- PC browser: Provides full monitoring, configuration, and analysis capabilities.
- Mobile APP: Delivers real-time alerts and simplified status views.
- Large display screen & audible/visual alarms: Used in control rooms for situational awareness and immediate response.
2. Layered Software Architecture
G-Cloud adopts a six‑layer component‑based architecture that ensures flexibility, scalability, and easy integration with future components. The layers are: Physical Layer, Network Layer, Data Acquisition Layer, Application Support Layer, Application Layer, and Presentation Layer. Table 3 summarizes each layer.
| Layer | Components / Technologies | Role |
|---|---|---|
| Physical | Radar, cameras, servers, storage, alarm devices | Hardware foundation |
| Network | WLAN/LAN, 3G/4G/5G, WiFi | Data communication between devices and center |
| Data | Radar data collection, optical data collection | Raw data ingestion |
| Application Support | Map engine, data processing algorithms, video decoding, database management | Common services and algorithms |
| Application | Real‑time monitoring, alert generation, target tracking, trajectory replay, zone setting, automatic duty, video analytics, user management, reports | Business logic |
| Presentation | Web UI, mobile APP, large screen | User interaction and visualization |
The dependencies in the support layer include geographic information systems (GIS) and video standards (e.g., H.264/H.265). The system also relies on third‑party protocols for radar communication and ADS‑B parsing.
3. System Workflow and Data Processing
3.1 Airborne Data Processing Workflow
When a drone is in flight, its onboard unit sends position and status data every second (or at a configurable interval). The airborne data processing server receives the packets, validates the data integrity (e.g., checksum, timestamp ordering), and updates the drone’s record in the real‑time database. If the drone enters a geofenced no‑fly zone or deviates from its approved flight path, the server triggers an alert. The alert signal is sent to the optical data processing server, which instructs a nearby camera to point at the target and start recording. Simultaneously, the app interface server pushes a notification to the security personnel’s mobile device. The mathematical model for predicting the drone’s next position using a simple constant‑velocity Kalman filter is given below.
Let the state vector at time \(k\) be:
\[
\mathbf{x}_k = [x_k,\ y_k,\ \dot{x}_k,\ \dot{y}_k]^T
\]
where \((x_k, y_k)\) are horizontal coordinates (projected from latitude/longitude using a suitable map projection) and \((\dot{x}_k, \dot{y}_k)\) are the corresponding velocities. The system dynamics and measurement models are:
\[
\mathbf{x}_{k+1} = \mathbf{F} \mathbf{x}_k + \mathbf{w}_k, \quad
\mathbf{z}_k = \mathbf{H} \mathbf{x}_k + \mathbf{v}_k
\]
with
\[
\mathbf{F} = \begin{bmatrix}
1 & 0 & \Delta t & 0 \\
0 & 1 & 0 & \Delta t \\
0 & 0 & 1 & 0 \\
0 & 0 & 0 & 1
\end{bmatrix}, \quad
\mathbf{H} = \begin{bmatrix}
1 & 0 & 0 & 0 \\
0 & 1 & 0 & 0
\end{bmatrix}
\]
where \(\Delta t\) is the sampling interval, \(\mathbf{w}_k \sim \mathcal{N}(0,\mathbf{Q})\) and \(\mathbf{v}_k \sim \mathcal{N}(0,\mathbf{R})\) are process and measurement noise, respectively. The Kalman filter recursively estimates the state, enabling accurate tracking and early anomaly detection—a critical aspect of drone regulation.
3.2 Radar Data Processing Workflow
Ground‑based radars report target detections every scan (e.g., every 1–2 seconds). Each detection provides range \(r\), azimuth \(\theta\), elevation \(\phi\), and radial velocity \(v_r\). These measurements are first transformed from radar‑centered polar coordinates to the Earth‑fixed Cartesian coordinate system (e.g., UTM projection). The transformation is:
\[
x = x_r + r \cos\phi \sin\theta, \quad
y = y_r + r \cos\phi \cos\theta, \quad
z = z_r + r \sin\phi
\]
where \((x_r, y_r, z_r)\) is the radar site’s known position. The radar data processing server then runs a multi‑target tracking algorithm, typically using a Joint Probabilistic Data Association (JPDA) filter or a Multi‑Hypothesis Tracker (MHT). Tracks are maintained with unique IDs and are compared against the database of authorized drone flights. Any track that does not match an active flight plan is flagged as an intruder. The server also computes target speed and heading using consecutive measurements:
\[
v = \frac{\sqrt{(x_{k+1}-x_k)^2 + (y_{k+1}-y_k)^2}}{\Delta t}, \quad
\psi = \arctan2( (x_{k+1}-x_k), (y_{k+1}-y_k) )
\]
These computed values are stored and used for alert generation. Table 4 lists the fields in the radar track database.
| Field | Description | Type |
|---|---|---|
| Track ID | Unique track identifier | Integer |
| Timestamp | Time of last update | DateTime |
| X (UTM) | Easting coordinate | Double (m) |
| Y (UTM) | Northing coordinate | Double (m) |
| Z | Altitude (MSL) | Double (m) |
| Speed | Ground speed | Double (m/s) |
| Heading | True heading | Double (°) |
| Radial Velocity | Range rate from radar | Double (m/s) |
| Detection Count | Number of scans since track initiation | Integer |
| Status | Active, coasting, lost | Enum |
3.3 Video and Optical Processing
When an alert is raised, the optical data processing server calculates the required pan and tilt angles to point a camera toward the target’s predicted location. The camera’s field of view and zoom are adjusted to maintain a suitable image scale. The video stream is encoded (H.265) and sent to the large display and the IP‑SAN storage. Real‑time video analytics can further classify the target type (e.g., quadcopter, fixed‑wing) and even read registration numbers if resolution permits. The entire video recording is associated with the event log for post‑incident analysis, an essential feature for compliance in drone regulation.
4. Key Performance Metrics and Formulas
To evaluate the effectiveness of G-Cloud in drone regulation, we define several metrics. The radar detection probability \(P_d\) and false alarm rate \(P_{fa}\) are fundamental. For a Swerling 1 target, the relationship between signal‑to‑noise ratio (SNR) and detection probability is given by:
\[
P_d = \exp\left(-\frac{V_T}{1+\text{SNR}}\right)
\]
where \(V_T\) is the detection threshold determined by \(P_{fa}\):
\[
V_T = \ln\left(\frac{1}{P_{fa}}\right)
\]
If the required false alarm rate is \(10^{-6}\), then \(V_T = \ln(10^6) \approx 13.82\). With an SNR of 10 dB (linear factor 10), the detection probability becomes:
\[
P_d = \exp\left(-\frac{13.82}{1+10}\right) = \exp(-1.256) \approx 0.285
\]
This illustrates that higher SNR or lower threshold is needed for reliable detection. In practice, G-Cloud uses multiple radar scans and track‑before‑detect (TBD) algorithms to improve sensitivity.
Another critical metric is the data update latency. Let \(T_{\text{air}}\) be the transmission delay of airborne telemetry, \(T_{\text{proc}}\) the processing time on the server, and \(T_{\text{net}}\) the network delay from server to terminal. The end‑to‑end latency \(L\) is:
\[
L = T_{\text{air}} + T_{\text{proc}} + T_{\text{net}}
\]
For cellular networks, \(T_{\text{air}}\) may range from 50 ms (4G) to 10 ms (5G). The processing time on the airborne data server is typically below 5 ms per message. With a geographic distance of 100 km, \(T_{\text{net}}\) is approximately 0.5 ms in fiber. Thus, overall latency is dominated by the wireless link. G-Cloud is designed to operate with latencies under 200 ms, sufficient for real‑time monitoring.
5. Comparison with Existing Drone Regulation Systems
We compare G-Cloud with two other common approaches: stand‑alone radar surveillance and network‑based remote ID (RID) only. Table 5 summarizes the comparison.
| Feature | G-Cloud | Radar‑Only | RID‑Only |
|---|---|---|---|
| Detection of non‑cooperative drones | Yes (radar + optical) | Yes | No |
| Real‑time flight plan verification | Yes | Limited | Yes |
| Visual confirmation | Yes | No | No |
| Scalability (cloud based) | High | Low | Medium |
| Compliance with Chinese regulations | Designed for | Partial | Partial |
| Data integration (ADS‑B, cellular) | Multi‑source | Single source | Single source |
| Alarm automation and mobile push | Full | Basic | Basic |
As shown, G-Cloud provides a comprehensive solution that addresses both cooperative and non‑cooperative drones, making it a superior tool for drone regulation authorities.
6. Future Extensions and Conclusion
G-Cloud is designed with modularity and extensibility in mind. Future enhancements may include integration with UTM (Unmanned Traffic Management) services, dynamic geofence updates based on airspace notices, and machine learning‑based flight behavior prediction. The system already supports multiple communication links (3G/4G/5G/ADS‑B/Beidou/low‑altitude radar), allowing seamless operation across different environments. As drone regulation becomes more stringent worldwide, systems like G-Cloud will become indispensable for ensuring safety and security. We believe that our design provides a practical, scalable, and robust framework that can be adapted to various national regulatory frameworks.
In conclusion, G-Cloud leverages the synergy of airborne telemetry, radar surveillance, optical tracking, and cloud computing to deliver a holistic drone regulation platform. With its ability to monitor, alert, record, and analyze drone activities in real time, it significantly mitigates the risks associated with unauthorized drone operations. The system has been validated through simulation and field tests, demonstrating high detection probability and low false alarm rates, thereby fulfilling the demanding requirements of modern airspace management.
Table 6 lists the primary system functions covered in the application layer.
| Function Category | Specific Functions |
|---|---|
| Real‑time Monitoring | Drone positions on live map, speed/altitude indicators |
| Alert Management | Geofence crossing, no‑fly zone entry, low battery, unauthorized flight |
| Target Tracking | Automatic radar‑optical fusion, track history playback |
| Historical Analysis | Trajectory replay, statistics by area/time/type |
| System Administration | User roles, device management, log audit |
| Automatic Duty | Intelligent patrol, handover of tracks between radars |
We are confident that the G-Cloud system will serve as a cornerstone for future drone regulation initiatives, ensuring that the skies remain safe and secure for all.