
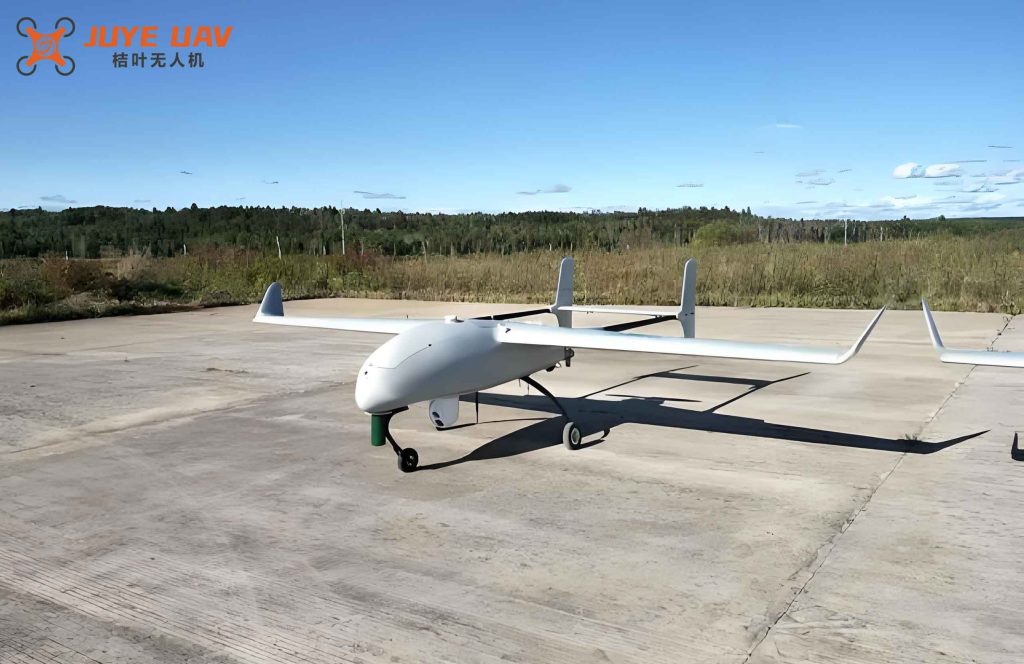
In modern warfare, small fixed-wing drones and their swarms have become a significant threat, challenging current air defense systems. Understanding the high-power microwave (HPM) effects on these platforms is crucial for developing countermeasures. In this study, I conducted a comprehensive investigation into the S-band HPM vulnerability of a typical small fixed-wing drone, using electromagnetic modeling, coupling simulations, and effect tests at system, subsystem, and component levels. The objective was to identify the most sensitive parts and quantify the power density thresholds that lead to disruption or damage.
The research began with defining the HPM electromagnetic environment. According to IEC 61000-2-13, narrowband HPM sources operate in the 1–300 GHz range with peak powers from 100 MW to 100 GW. For this work, a center frequency of 3 GHz was used, with a pulse width on the order of microseconds. In simulations, the pulse width was reduced to 3 ns to save computational time while preserving the essential coupling characteristics. The normalized incident electric field waveform can be expressed as:
$$ E(t) = \begin{cases} E_0 \sin(2\pi f_0 t) u(t-T) & 0 < t < T(N+1) \\ 0 & T(N+1) < t \end{cases} $$
where $E_0$ is the peak field amplitude, $f_0 = 3$ GHz, and $T$ is the microwave period. The system under test was a small fixed-wing drone made of polystyrene ($\varepsilon_r = 2.55$, $\mu_r = 1$, $\tan\delta = 7 \times 10^{-4}$). The critical components included a battery, a communication and control receiver, servos, a brushless DC motor, and interconnecting cables.
Electromagnetic Modeling and Coupling Simulations
I built a three-dimensional geometric model of the fixed-wing drone and assigned appropriate electromagnetic properties to each part. The model was illuminated by a plane wave with a power density of 10 W/cm² at S-band. The simulation revealed significant field enhancement at the wing tips, reaching up to 24 kV/m. Table I summarizes the induced electric fields at key locations inside the drone body.
| Location | Peak Induced E-field (kV/m) | Duration (ns) |
|---|---|---|
| DC Power Supply Area | 13.9 | 2.3 – 6.0 |
| Receiver Module | 7.9 | 3.3 – 7.6 |
| Wing Servo | 6.3 | 3.8 – 6.5 |
| Brushless Motor | 9.6 | 7.0 – 10.0 |
Next, I modeled the entire cable network inside the fixed-wing drone: servo control lines (diameter 14 mm), battery power lines, and brushless motor three-phase lines (diameter 50 mm). The cables were placed horizontally inside the fuselage, and the incident wave was vertically polarized at 10 W/cm². A lumped-parameter equivalent circuit was used to evaluate induced voltages at critical ports P1 through P4. Table II lists the peak induced voltages.
| Port | Cable Description | Peak Voltage (V) |
|---|---|---|
| P1 | DC Battery Power Line | 1.2 |
| P2 | Brushless Motor Control Line | 0.9 |
| P3 | Fuselage Servo Control Line | 1.1 |
| P4 | Wing Servo Control Line | 1.9 |
The receiver board, which is the most sensitive subsystem of the fixed-wing drone, was then modeled in detail. Under 10 W/cm² incident power density, the simulated internal electric field peaked at 257 kV/m, with many sensitive tracks exceeding 100 kV/m. Voltage monitors at three critical points provided data summarized in Table III.
| Monitor Point | Description | Peak Voltage (V) | Oscillation Duration (ns) |
|---|---|---|---|
| N1 | Board Pin Header | 4.5 | ~3 |
| N2 | Communication Chip Pin | 2.8 | ~2.5 |
| N3 | Control Chip Pin (to ground) | 3.2 | ~3 |
The induced voltages exhibited periodic oscillations lasting approximately 3 ns. For a standard CMOS input threshold of about 1 V, these levels clearly posed a risk of logic upset. I further performed a parametric study by varying the incident power density. Figure 1 in the original paper (not reproduced here) showed a linear relationship: at 5 W/cm² the pin header voltage exceeded 3 V, and at 10 W/cm² it reached 4.5 V. The receiver’s antenna (a 920 MHz half-wave dipole) offers negligible coupling at 3 GHz, so all coupling occurred through the back-door path (cables, slots, and board traces).
High-Power Microwave Effect Tests
To validate the simulations, I conducted HPM radiation tests on the complete fixed-wing drone and on its subsystems. The test setup consisted of an S-band HPM source (vertical polarization, adjustable pulse width, repetition rate, and power density), a microwave measurement system, and the device under test placed horizontally facing the source. The power density as a function of distance is given by the standard radar equation:
$$ E = \frac{\sqrt{30 P G}}{R} $$
where $P$ is the transmitter power, $G$ the antenna gain, and $R$ the distance. The relationship between distance and power density is shown in Table IV.
| Distance (m) | Power Density (W/cm²) |
|---|---|
| 10 | 10.5 |
| 12 | 7.9 |
| 15 | 5.5 |
During system-level tests, I observed no stable effects at 5.5 W/cm². At 7.9 W/cm², the fixed-wing drone exhibited consistent disruption: the receiver lost communication with the controller, and both the brushless motor and all servos stopped. After repeated exposures at 10.5 W/cm², permanent failure occurred. To identify the critical path, I performed subsystem tests.
First, I disconnected all servo cables from the drone, leaving only the receiver, electronic speed controller (ESC), and brushless motor. At 7.9 W/cm², the receiver still lost communication and the motor stopped. This indicated that servo cables were not the primary entry path. Second, I disconnected the motor and its three-phase cables, keeping only the receiver, battery, and wing servos. At 7.9 W/cm², the receiver lost communication and the servos froze. Thus, the brushless motor cable also played a minor role. The receiver itself was the common element in all failures.
Finally, I isolated the receiver module and exposed it alone. The battery was placed inside an EMI shielded box, and I monitored the receiver’s communication and control pins before and after irradiation. At 7.9 W/cm², the receiver lost connection with the remote controller. Post-test measurements showed that one communication pin output a constant DC level, the second communication pin had no output, and one control pin produced no signal (see Table V).
| Pin | Function | Before Exposure | After Exposure |
|---|---|---|---|
| Pin A | Communication 1 | Normal PWM | Constant DC |
| Pin B | Communication 2 | Normal PWM | No output |
| Pin C | Control 1 | Normal signal | No output |
The test results quantitatively matched the simulation predictions. At 7.9 W/cm², the simulated induced voltages on the receiver pins were approximately 3.5–4 V, which is above the typical logic threshold of 1–2 V for modern microcontrollers The observed communication loss and pin output anomalies are consistent with a digital upset or latch-up caused by back-door coupling into the receiver board.
Conclusion
Through combined simulation and experiment, I have systematically analyzed the HPM vulnerability of a small fixed-wing drone. The receiver module was identified as the most sensitive component, due to its exposed circuit board traces and absence of shielding. Cable coupling induced voltages up to 1.9 V, but the receiver board itself amplified coupling, leading to pin voltages exceeding 4.5 V at 10 W/cm². The threshold for stable disruption was found to be 7.9 W/cm², at which the receiver lost functionality and caused system-level failure. These findings provide a quantitative basis for hardening fixed-wing drones against HPM threats, such as adding shielding to the receiver, filtering I/O lines, and using transient protection devices. Future work will extend the study to different frequency bands and pulse parameters to develop comprehensive protection guidelines for fixed-wing drones in high-power microwave environments.
| Power Density (W/cm²) | Simulated Receiver Pin Voltage (V) | Observed Effect |
|---|---|---|
| 5.5 | ~2.5 | Intermittent communication loss |
| 7.9 | ~3.5–4.0 | Stable disruption (communication lost, pins frozen) |
| 10.5 | ~4.5 | Permanent failure after multiple pulses |
In conclusion, the back-door coupling into the receiver circuit board is the dominant failure mechanism for this class of fixed-wing drones when exposed to S-band HPM. The power density threshold for reliable upset is around 7.9 W/cm², a value that aligns well with the simulation predictions. This work highlights the importance of component-level shielding and filtering in enhancing the survivability of fixed-wing drones against high-power microwave threats.