
In formation flight, the reasonable application of wake surfing technology enables the trailing fixed-wing drone to achieve significant lift enhancement. Inspired by the V-shaped formation of migratory birds, I designed a formation composed of two fixed-wing drones. Using computational fluid dynamics (CFD), I generated overset grids between the fixed-wing drone and the fluid domain, performed numerical simulations on the flight formation, and analyzed the aerodynamic parameters. The results indicate that the wake surfing effect has minimal impact on the leading fixed-wing drone, but significantly influences the trailing fixed-wing drone. The longitudinal and vertical spacing between the two fixed-wing drones affect the lift coefficient, drag coefficient, lift-to-drag ratio, and pitch moment of the trailing fixed-wing drone. At an appropriate position and angle of attack, the lift coefficient of the trailing fixed-wing drone can be increased by 11.7%.
1. Numerical Simulation and Wake Identification
1.1 Governing Equations of Fluid Flow
Based on the Navier-Stokes (N-S) equations, I described the fundamental motion of turbulence. The three-dimensional steady compressible N-S equations are derived from mass, momentum, and energy conservation laws.
Mass conservation equation:
$$
\frac{\partial (\rho u_i)}{\partial x_i} = 0
$$
Momentum conservation equation:
$$
\frac{\partial (\rho u_i u_j)}{\partial x_j} = F_i + \rho g_i + \frac{\partial \tau_{ij}}{\partial x_j} – \frac{\partial p}{\partial x_i}
$$
Energy conservation equation:
$$
\Delta (\rho u H – K \Delta T – \zeta u) = W
$$
where \(u_i\) is the velocity component in the \(x_i\) direction, \(\rho\) is the air density, \(u_j\) is the velocity in the \(x_j\) direction, \(g_i\) is the gravitational acceleration in the \(i\) direction, \(F_i\) is the external body force in the \(i\) direction, \(\tau_{ij}\) is the subgrid-scale stress tensor, \(p\) is the air pressure, \(H\) is the total enthalpy, \(K\) is the thermal conductivity, \(\zeta u\) is the viscous shear stress tensor, and \(W\) is the work done by external body forces.
1.2 Turbulence Model Equations
I employed the \(k-\omega\) SST (Shear Stress Transport) model, which is more accurate than the standard \(k-\omega\) model. The model uses the Wilcox \(k-\omega\) formulation near the wall and the \(k-\varepsilon\) formulation in the boundary layer edge and free shear layer, connected by a blending function. The \(k-\omega\) SST equations are:
$$
\frac{\partial}{\partial t}(\rho k) + \frac{\partial}{\partial x_i}(\rho k u_i) = \frac{\partial}{\partial x_i} \left( \Gamma_k \frac{\partial k}{\partial x_j} \right) + G_k – A_k + B_k
$$
$$
\frac{\partial}{\partial t}(\rho \omega) + \frac{\partial}{\partial x_i}(\rho \omega u_i) = \frac{\partial}{\partial x_j} \left( \Gamma_\omega \frac{\partial \omega}{\partial x_j} \right) + G_\omega – A_\omega + D_\omega + B_\omega
$$
where \(G_k\), \(G_\omega\) are the generation of turbulent kinetic energy due to mean velocity gradients; \(\Gamma_k\), \(\Gamma_\omega\) are the effective diffusivity of \(k\) and \(\omega\); \(A_k\), \(A_\omega\) are the dissipation of \(k\) and \(\omega\) due to diffusion; \(D_\omega\) is the cross-diffusion term; \(B_\omega\), \(B_k\) are user-defined source terms.
1.3 Finite Volume Method
I applied the finite volume method (FVM) to discretize the computational domain into many small control volumes. The three-dimensional steady compressible N-S equations were solved by integrating over each control volume, converting the integral equations into algebraic or ordinary differential equations.
1.4 Omega Vortex Identification Method
I used the Omega (\(\Omega\)) vortex identification method proposed by Liu Chaoqun. Unlike the Q method, the Omega method normalizes the vortex strength and avoids sensitivity to threshold values. The expressions are:
$$
Q = 0.5 (\|E\|_F^2 – \|M\|_F^2)
$$
$$
\Omega = \frac{\|E\|_F^2}{\|M\|_F^2 + \|E\|_F^2 + \epsilon}
$$
where \(\|M\|_F^2\) is the squared Frobenius norm of the symmetric part of the velocity gradient tensor, \(\|E\|_F^2\) is the squared Frobenius norm of the antisymmetric part, and \(\epsilon\) is a small positive constant defined as \(\epsilon = \frac{1}{1000} \max(\|E\|_F^2 – \|M\|_F^2) = \max(Q)/500\). The Omega method is dimensionless, insensitive to threshold, and can capture both strong and weak vortices simultaneously.
2. Preliminary Work
2.1 Computational Model of the Fixed-Wing Drone
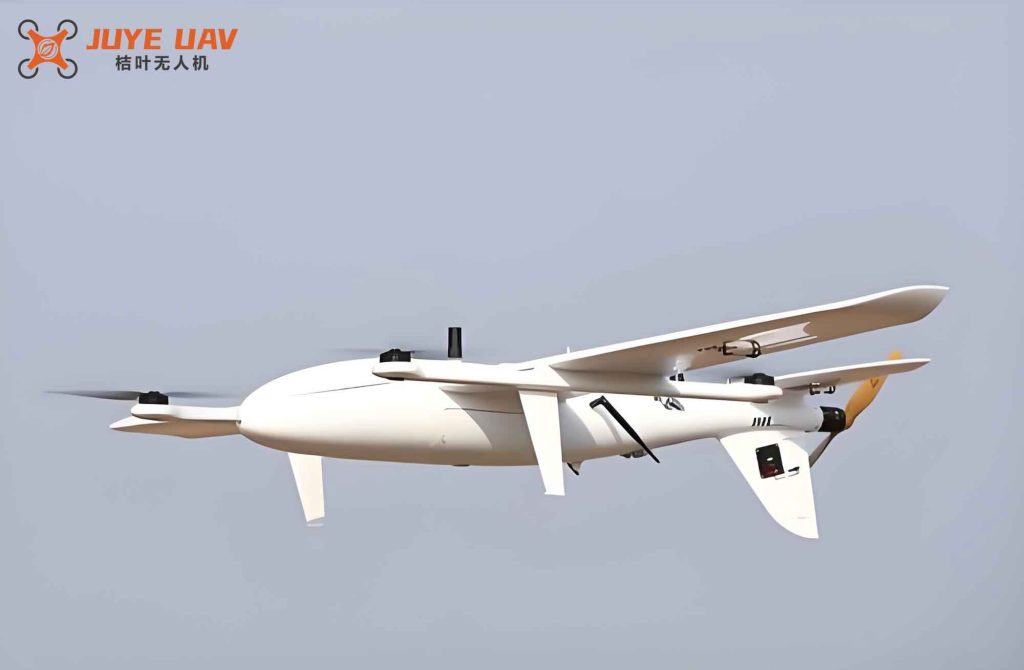
I selected a standard fixed-wing drone model with a wingspan of \(b=2\) m, which offers high versatility and a high lift-to-drag ratio. Based on this, I designed a two-fixed-wing-drone formation as shown schematically in the following configuration: the leading fixed-wing drone is called the front fixed-wing drone, and the trailing one is the rear fixed-wing drone. The longitudinal distance is \(\Delta x\), the lateral distance (overlap of wings) is \(\Delta z = 0.75b\), and the vertical distance is \(\Delta y\), which includes two cases: same altitude and rear fixed-wing drone above the front fixed-wing drone.
2.2 Overset Grid Generation
To facilitate aerodynamic interaction and reduce meshing effort, I used ANSYS Workbench with overset grid technology to generate structured computational grids for the two-fixed-wing-drone formation. The overset grid consists of a background grid and multiple subgrids. The background grid is a rectangular domain approximately 16 times the wingspan in length, 8 times in width, and 4 times in height. The subgrids are generated around each fixed-wing drone. The first layer height is about 0.002 mm, ensuring \(y^+ < 1\) at Mach 0.44. The total number of grid cells is about 10 million.
2.3 Grid Independence Verification
I verified the reliability of the numerical method by varying the grid count. Four different grid sizes were tested at a freestream velocity of about 70 m/s. The lift-to-drag ratio (K) results are shown in Table 1.
| Grid count (×10⁴) | K |
|---|---|
| 300 | 8.134 |
| 500 | 8.175 |
| 1000 | 8.254 |
| 1500 | 8.287 |
The results show that the numerical method and grid strategy are reasonable.
2.4 Accuracy Verification of Overset Grid
I compared the lift coefficient \(C_L\) of the NACA-0012 airfoil between structured and overset grids at different angles of attack. The difference in lift-to-drag ratio was only 1.8% with a large grid count, indicating that the overset grid provides high accuracy and avoids negative-volume and distorted grids. This allows independent adjustment of the angle of attack of the rear fixed-wing drone without changing the overall grid, enabling precise simulation of wake surfing.
2.5 Boundary Conditions
The freestream Mach number was 0.44, atmospheric pressure 88,000 Pa, temperature 280.54 K, air set as ideal gas, angle of attack \(\alpha = 8^\circ\). The viscosity was modeled using Sutherland’s law. I used a density-based implicit solver for steady-state solution. The wing surfaces were set as no-slip adiabatic walls. Turbulence intensity was 2%, and turbulent viscosity ratio was 10. The inlet was set as velocity inlet and outlet as pressure outlet.
3. Simulation Results of Two-Fixed-Wing-Drone Formation
3.1 Benefit of Wake Surfing in Formation
At Mach 0.44 and 88,000 Pa, a single fixed-wing drone at \(\alpha=8^\circ\) has \(C_L=0.1522\). When the two fixed-wing drones fly in formation with \(\Delta x = 0.9b\), \(\Delta y = 0\), \(\Delta z = 0.75b\), the aerodynamic data are shown in Table 2.
| Parameter | Single (α=8°) | Front (α=8°) | Rear (α=8°) | Rear (α=6.54°) |
|---|---|---|---|---|
| \(C_L\) | 0.1522 | 0.1512 | 0.1689 | 0.1512 |
| \(C_D\) | 0.0185 | 0.0184 | 0.0181 | 0.0149 |
| \(C_M\) | 0.0046 | 0.0047 | 0.0071 | 0.0063 |
| K | 8.22 | 8.21 | 9.33 | 10.14 |
The formation has little effect on the front fixed-wing drone, but the rear fixed-wing drone experiences an 11.7% increase in \(C_L\) and a 13.6% increase in K at the same angle of attack. By reducing the angle of attack of the rear fixed-wing drone to 6.54°, the lift coefficient matches that of the front fixed-wing drone while achieving a drag reduction of 23.5% (from 0.0185 to 0.0149). The lift-to-drag ratio of the rear fixed-wing drone reaches 10.14.
3.2 Wake Surfing Parameters at Different Spacings
I investigated the effect of longitudinal spacing \(\Delta x\) and vertical spacing \(\Delta y\) on the rear fixed-wing drone’s performance. Table 3 summarizes the results.
| Δy | Δx | Rear \(C_L\) | Rear K | Rear \(C_M\) |
|---|---|---|---|---|
| 0 | 0.9b | 0.1689 | 9.33 | 0.0071 |
| 1.1b | 0.1641 | 9.16 | 0.0064 | |
| 1.5b | 0.1583 | 8.84 | 0.0059 | |
| 2.0b | 0.1542 | 8.56 | 0.0051 | |
| 0.10b | 0.9b | 0.1637 | 9.04 | 0.0061 |
| 1.1b | 0.1590 | 8.83 | 0.0058 | |
| 1.5b | 0.1575 | 8.71 | 0.0051 | |
| 2.0b | 0.1541 | 8.46 | 0.0049 | |
| 0.25b | 0.9b | 0.1614 | 8.89 | 0.0059 |
| 1.1b | 0.1585 | 8.65 | 0.0054 | |
| 1.5b | 0.1573 | 8.47 | 0.0049 | |
| 2.0b | 0.1533 | 8.34 | 0.0048 |
The results indicate that the wake surfing benefit decreases with increasing \(\Delta x\) and \(\Delta y\). The rear fixed-wing drone experiences a pitch moment increase that must be considered for flight control.
4. Flow Field Analysis of Two-Fixed-Wing-Drone Formation
4.1 Visualization of Wake Vortex Field
As a fixed-wing drone flies, the pressure difference between the upper and lower wing surfaces generates wingtip vortices. These vortices induce an upwash flow outside the vortex core and a downwash flow inside. I visualized the velocity distribution in the y-direction at different cross-sections downstream of the front fixed-wing drone. The upwash region behind the left wingtip of the front fixed-wing drone clearly exists. Placing the rear fixed-wing drone in this upwash flow increases its lift coefficient. The velocity magnitude in the y-direction decreases as the downstream distance increases due to vortex dissipation, but the affected area expands.
4.2 Pressure Distribution Analysis
I compared the pressure distribution on the left wing of the front fixed-wing drone and the right wing of the rear fixed-wing drone at the same chordwise location (corresponding to \(\Delta z = 0.15b\) on the front and \(\Delta z = 0.6b\) on the rear). At \(\Delta x = 0.9b\), \(\Delta y = 0\), the pressure on the leading edge of the rear fixed-wing drone’s wing is significantly higher than that of the front fixed-wing drone. As \(\Delta x\) and \(\Delta y\) increase, the pressure distributions become more similar, indicating a reduction in wake surfing benefit.
4.3 Vorticity Comparison of the Rear Fixed-Wing Drone
I used the Omega method to visualize the vorticity at a cross-section \(x = 23.63\) m behind the rear fixed-wing drone. The left wingtip vortex of the rear fixed-wing drone had \(\Omega = 0.84\), while the right wingtip vortex had \(\Omega = 0.73\) when \(\Delta y = 0.25b\). The right wingtip vortex of the rear fixed-wing drone is weakened by the opposite rotation of the front fixed-wing drone’s left wingtip vortex, while the left wingtip vortex is slightly enhanced due to the same rotation direction. This asymmetry in vortex strength affects the aerodynamic load distribution on the rear fixed-wing drone.
5. Conclusions
In this study, I designed a two-fixed-wing-drone formation based on the V-shaped migratory bird pattern, utilizing overset grids to enhance the aerodynamic interaction between the fixed-wing drones. Numerical simulations using CFD and the Omega vortex identification method revealed the following key findings:
- The formation flight has minimal influence on the aerodynamic characteristics of the leading fixed-wing drone, but significantly affects the trailing fixed-wing drone.
- By properly adjusting the angle of attack of the rear fixed-wing drone, the lift coefficient can be maintained while achieving a drag reduction of up to 23.5%.
- The wake surfing benefit decreases with increasing longitudinal and vertical spacing between the two fixed-wing drones.
- The rear fixed-wing drone experiences an additional pitch moment that makes it longitudinally statically unstable, requiring careful flight control.
- The aerodynamic interference primarily originates from the upwash flow induced by the wingtip vortices of the front fixed-wing drone.
These findings demonstrate the potential of wake surfing for improving the efficiency of fixed-wing drone formations. Future work will involve more precise fixed-wing drone models and multi-fixed-wing drone formations to further explore the benefits of wake surfing.