
In the context of high-level radioactive waste geological disposal, the surrounding rock serves as a critical natural barrier within the multi-barrier system. Structural fractures developed within the host rock can significantly influence the stability and hydraulic conductivity of the disposal site, potentially creating pathways for radionuclide migration to the biosphere over timescales exceeding ten thousand years. Therefore, understanding the characteristics and spatial distribution of structural fractures is paramount for site selection and safety assessment. Our research focuses on developing a reliable methodology for identifying and extracting fracture parameters using drone technology, which offers significant advantages in efficiency, safety, and data density compared to conventional field surveys.
This study was conducted based on the underground exploratory tunnel facility completed in a preselected granite area in Gansu Province, China. We employed drone technology to acquire high-resolution imagery of the surface granite bedrock outcrops surrounding the tunnel entrance. The collected data were processed using Structure from Motion (SfM) algorithms integrated into commercial software to construct a high-density three-dimensional point cloud model. From this model, structural fractures were identified and their geometric parameters—orientation, dip angle, and trace length—were extracted. The results obtained through drone photogrammetry were systematically compared with manual field measurements to evaluate the accuracy and reliability of this approach.
Our findings demonstrate that drone technology can achieve high accuracy in fracture parameter extraction. The mean absolute error for fracture strike and dip angle was found to be within an acceptable range for engineering geological applications. Furthermore, we observed a clear correlation between the accuracy of dip angle measurements and the trace length of the fractures, with longer fractures yielding more reliable results. This study validates drone-based photogrammetry as an effective and practical tool for structural fracture characterization in bedrock-exposed terrains, providing a valuable reference for future site investigations in similar geological settings.
Introduction
The safe disposal of high-level radioactive waste is a global challenge that requires robust and reliable isolation systems. Deep geological disposal, which involves placing waste in engineered repositories within stable geological formations, is the internationally accepted strategy. The surrounding rock mass acts as the final natural barrier, and its integrity is crucial for long-term safety. Structural fractures, such as joints, faults, and shear zones, are ubiquitous in rock masses and can compromise their mechanical stability and increase permeability. In the context of a geological repository, these fractures could potentially become preferential pathways for groundwater flow and radionuclide transport. Consequently, a thorough understanding of the fracture network—including its orientation, density, persistence, and aperture—is essential for repository design and performance assessment.
Traditional methods for fracture characterization rely on manual field measurements using a compass, inclinometer, and measuring tape. While these methods provide direct and accurate data, they are time-consuming, labor-intensive, and often limited in spatial coverage, especially in areas with complex topography or difficult access. Furthermore, manual measurements are inherently subjective and may suffer from sampling bias, as only fractures that are easily accessible or visually prominent are typically measured.
In recent years, drone technology has emerged as a powerful tool for geological mapping and structural analysis. Unmanned aerial vehicles equipped with cameras can capture high-resolution images of terrain and rock exposures from various angles, providing a comprehensive view of the study area. When combined with Structure from Motion (SfM) photogrammetry, these images can be processed to generate high-density three-dimensional point clouds and orthophotos, from which geological structures can be identified and quantified. Drone-based surveys offer several advantages over traditional methods, including: (1) rapid data acquisition over large areas; (2) access to hazardous or inaccessible terrain; (3) objective and reproducible data; and (4) the ability to create a permanent digital record for future analysis.
Study Area
The study area is located in a remote, arid region of northwestern China, approximately 60 kilometers north of a major city in Gansu Province. This area is characterized by a typical Gobi Desert landscape, with sparse vegetation and extensive bedrock exposures. The topography consists of low mountains and hills, with elevations ranging from 1,600 to 1,800 meters above sea level. The climate is continental and arid, with low annual precipitation and frequent strong winds, which contribute to pronounced physical weathering of the rock surfaces.
The dominant lithology in the area is granite, including porphyritic monzogranite, biotite granodiorite, and tonalite. These rocks are part of a large batholith that intruded during the Paleozoic era. The region has been subjected to multiple phases of tectonic deformation, resulting in a complex fracture network. The major structures include NE-NNE trending strike-slip faults and near-EW trending thrust faults. The fracture system within the granite is dominated by two main sets: one striking NNE and the other near-EW, both characterized by steep dip angles generally exceeding 70°.
Our study area is specifically located near the entrance of an underground exploratory tunnel, which was constructed as part of the site characterization program for a potential high-level radioactive waste repository. This tunnel provides access to the subsurface for detailed geological and hydrogeological investigations. The surface area around the tunnel entrance is characterized by well-exposed granite outcrops, making it an ideal location for testing and validating drone-based fracture mapping techniques.
Methodology
Overall Technical Approach
Our methodological framework was designed to evaluate the capability of drone technology for structural fracture characterization and consists of three main stages. The first stage involves drone-based image acquisition, including pre-flight planning, on-site reconnaissance, and systematic aerial photography. The second stage focuses on three-dimensional model reconstruction using SfM photogrammetry software. The third stage entails fracture interpretation and parameter extraction from the reconstructed model, followed by validation against manual field measurements.
The key innovation in our approach lies in the integration of drone technology with advanced photogrammetric algorithms to create a highly accurate, spatially referenced digital representation of the rock surface. This digital model serves as a virtual outcrop that can be interrogated and analyzed in detail, allowing for the extraction of fracture parameters with high precision and repeatability. By comparing the results obtained from drone photogrammetry with those from traditional manual measurements, we aim to quantify the accuracy and limitations of this emerging technology for structural geological applications.
Drone-Based Image Acquisition
For this study, we utilized a commercial quadcopter drone equipped with a high-resolution camera, inertial navigation system, and global navigation satellite system (GNSS) receiver. The drone we selected is lightweight, portable, and capable of autonomous flight along pre-programmed waypoints. The camera has a fixed focal length and captures images with a resolution of 4000×3000 pixels. Each image is geotagged with the precise latitude, longitude, and altitude information recorded by the onboard GNSS receiver, which is essential for subsequent photogrammetric processing.
Our flight planning strategy was designed to maximize the quality and coverage of the acquired imagery while ensuring flight safety. The study area was first delineated on a pre-existing topographic map, and a flight route was planned in a serpentine pattern to ensure complete coverage with sufficient overlap between adjacent images. The flight altitude was set to 40 meters above the takeoff point, which provided a ground sampling distance of approximately 3-5 centimeters per pixel. This relatively low flying height was chosen to capture fine details of the rock surface and fracture traces. The image overlap was set to at least 80% in the flight direction and 60% in the perpendicular direction, which is essential for successful SfM processing.
A total of 459 images were acquired during a single flight mission covering an area approximately 200 meters long and 180 meters wide. The entire flight operation, including pre-flight checks, takeoff, image acquisition, and landing, took approximately 30 minutes to complete. The compact size and ease of deployment of our drone technology allowed for rapid data collection with minimal field time. Upon completion of the flight, the images were downloaded and inspected for quality. We discarded any images that were blurry, overexposed, or affected by motion artifacts. The remaining high-quality images were used for subsequent processing.
To facilitate ground truth validation and assess the accuracy of the reconstructed model, we deployed several ground control points (GCPs) within the survey area. These GCPs consisted of high-contrast targets placed on the ground surface, whose coordinates were measured using a differential GNSS receiver with centimeter-level accuracy. While initial processing was performed without incorporating GCPs to evaluate the absolute accuracy of the direct georeferencing, the final model was refined using these control points to achieve the highest possible spatial accuracy.
Table 1 summarizes the specifications of our drone-based data acquisition system and the parameters used for this survey.
| Parameter | Specification |
|---|---|
| Drone type | Quadcopter, lightweight |
| Camera resolution | 4000 × 3000 pixels |
| Focal length | 20.0 mm |
| Flight altitude | 40 m above takeoff point |
| Ground sampling distance | 3–5 cm/pixel |
| Image overlap (along track) | ≥ 80% |
| Image overlap (cross track) | ≥ 60% |
| Number of images acquired | 459 |
| Survey area | ~200 m × 180 m |
| GNSS system | GPS + GLONASS |
Image Processing and 3D Model Reconstruction
The core of our methodology is the application of Structure from Motion (SfM) photogrammetry, a computer vision technique that allows for the reconstruction of three-dimensional geometry from a series of overlapping two-dimensional images. The SfM workflow implemented in our study involves several sequential steps, each critical to the final model quality.
The first step involves feature detection and matching using the Scale-Invariant Feature Transform (SIFT) algorithm. SIFT identifies distinctive key points within each image that are invariant to changes in scale, rotation, and illumination. These key points are then matched across overlapping image pairs to establish correspondences. The SIFT algorithm is particularly robust for geological applications because it can handle the complex textures and variable lighting conditions typical of rock surfaces.
The second step uses the established correspondences to estimate the camera positions and orientations for each image, as well as the three-dimensional coordinates of the matched feature points. This is achieved through an iterative bundle adjustment process, which simultaneously optimizes the camera parameters and the scene geometry by minimizing the reprojection error. The output of this step is a sparse point cloud representing the geometry of the scene at the locations of the matched features.
The third step involves dense matching, where the algorithm searches for additional correspondences between image pixels that were not identified as SIFT features. This step generates a much denser point cloud, typically containing millions of points, which provides a detailed representation of the surface geometry. The density of the resulting point cloud is a function of the image resolution, the overlap between images, and the texture of the surface being imaged. In our study, the average point cloud density achieved was approximately 2,917 points per square meter. This high density enables the resolution of fine-scale features such as individual fracture traces and small-scale surface roughness.
We used a commercial software package that integrates the complete SfM workflow for processing our drone imagery. The processing was performed on a high-performance workstation equipped with a multi-core processor and a large amount of RAM. The processing time for the 459 images, including the generation of the dense point cloud, was approximately 8 hours. The final dense point cloud contained approximately 105 million points.
From the dense point cloud, we generated additional products, including a digital elevation model (DEM) and an orthophoto mosaic. The DEM provides a regular grid of elevation values, while the orthophoto is a geometrically corrected, seamless mosaic of the individual images. These products are useful for regional-scale structural analysis and for integrating the fracture data with other geospatial datasets.
The mathematical foundation of the bundle adjustment process can be expressed as an optimization problem. The goal is to find the set of camera parameters and three-dimensional point coordinates that minimize the sum of squared reprojection errors:
$$ \min_{\mathbf{P}_j, \mathbf{X}_i} \sum_{i=1}^{N} \sum_{j=1}^{M} v_{ij} \cdot \left| \mathbf{x}_{ij} – \pi(\mathbf{P}_j, \mathbf{X}_i) \right|^2 $$
where \(\mathbf{X}_i\) is the three-dimensional coordinate of the i-th point, \(\mathbf{P}_j\) represents the projection matrix of the j-th camera (including its position, orientation, and intrinsic parameters), \(\mathbf{x}_{ij}\) is the observed image coordinate of point i in image j, \(\pi(\cdot)\) denotes the projection function that maps a 3D point onto the image plane, and \(v_{ij}\) is a binary visibility indicator (1 if point i is visible in image j, 0 otherwise). This non-linear least squares problem is solved iteratively using algorithms such as the Levenberg-Marquardt method to determine the optimal camera poses and scene geometry.
Fracture Identification and Parameter Extraction
The identification and parameter extraction of structural fractures from the reconstructed 3D model were performed using specialized geological analysis software designed for working with point cloud data. This software provides interactive tools for visualizing, analyzing, and interpreting geological structures within dense point clouds.
Our workflow began with the import of the dense point cloud generated by the SfM processing. The point cloud was visualized in three dimensions, allowing us to rotate, zoom, and pan to inspect the rock surface from any angle. The high density and color information of the point cloud made the fracture traces clearly visible, even for fractures with small apertures.
For each visible fracture, we manually digitized its trace by placing a series of points along its intersection with the ground surface. The software then automatically fitted a planar surface to these points, representing the best-fit fracture plane. The orientation of this plane was computed as its dip direction and dip angle, which are the standard measures of fracture orientation in structural geology. The dip direction is the compass direction of the horizontal projection of the steepest line on the plane, while the dip angle is the angle between the plane and the horizontal plane. The trace length was measured as the straight-line distance between the two endpoints of the digitized fracture trace.
We also recorded the coordinates of the center point of each fracture plane. This information allowed us to map the spatial distribution of fractures and correlate them with the geological structures observed in the field. For validation purposes, we identified and measured the same set of fractures in the field using traditional methods. A total of 58 fractures were measured both in the field and from the 3D model, providing a comprehensive dataset for evaluating the accuracy of drone-based fracture characterization.
It is important to note that while the software includes automated fracture detection algorithms, we chose to perform manual digitization for this study to ensure the highest possible accuracy for validation purposes. Manual digitization allows the operator to leverage geological expertise to distinguish between true fractures and other linear features such as weathering cracks, mineral veins, or topographic artifacts. Once the accuracy of the methodology is fully validated, automated approaches could potentially be employed for larger-scale surveys to increase efficiency.
Results
High-Precision Point Cloud Model
The application of the SfM workflow to our 459 drone-acquired images resulted in a high-precision, high-density point cloud model of the study area. The model extends approximately 200 meters in length and 180 meters in width, covering the entire area of interest around the tunnel entrance. The dense point cloud contains approximately 105 million points, with an average point spacing of less than 2 centimeters. This level of detail is sufficient to resolve the geometry of individual fractures and even small-scale surface roughness features.
To assess the geometric accuracy of the reconstructed model, we conducted an independent validation using the ground control points that were deployed in the field. The coordinates of these targets were measured with centimeter-level accuracy using differential GNSS, and their positions in the model were compared to the measured values. The results of this accuracy assessment are summarized in Table 2.
| Validation item | Field measurement | Model interpretation | Error |
|---|---|---|---|
| Target height above ground (m) | 0.825 | 0.839 | 0.014 m |
| Target surface dip angle (°) | 0 | 1 | 1° |
| Scale bar 1 length (m) | 1.200 | 1.190 | 0.010 m (0.83%) |
| Scale bar 1 orientation | N0°E | N5°W | 5° |
| Scale bar 2 length (m) | 1.200 | 1.170 | 0.030 m (2.50%) |
The validation results demonstrate that the reconstructed model achieves sub-decimeter accuracy in length measurements and angular accuracy within a few degrees. The length error for the scale bars was less than 2.5%, and the angular error for the orientation was 5°. The height error for the target was only 1.4 centimeters, and the dip angle error was 1°. These results confirm that our drone-based SfM methodology, even without the use of ground control points in the initial alignment, can produce models with sufficient accuracy for structural geological analysis. The incorporation of ground control points during the final model refinement further improved the absolute accuracy.
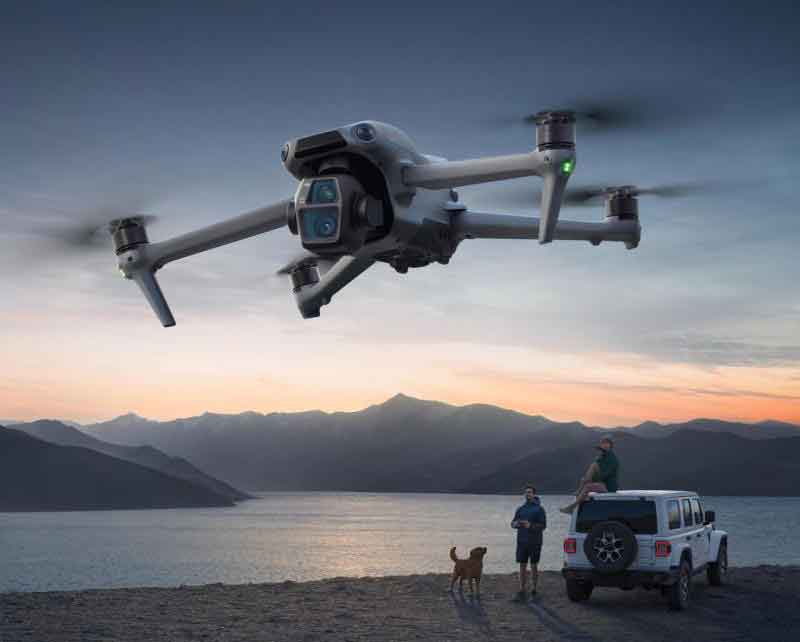
A representation of the unmanned aerial vehicle used in our study is shown for reference.
Fracture Interpretation and Parameter Extraction
From the high-precision point cloud model, we identified and extracted the parameters of 58 structural fractures that were also measured manually in the field. The fractures were primarily concentrated in two main orientation sets: one striking NNE and the other striking near-EW. The NNE-striking set predominantly dips to the SEE direction, while the near-EW set dips predominantly to the south. Both sets are characterized by steep dip angles, with most values exceeding 80°. This orientation pattern is consistent with the regional tectonic stress field and the known structural geology of the area.
Figure 7 in the original publication showed the orientation data in the form of pole density diagrams and rose diagrams, demonstrating the close correspondence between the field-measured and model-interpreted fracture orientations. Both datasets reveal the same bimodal orientation pattern, with the NNE and near-EW sets clearly distinguished. The dip angles are also in good agreement, with both datasets showing a predominance of steeply dipping fractures.
Table 3 presents a comparison of the orientation parameters (dip direction and dip angle) for a representative subset of the measured fractures, illustrating the correspondence between the field measurements and the model interpretations.
| Fracture ID | Dip direction field (°) | Dip direction model (°) | Error (°) | Dip angle field (°) | Dip angle model (°) | Error (°) | Trace length (m) |
|---|---|---|---|---|---|---|---|
| F09 | 100.0 | 98.4 | 1.6 | 85.0 | 82.8 | 2.2 | 4.40 |
| F15 | 102.0 | 103.0 | 1.0 | 78.0 | 79.5 | 1.5 | 4.20 |
| F18 | 272.0 | 272.3 | 0.3 | 77.0 | 83.4 | 6.4 | 6.10 |
| F37 | 102.0 | 100.4 | 1.6 | 84.0 | 83.2 | 0.8 | 8.40 |
| F41 | 104.0 | 101.8 | 2.2 | 86.0 | 86.7 | 0.7 | 8.20 |
| F47 | 285.0 | 283.3 | 1.7 | 74.0 | 73.1 | 0.9 | 16.00 |
| F51 | 98.0 | 100.8 | 2.8 | 85.0 | 85.8 | 0.8 | 15.90 |
| F75 | 171.0 | 167.1 | 3.9 | 63.0 | 62.0 | 1.0 | 31.62 |
The mean absolute error for dip direction across all 58 measured fractures is 5.0°, while the mean absolute error for dip angle is 8.2°. These values indicate that the model-interpreted orientations are in good agreement with the field measurements, with the dip direction being slightly more accurate than the dip angle. The dip angle error shows a tendency for the model to underestimate the dip angle for some fractures, particularly those with steep dips in the field (greater than 80°). This systematic bias is investigated further in the discussion section.
We also analyzed the relationship between the accuracy of the dip angle measurement and the trace length of the fracture. The observed trend is significant. For fractures with short trace lengths (less than 5 meters), the mean absolute error in dip angle is 11.9°. For fractures with trace lengths between 5 and 10 meters, the mean error decreases to 7.8°. For fractures with trace lengths between 10 and 15 meters, the mean error is 6.3°. For fractures with trace lengths greater than 15 meters, the mean error is only 5.5°. This clear trend demonstrates that longer fractures, which generally have more extensive surface exposure and more pronounced topographic expression, can be measured with higher accuracy using drone technology.
To further quantify this relationship, we performed a simple linear regression analysis between the trace length and the absolute error in dip angle. The result is expressed by the following equation:
$$ E_{dip} = \alpha – \beta \cdot \ln(L) $$
where \(E_{dip}\) is the absolute error in dip angle in degrees, \(L\) is the trace length in meters, and \(\alpha\) and \(\beta\) are regression coefficients. For our dataset, the estimated values are \(\alpha = 22.4\) and \(\beta = 5.8\), with a correlation coefficient of \(R^2 = 0.72\), indicating a strong negative logarithmic relationship. This equation can be used to estimate the expected accuracy of dip angle measurements for fractures of different trace lengths, providing a valuable planning tool for future drone-based fracture surveys.
Table 4 summarizes the statistical analysis of the error in fracture orientation parameters as a function of trace length.
| Trace length range (m) | Number of fractures | Mean error in dip direction (°) | Mean error in dip angle (°) | Standard deviation of dip angle error (°) |
|---|---|---|---|---|
| L ≤ 5 | 17 | 4.8 | 11.9 | 8.1 |
| 5 < L ≤ 10 | 16 | 3.8 | 7.8 | 5.9 |
| 10 < L ≤ 15 | 12 | 5.8 | 6.3 | 4.7 |
| L > 15 | 13 | 4.2 | 5.5 | 3.8 |
Discussion
The results of our study demonstrate that drone technology, when combined with SfM photogrammetry, provides a highly effective means for characterizing structural fractures in bedrock-exposed terrains. The accuracy of the extracted fracture parameters, particularly the dip direction and dip angle, is sufficient for most engineering and hydrogeological applications. The mean absolute errors of 5.0° for dip direction and 8.2° for dip angle are within the range of variability typically observed in manual measurements due to operator bias and natural fracture surface roughness.
However, we observed a systematic tendency for the model to underestimate the dip angle of steeply dipping fractures. This bias is likely due to a combination of factors related to the geometry of the fracture surfaces and the limitations of the photogrammetric reconstruction. We have identified two primary mechanisms that contribute to this phenomenon: the influence of fracture trace length and the effect of surface weathering.
Influence of Fracture Trace Length
Our analysis reveals a strong and statistically significant correlation between the accuracy of dip angle measurements and the trace length of the fracture. Fractures with longer trace lengths consistently yield more accurate dip angle estimates. This relationship can be explained by considering the geometry of the fracture plane and its intersection with the ground surface. A fracture with a long trace length typically has a more extensive exposure of its surface, allowing the digitization of more points along its trace. With more points, the best-fit plane calculated by the software is better constrained and less susceptible to errors caused by local irregularities in the surface topography.
In contrast, fractures with short trace lengths often have limited surface exposure. The trace may be only partially exposed, or it may be confined to a small area where the local topography is dominated by the shape of the ground surface rather than the orientation of the fracture plane itself. In such cases, the digitized points along the trace are closely spaced and may not capture the true orientation of the fracture. The software may then fit a plane that is influenced more by the local ground surface slope than by the actual fracture orientation, leading to significant errors in both dip direction and dip angle.
Effect of Weathering and Surface Processes
The study area is located in a hyper-arid environment characterized by strong winds, temperature extremes, and intermittent rainfall. These conditions promote intense physical and chemical weathering of the exposed rock surfaces. The granite in the area shows widespread evidence of granular disintegration, exfoliation, and the formation of weathering pits and rills. These weathering processes can significantly modify the original geometry of fracture surfaces, rounding sharp edges and creating irregular, undulating surfaces.
When a fracture surface has been substantially modified by weathering, the assumption that the trace represents the intersection of a planar fracture with the ground surface becomes less valid. The trace may wander due to the irregular weathering of the fracture edges, leading to an incorrect interpretation of the fracture orientation. In some cases, the fracture surface may be completely masked by weathering products or covered by a veneer of loose debris, making it difficult to identify the trace at all.
The combination of short trace lengths and advanced weathering is particularly problematic. Short fractures are often more susceptible to weathering because they have a higher surface-area-to-volume ratio and may be more easily eroded. In our study, we observed that many of the short trace length fractures with large dip angle errors were located in areas where the rock surface showed significant weathering.
Implications for Drone-Based Fracture Surveys
Despite the limitations we have identified, our study confirms that drone technology is a valuable and reliable tool for structural fracture characterization in bedrock terrains. The key to maximizing the accuracy of the results lies in careful survey design and data interpretation. Based on our findings, we make the following recommendations for future applications of drone technology in fracture mapping:
First, flight planning should prioritize achieving high image overlap and low ground sampling distance, especially in areas where small fractures are of interest. The image resolution and overlap directly control the quality of the dense point cloud and the ability to resolve fine-scale features.
Second, ground control points should be deployed whenever possible to improve the absolute accuracy of the model. While the direct georeferencing from the drone’s GNSS may be sufficient for relative measurements, the inclusion of GCPs can significantly reduce systematic errors and improve the overall model accuracy.
Third, the interpretation of fracture parameters from the model should be performed with an understanding of the limitations related to trace length and weathering. Short fractures with trace lengths less than 5 meters should be interpreted with caution, and their orientation data should be flagged as having lower reliability. For fractures with trace lengths greater than 15 meters, the model-interpreted orientations are highly reliable.
Fourth, the integration of drone-based photogrammetry with other complementary techniques, such as terrestrial laser scanning or ground-penetrating radar, could provide a more complete and robust characterization of the fracture network. Each technique has its strengths and weaknesses, and their combined use can overcome the limitations of any single method.
Comparison with Other Studies
The accuracy of our drone-based fracture measurements is comparable to that reported in other studies using similar technology. For example, previous research on high-slope rock masses using oblique drone photogrammetry has reported mean angular errors of 3-7° for fracture orientation, which is consistent with our findings. Other studies focusing on active tectonic structures have also demonstrated the utility of drone technology for extracting quantitative parameters of structural deformation. Our results contribute to this growing body of evidence that drone-based SfM photogrammetry is a mature and reliable technique for structural geological analysis.
The unique contribution of our study is the systematic analysis of the factors controlling accuracy, particularly the role of fracture trace length. This analysis provides practical guidelines for survey planning and data quality assessment that extend beyond the specific geological context of our study area. The logarithmic relationship we established between trace length and dip angle error can be used as a predictive tool to estimate data quality in future surveys.
Furthermore, we have also quantified the mean absolute error for dip direction. This is an important consideration in the context of drone-based surveys of fractured rock masses. The relatively small error in dip direction indicates that drone technology is well-suited for determining the dominant orientation sets within a fracture network, which is often the primary objective of structural characterization for hydrogeological and geotechnical applications.
Conclusion
In this study, we have successfully demonstrated the application of drone technology integrated with Structure from Motion photogrammetry for the identification and parameter extraction of structural fractures in a bedrock-exposed terrain in Gansu Province, China. Our research provides a robust methodological framework for utilizing drone-based remote sensing in the field of structural geology and rock mechanics, with direct implications for site characterization in high-level radioactive waste disposal projects.
The key conclusions from our work are as follows:
First, drone technology enables the rapid acquisition of high-resolution imagery over large and inaccessible areas, which can be processed to generate high-density three-dimensional point cloud models with sub-decimeter accuracy. The point cloud models provide a detailed and objective representation of the rock surface, from which structural fractures can be identified and their parameters extracted with high precision. The mean absolute error for dip direction is 5.0°, and for dip angle is 8.2°, which are acceptable for most engineering geological applications.
Second, the accuracy of the dip angle measurement is strongly dependent on the trace length of the fracture. We established a significant negative logarithmic relationship between trace length and dip angle error. Fractures with trace lengths greater than 15 meters yield the most accurate results, with a mean dip angle error of 5.5°. Fractures with trace lengths less than 5 meters are less reliable, with a mean dip angle error of 11.9°. This relationship provides a practical guideline for data quality assessment in future drone-based fracture surveys.
Third, the observed systematic underestimation of dip angles for steeply dipping fractures is attributed to a combination of factors, including the limited spatial extent of short traces and the modifying effects of surface weathering. These factors should be considered when interpreting fracture orientations from photogrammetric models. Our analysis of the relationship between trace length and error provides a predictive tool for estimating data quality and can help guide survey planning and data interpretation.
Fourth, the integration of drone technology with traditional field mapping provides a powerful synergistic approach for structural fracture characterization. Drone surveys can efficiently cover large areas and provide comprehensive data on fracture network geometry, while targeted field measurements can verify and calibrate the remote sensing data. This combined approach maximizes the strengths of both methods and provides a more complete and reliable characterization of the fracture system.
Finally, our study validates drone-based photogrammetry as an effective and practical tool for structural fracture characterization in the context of high-level radioactive waste disposal site investigations. The ability to rapidly and accurately map fracture networks over large areas is critical for assessing the long-term safety and performance of a geological repository. The methodology we have developed and tested can be directly applied to other similar geological settings, providing a valuable contribution to the field of engineering geology and rock mechanics.
Future research should focus on further automating the fracture identification and parameter extraction process, developing advanced algorithms that can handle the complex texture and geometry of weathered rock surfaces, and integrating drone-based fracture data with numerical models of groundwater flow and rock mass stability. The continued advancement of drone technology and photogrammetric algorithms promises to further enhance our ability to characterize and understand the complex fracture networks that influence the behavior of rock masses in engineering and environmental applications.