
The safety and stability of power systems rely heavily on efficient and reliable equipment inspection. Unmanned Aerial Vehicle (UAV) cluster technology, with its flexibility and wide-area coverage, has become a core method for intelligent power inspection. However, the widely adopted cloud-centric centralized processing mode faces significant challenges: poor real-time performance, low coordination efficiency, and insufficient reliability, making it difficult to meet the stringent requirements of high-frequency and low-latency inspection for transmission lines and substations.
Edge computing offers a solution by sinking computational power closer to the data source. Existing research has made progress in single-drone task offloading and static path planning, but it is limited by the lack of a real-time decision framework for dynamic cluster coordination and the failure to jointly optimize the spatial distribution of power equipment with edge node resource constraints, resulting in limited practical application effectiveness. To address these limitations, we propose an edge computing-driven cooperative decision model for drone clusters. This model builds a “terminal-edge-cloud” three-layer architecture, enabling local real-time processing of inspection data via edge nodes. We design a reinforcement learning-based dynamic cooperation mechanism that jointly optimizes task assignment and path planning, and we develop a lightweight anomaly detection model, forming a closed loop to provide technical support for intelligent maintenance of power equipment.
I. Edge Cooperative Inspection System Architecture and Model
A. System Overall Architecture Design
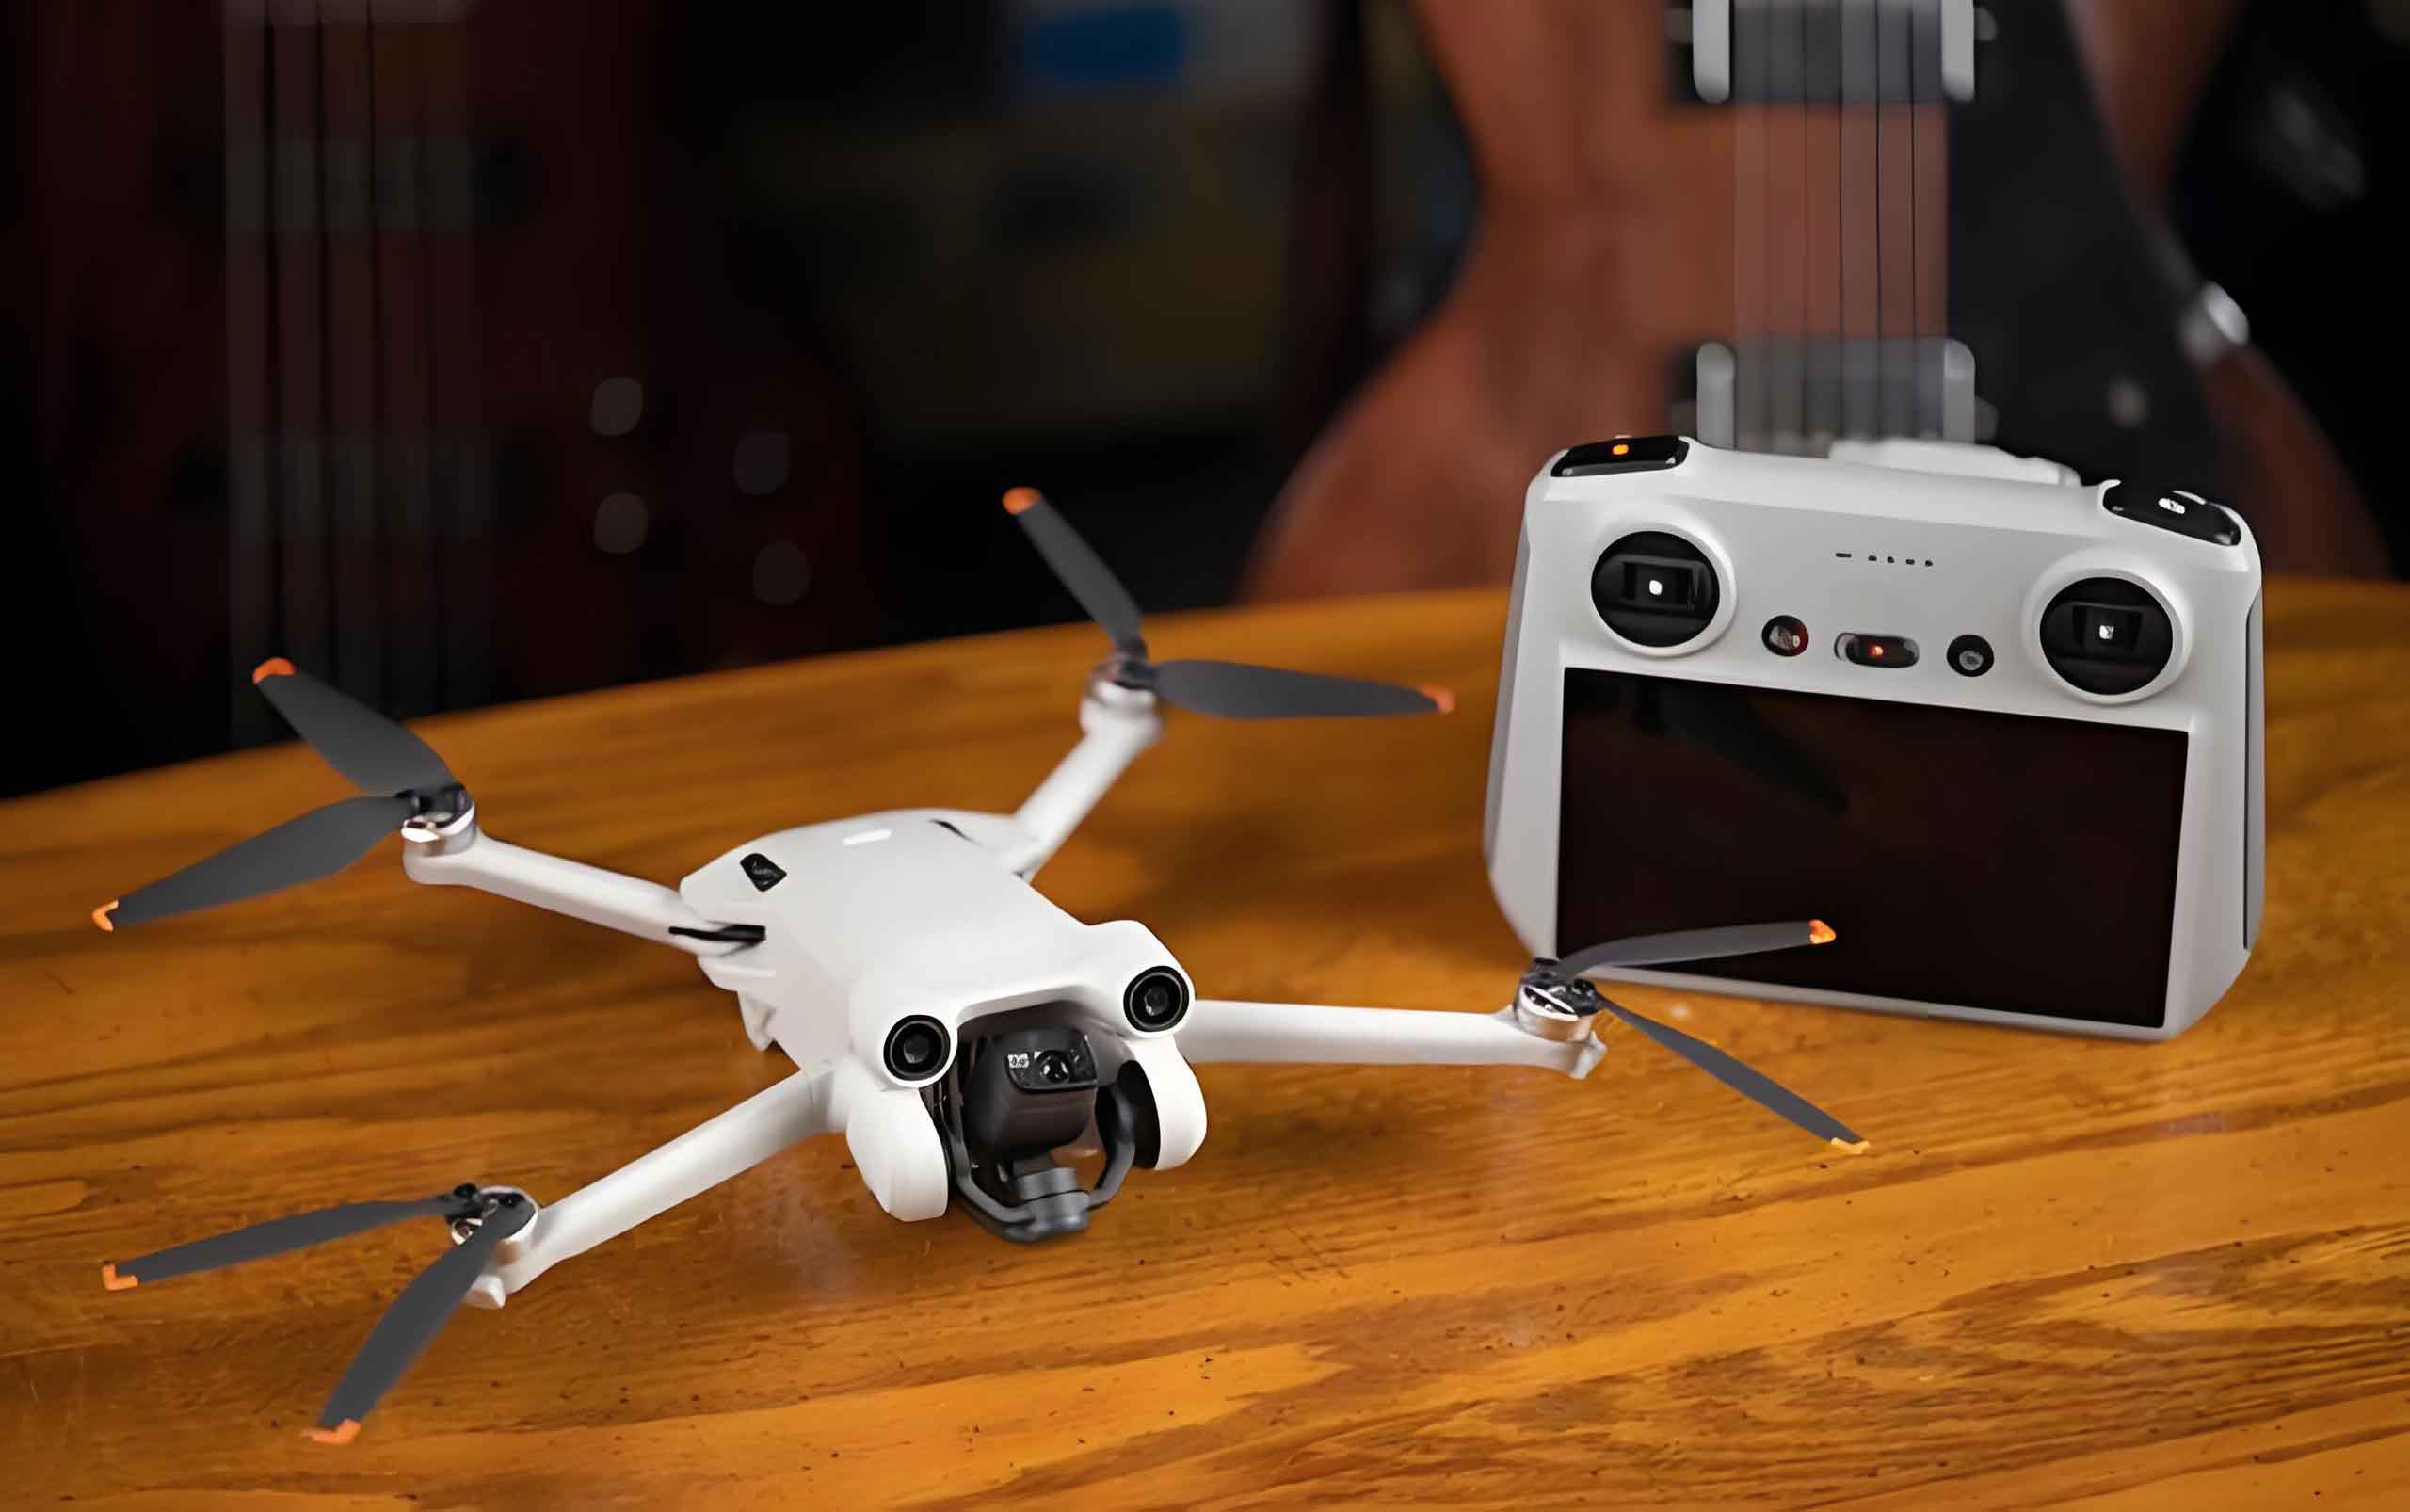
We construct a “terminal-edge-cloud” three-layer cooperative architecture, as illustrated conceptually. The terminal layer consists of the drone swarm that collects data and performs lightweight preprocessing, interacting with the edge layer through 4G/5G links, supporting automatic takeoff, landing, and battery swapping. The edge layer is deployed near power facilities, providing computational power for real-time data analysis, task scheduling, and obstacle avoidance, enabling local closed-loop operations. The cloud layer aggregates data for model training and historical inspection analysis, sending strategies down to the edge layer, forming a cloud-edge synergy.
B. Key Problem Modeling
1) Inspection Task Modeling
Power facilities are widely distributed and complex, requiring precise definition of inspection coverage. Let the set of power facilities to be inspected by the drone cluster be F = {f1, f2, …, fn}, where each facility fi corresponds to geographic coordinates (xi, yi). For a drone uj with maximum flight radius rj, the set of facilities it can cover is given by:
$$
C_j = \left\{ f_i \middle| \sqrt{(x_i – x_{u_j})^2 + (y_i – y_{u_j})^2} \leq r_j \right\}
$$
where (xuj, yuj) is the initial position of drone uj. Priority is assigned to each facility based on its importance and fault risk. Define the priority coefficient set P = {p1, p2, …, pn}, pi ∈ [0,1], with larger values indicating higher priority (e.g., hub substations have higher priority than ordinary transmission lines). For timeliness, each task ti has a latest completion time Tideadline, and the time window from task release Tistart to Tideadline is ΔTi = Tideadline – Tistart. The drone must complete the inspection within this window to ensure system safety.
2) Communication Model
The communication quality between drones and edge nodes directly affects data transmission reliability and real-time performance. Considering channel fading and noise interference, we model the drone–edge node communication link using a Rayleigh fading channel. The channel gain hjk between drone uj and edge node ek follows a Rayleigh distribution with zero mean and variance σ²jk, i.e., hjk ~ CN(0, σ²jk). The signal-to-noise ratio (SNR) of the link is:
$$
\text{SNR}_{jk} = \frac{P_{jk} |h_{jk}|^2}{N_0 B}
$$
where Pjk is the transmission power of drone uj to edge node ek, N0 is the noise power spectral density, and B is the channel bandwidth. The data rate is Rjk = B log2(1 + SNRjk), which is used to evaluate link stability under different environmental conditions and to inform task allocation and data transmission strategies.
3) Computational Resource Model
Edge nodes have limited computational resources that must be dynamically allocated to tasks of varying complexity. Let the total computational resource of edge node ek be Cktotal, measured in million instructions per second (MIPs). For a task ti requiring Ctaski resources (including image processing and feature extraction), the edge node considers its currently used resource Ckused and remaining resource Ckremain = Cktotal – Ckused. Combined with task priority and timeliness constraints, the node uses dynamic programming or heuristic algorithms (e.g., greedy algorithm) to allocate computational resources to different drone tasks.
C. Cooperative Decision Framework
Our model adopts a hierarchical cooperation mechanism. The edge layer responds to sudden tasks at millisecond level based on local information such as drone status, scheduling drones in a closed loop, and reducing communication delay. The cloud layer analyzes global data, trains models, and optimizes strategies, then delivers them to the edge layer to improve overall efficiency.
The core objective of cooperative decision-making is to minimize task execution delay and cluster energy consumption while satisfying inspection coverage and timeliness constraints. The optimization objective function is defined as:
$$
\min F = \alpha \cdot T_{\text{task}} – \gamma \cdot \text{Coverage}_{\text{rate}}
$$
where Ttask is the average task completion delay, Coveragerate is the inspection coverage of critical facilities, and α and γ are weight coefficients set according to actual scenario requirements. This function guides the edge layer in task allocation, path planning, and resource scheduling, balancing real-time performance, energy efficiency, and coverage completeness.
II. Cluster Cooperative Decision Algorithm Design
A. Dynamic Task Allocation Based on Improved Q-Learning
To optimize task allocation efficiency for drone clusters in edge computing environments, we design an improved Q-learning algorithm. The state space includes three elements: drone real-time position (coordinates), remaining battery level (percentage), and the computational load of the associated edge node (CPU utilization). The action space is defined as a binary decision: accept or reject a new task, and for accepted tasks, select the optimal edge node based on communication quality and resource surplus. The reward function adopts a multi-objective weighted form R:
$$
R = \omega_1 \cdot (\text{task completion reward}) – \omega_2 \cdot (\text{delay penalty})
$$
where ω1 is the weight coefficient for task completion reward, positively correlated with facility priority, and ω2 is the weight coefficient for delay penalty, which includes data transmission time and node queuing delay. The algorithm dynamically adjusts the action selection strategy to maximize long-term cumulative reward under resource constraints, achieving low-latency, high-priority cooperative task allocation.
B. Joint Path Planning and Obstacle Avoidance Mechanism
For real-time path optimization and sudden obstacle avoidance in dynamic inspection environments, we propose a method combining an improved A* algorithm with the artificial potential field method. In the path planning stage, the improved A* algorithm generates a global optimal path based on facility coordinates and drone status. The heuristic function introduces facility priority weights and remaining battery factors to ensure critical tasks are executed first. During dynamic obstacle avoidance, the artificial potential field method corrects the path in real time: obstacles are modeled as repulsive sources and target facilities as attractive sources, producing collision-free trajectories. The edge node dominates cooperative obstacle avoidance: drones upload obstacle information to the edge layer; the edge node uses a pre-trained reinforcement learning obstacle avoidance model (input: obstacle position/speed and drone attitude; output: yaw/speed commands) to generate instructions within 50ms and update the cluster path, achieving centimeter-level real-time obstacle avoidance. This edge-assisted mechanism reduces cloud interaction delay, ensuring inspection continuity in complex environments.
C. Lightweight Anomaly Detection Model
We design a lightweight detection network based on YOLO-MobileNetV3. It uses the MobileNetV3 backbone with depthwise separable convolutions to reduce parameters, integrates channel attention mechanisms, and is distilled to a model size of 12.3 MB. It processes images at 35 fps on edge nodes. Detection results are pushed in real time, and high-risk defects trigger dynamic task adjustments, keeping the “detection–response” latency below 500 ms.
III. Experimental Verification and Result Analysis
A. Experimental Environment Setup
We built a simulation environment using Gazebo 11.0 and ROS Noetic, replicating a 50-km transmission line and substation with dynamic obstacles and defect targets. The hardware included 6 Inspire 2 drones, NVIDIA Jetson TX2 edge nodes, and an Alibaba Cloud instance. We compared our model against a traditional cloud-only processing approach and a non-cooperative scheme. The test dataset contained 12,800 samples, and wind disturbances of levels 4–6 were introduced.
B. Performance Evaluation Metrics and Results
We evaluated performance using the following core metrics:
1) Average Task Delay
This is the mean time from task release to completion, reflecting system real-time performance. Our scheme maintained an average delay below 0.85 s across different numbers of edge nodes, and it continued to improve as nodes increased. In contrast, the cloud-only scheme had delays above 1.2 s, and the non-cooperative scheme had the highest delays. The results are summarized in the table below.
| Edge Nodes | Proposed Scheme | Cloud-Only | Non-Cooperative |
|---|---|---|---|
| 1 | 0.85 | 1.25 | 1.83 |
| 2 | 0.82 | 1.23 | 1.78 |
| 3 | 0.80 | 1.22 | 1.75 |
| 4 | 0.78 | 1.21 | 1.72 |
| 5 | 0.76 | 1.20 | 1.70 |
2) Emergency Task Response Success Rate
This measures the proportion of urgent tasks completed within their time windows. Our scheme achieved a success rate greater than 95% and continued to improve with more edge nodes. The cloud-only scheme’s success rate declined as nodes increased due to higher communication overhead, while the non-cooperative scheme had the lowest success rate. The data are shown in the table below.
| Edge Nodes | Proposed Scheme | Cloud-Only | Non-Cooperative |
|---|---|---|---|
| 1 | 95.2 | 90.1 | 82.4 |
| 2 | 96.5 | 89.3 | 83.1 |
| 3 | 97.1 | 88.5 | 83.8 |
| 4 | 97.8 | 87.7 | 84.2 |
| 5 | 98.3 | 86.9 | 84.5 |
C. Parameter Sensitivity Analysis
1) Impact of Number of Edge Nodes
We tested the effect of 1 to 10 edge nodes on system performance. The number of nodes is positively correlated with task processing efficiency, but with diminishing marginal returns. From 1 to 5 nodes, task delay decreased by 8.2% and emergency task success rate increased by 3.1%. Beyond 5 nodes, performance improvement slowed due to coverage overlap. For a 50-km transmission line, deploying 5–6 nodes is the most cost-effective configuration.
| Edge Nodes | Avg Delay (s) | Emergency Success Rate (%) |
|---|---|---|
| 1 | 0.85 | 95.2 |
| 2 | 0.82 | 96.5 |
| 3 | 0.80 | 97.1 |
| 4 | 0.78 | 97.8 |
| 5 | 0.76 | 98.3 |
| 6 | 0.75 | 98.5 |
| 7 | 0.74 | 98.6 |
| 8 | 0.74 | 98.7 |
| 9 | 0.73 | 98.7 |
| 10 | 0.73 | 98.8 |
2) Impact of Drone Cluster Size
We evaluated the effect of 3 to 12 drones. Performance exhibited an inverted U-shape. From 3 to 8 drones, inspection coverage increased and delay decreased due to effective multi-drone cooperation. Beyond 8 drones, channel contention and increased coordination overhead degraded performance. Under the edge computing paradigm, deploying around 8 drones achieved maximum cluster effectiveness.
| Drones | Avg Delay (s) | Emergency Success Rate (%) |
|---|---|---|
| 3 | 1.10 | 91.0 |
| 4 | 0.95 | 93.5 |
| 5 | 0.85 | 95.8 |
| 6 | 0.80 | 97.2 |
| 7 | 0.78 | 97.9 |
| 8 | 0.76 | 98.3 |
| 9 | 0.78 | 98.0 |
| 10 | 0.82 | 97.1 |
| 11 | 0.87 | 96.0 |
| 12 | 0.93 | 94.5 |
3) Comprehensive Performance Analysis
By cross-validating the coupling effect of edge node count and cluster size, we found that the system achieved the best balance of delay, efficiency, and energy consumption when edge nodes = 5 and drones = 8. In this configuration, the average task delay was 0.78 s, emergency success rate reached 98.3%, and cluster energy consumption was 41% lower than a single-drone scheme. This combination forms a synergistic optimization of computational resources, communication bandwidth, and execution capability, providing a quantitative basis for equipment configuration in real power inspection scenarios.
IV. Conclusion
We proposed an edge computing-driven drone cluster cooperative decision model for power inspection. By constructing a “terminal-edge-cloud” architecture and integrating reinforcement learning with lightweight models, the method effectively overcomes the limitations of traditional cloud-based processing. Experiments demonstrated significant advantages in task delay and response success rate, and identified optimal configurations for edge nodes and drones. The research provides technical support for intelligent power inspection, improving the efficiency and reliability of power system operation and maintenance. The integration of advanced drone technology with edge computing paves the way for next-generation autonomous inspection systems.