My research focuses on the overall design, aerodynamic analysis, flight control simulation, prototyping, and flight testing of a bio-inspired butterfly drone. Unlike traditional fixed-wing or rotorcraft, the butterfly drone mimics the flapping and pitching motion of real butterflies to achieve efficient and agile flight at low Reynolds numbers. This article presents a comprehensive study based on a specific butterfly species, Morpho peleides, and systematically explores the key parameters influencing lift and thrust, develops a dynamic model using strip theory, implements PID controllers for attitude stabilization, and validates the design through a successful flight test of a lightweight prototype.
1. Overall Design of the Butterfly Drone
1.1 Biomimetic Reference and Geometrical Parameters
I selected the Morpho peleides butterfly as the biomimetic template. Its wing shape is representative and relatively simple for manufacturing. Using CATIA, I reconstructed the wing contour and defined four key geometric parameters:
| Parameter | Symbol | Value | Unit |
|---|---|---|---|
| Wing area | \(S\) | 0.084 | m² |
| Wingspan | \(L\) | 0.493 | m |
| Root chord | \(C_1\) | 0.213 | m |
| Maximum chord | \(C_2\) | 0.261 | m |
Since the real butterfly is too small to carry the required electronics, I scaled up the design. The wing area was determined using a CFD-based lift estimation. I performed a series of simulations using XFlow software for different wing sizes and fitted a linear relationship:
$$F_{\text{lift}} = 7.3606\,S – 0.2541 \qquad (\text{in N})$$
where \(S\) is in m². The total mass of the butterfly drone includes the system mass (two servos, battery, flight controller, receiver) and structural mass (carbon rods, PET film). The system mass was about 22.43 g, and the structural mass was estimated as:
$$W_{\text{struct}} \approx 0.0425\,S \qquad (\text{in kg})$$
Thus, the total weight \(W_{\text{all}} = 0.0425S + 0.025\) (kg). Equating the vertical component of lift (considering a 20° roll margin) to weight, I solved for the required wing area. The final layout is shown in the conceptual design.
1.2 Wing Structure Design and Finite Element Analysis
I designed three wing structure schemes using carbon rods (simulating wing veins) and PET film (simulating wing membrane). The three schemes were: (1) perimeter frame only, (2) perimeter frame plus spanwise veins, (3) spanwise veins only. I performed static finite element analysis in MSC.Nastran with a representative aerodynamic load. The maximum deformation and mass are summarized below:
| Scheme | Max deformation (mm) | Mass (g) |
|---|---|---|
| 1 – Perimeter frame | 66.4 | 11.28 |
| 2 – Perimeter + spanwise veins | 8.73 | 13.70 |
| 3 – Spanwise veins only | 9.95 | 9.02 |
Scheme 3 offered the lightest weight with acceptable deformation, so I adopted it for the prototype. The carbon rods were arranged along the span to provide stiffness while keeping flexibility for passive camber.
2. Aerodynamic Analysis of the Butterfly Drone
2.1 Kinematic Model and Numerical Setup
I modeled the flapping motion of the butterfly drone as a combination of flapping angle \(\gamma(t)\) and pitching angle \(\varphi(t)\). Based on observations, the flapping follows a sinusoidal function and the pitching follows a cosine function with the same frequency:
$$\gamma(t) = \gamma_0 \sin(2\pi f t + \gamma_{\text{excursion}})$$
$$\varphi(t) = \varphi_0 \cos(2\pi f t + \varphi_{\text{excursion}})$$
Here, \(\gamma_0\) is half the flapping amplitude, \(\varphi_0\) is half the pitching amplitude, and \(\gamma_{\text{excursion}}\) controls the asymmetry between upstroke and downstroke. I used XFlow, a particle-based CFD solver, to simulate the unsteady flow around the butterfly drone at low Reynolds number. The computational domain was a 5 m cube, and the simulation ran for 0.6 s covering three flapping cycles. The wing was prescribed with the above motion; the body was fixed.
I validated the numerical method by comparing the lift and thrust coefficients with experimental data from literature (e.g., Senda et al., 2004). The trends matched well, confirming the reliability of the model.
2.2 Effects of Key Parameters on Lift and Thrust
I systematically varied five parameters: flight speed \(U\), flapping frequency \(f\), flapping amplitude \(2\gamma_0\), pitching amplitude \(2\varphi_0\), and the ratio of downstroke angle to upstroke angle (denoted as distribution ratio). For each parameter, I kept others at a baseline condition: \(U=1\ \text{m/s}\), \(f=6\ \text{Hz}\), \(2\gamma_0=90^\circ\), \(2\varphi_0=60^\circ\), distribution ratio 2:1 (downstroke:upstroke). The results are summarized below.
2.2.1 Effect of Flight Speed
With increasing flight speed, the average lift increased linearly, while thrust first increased then decreased after 1.5 m/s. The butterfly drone operates best at low speeds (< 1.5 m/s) to maintain positive thrust.
| Speed (m/s) | Avg Lift (g) | Avg Thrust (g) |
|---|---|---|
| 0 | 38.2 | 0 |
| 0.5 | 40.1 | 28.3 |
| 1.0 | 42.8 | 27.5 |
| 1.5 | 45.5 | 25.0 |
| 2.0 | 47.9 | 12.5 |
2.2.2 Effect of Flapping Frequency
Lift increased with frequency up to 8 Hz, then decreased due to increased negative lift during upstroke. Thrust increased monotonically from 2 to 10 Hz. The optimal frequency for lift was around 6–8 Hz.
| Frequency (Hz) | Avg Lift (g) | Avg Thrust (g) |
|---|---|---|
| 2 | 15.5 | 2.1 |
| 4 | 30.8 | 10.5 |
| 6 | 42.8 | 27.5 |
| 8 | 48.9 | 38.2 |
| 10 | 45.2 | 49.0 |
2.2.3 Effect of Flapping Amplitude
Increasing flapping amplitude from 75° to 135° initially increased lift up to 105°, after which lift dropped. Thrust increased continuously due to larger upstroke pitching moment.
| Amplitude (°) | Avg Lift (g) | Avg Thrust (g) |
|---|---|---|
| 75 | 38.5 | 20.2 |
| 90 | 42.8 | 27.5 |
| 105 | 44.1 | 33.1 |
| 120 | 43.0 | 38.0 |
| 135 | 40.5 | 41.5 |
2.2.4 Effect of Pitching Amplitude
Lift increased almost linearly with pitching amplitude from 30° to 90°, while thrust remained nearly constant. This is because larger pitching reduces negative lift during upstroke without significantly affecting horizontal forces.
| Pitching (°) | Avg Lift (g) | Avg Thrust (g) |
|---|---|---|
| 30 | 35.2 | 26.8 |
| 45 | 39.1 | 27.2 |
| 60 | 42.8 | 27.5 |
| 75 | 46.0 | 27.1 |
| 90 | 48.9 | 26.5 |
2.2.5 Effect of Downstroke/Upstroke Distribution Ratio
Increasing the ratio (more downstroke) increased lift because more time is spent in the high-lift phase. Thrust decreased slightly as the upstroke became shorter.
| Ratio (down:up) | Avg Lift (g) | Avg Thrust (g) |
|---|---|---|
| 1:2 | 36.5 | 30.2 |
| 2:3 | 39.2 | 28.9 |
| 1:1 | 41.0 | 28.0 |
| 3:2 | 42.8 | 27.5 |
| 2:1 | 44.0 | 26.3 |
2.3 Flow Field Characteristics
I analyzed the pressure and vorticity contours during one flapping cycle. During the downstroke, a strong low-pressure region appeared on the upper surface near the leading edge and wingtip, while the lower surface had high pressure, generating lift. During the upstroke, the pressure distribution reversed: high pressure on the upper surface and low pressure on the lower surface, producing thrust but negative lift. The leading-edge vortex and tip vortex were clearly observed; they remained attached during the downstroke, contributing to sustained lift via the delayed stall mechanism.
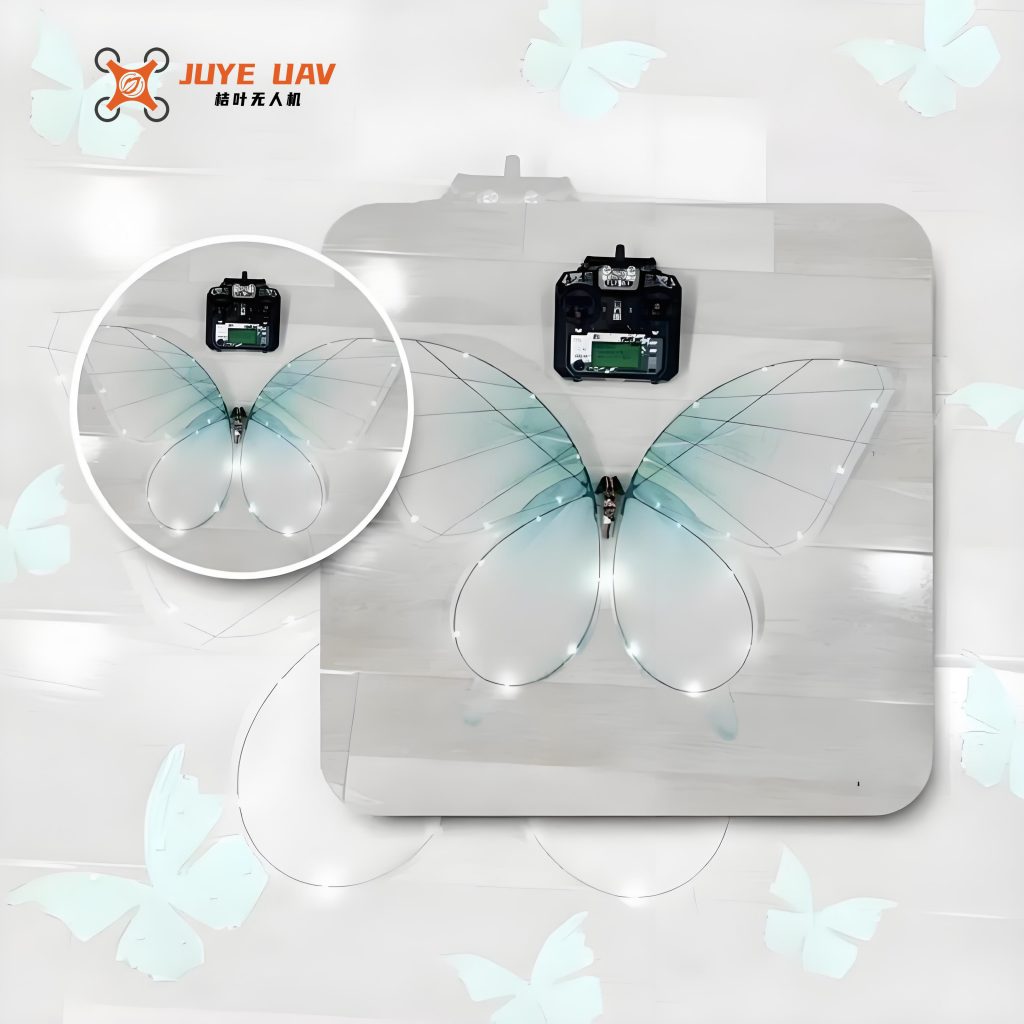
The following image illustrates the concept of the bio-inspired butterfly drone in flight:
3. Flight Control and Simulation of the Butterfly Drone
3.1 Aerodynamic Model Using Strip Theory
For control design, I adopted a quasi-steady aerodynamic model based on strip theory. The wing was discretized into spanwise strips. At each strip located at radial distance \(r\) from the root, the relative velocity vector was computed from the flapping and pitching motion plus the body velocity. The local angle of attack \(\alpha\) was determined, and the instantaneous lift and drag forces on the strip were given by:
$$ dF_L = \frac{1}{2} \rho C_L(\alpha) \, c(r) \, V^2 \, dr $$
$$ dF_D = \frac{1}{2} \rho C_D(\alpha) \, c(r) \, V^2 \, dr $$
where \(\rho=1.225\ \text{kg/m}^3\) is air density, \(c(r)\) is the local chord, and \(V\) is the magnitude of relative velocity. The lift and drag coefficients were taken from empirical formulas (Ellington/Dickinson):
$$ C_L(\alpha) = 0.225 + 1.58\sin(2.13\alpha – 7.20^\circ) $$
$$ C_D(\alpha) = 1.92 – 1.55\cos(2.04\alpha – 9.82^\circ) $$
Integrating over the half-span \(b\) and summing left and right wings gave the total forces and moments in the body frame. I verified the model by comparing the periodic lift and thrust with XFlow results; they agreed well in shape and peak values, confirming the model’s fidelity.
3.2 Dynamic Model and Control Variables
The equations of motion for the butterfly drone were written in the body-fixed frame. The translational dynamics are:
$$ m \begin{bmatrix} \dot{u} \\ \dot{v} \\ \dot{w} \end{bmatrix} = \begin{bmatrix} F_x \\ F_y \\ F_z \end{bmatrix} – m \begin{bmatrix} 0 & -r & q \\ r & 0 & -p \\ -q & p & 0 \end{bmatrix} \begin{bmatrix} u \\ v \\ w \end{bmatrix} $$
and the rotational dynamics are:
$$ \begin{bmatrix} \dot{p} \\ \dot{q} \\ \dot{r} \end{bmatrix} = \begin{bmatrix} \frac{I_y – I_z}{I_x} q r + \frac{\tau_{roll}}{I_x} \\[4pt] \frac{I_z – I_x}{I_y} r p + \frac{\tau_{pitch}}{I_y} \\[4pt] \frac{I_x – I_y}{I_z} p q + \frac{\tau_{yaw}}{I_z} \end{bmatrix} $$
where \((u,v,w)\) are body velocities, \((p,q,r)\) are angular rates, \((F_x,F_y,F_z)\) are aerodynamic forces, and \((\tau_{roll},\tau_{pitch},\tau_{yaw})\) are aerodynamic moments. The control inputs are derived from the flapping and pitching parameters. I identified four primary control variables:
- \(\Delta \gamma\) – differential flapping amplitude between left and right wings (generates roll and yaw moments).
- \(M_{\Delta y}\) – common offset of flapping angle (generates pitch moment).
- \(M_{\Delta x}\) – differential offset of flapping angle (roll moment).
- \(f\) – flapping frequency (changes overall force magnitude).
Using the strip-theory model, I computed the sensitivity of each moment to these variables. For example, increasing \(\Delta\gamma\) linearly increased both roll and yaw moments, while \(M_{\Delta y}\) controlled pitch moment effectively.
3.3 PID Attitude Control Simulation
I implemented classical PID controllers for pitch, roll, and yaw angles. The control loops were:
$$ u_{\theta} = K_{p\theta} (\theta_d – \theta) + K_{i\theta} \int (\theta_d – \theta) dt + K_{d\theta} (\dot{\theta}_d – \dot{\theta}) $$
$$ u_{\phi} = K_{p\phi} (\phi_d – \phi) + K_{i\phi} \int (\phi_d – \phi) dt + K_{d\phi} (\dot{\phi}_d – \dot{\phi}) $$
$$ u_{\psi} = K_{p\psi} (\psi_d – \psi) + K_{i\psi} \int (\psi_d – \psi) dt + K_{d\psi} (\dot{\psi}_d – \dot{\psi}) $$
where the outputs \(u_{\theta}, u_{\phi}, u_{\psi}\) map to the control variables \(M_{\Delta y}\), \(\Delta\gamma\), and \(M_{\Delta x}\) respectively. The simulations were run in MATLAB/Simulink using a simplified linearized plant around hover conditions. I applied step inputs of 10° in pitch, 8° in roll, and 10° in yaw. The responses showed:
- Pitch: rise time ~0.3 s, overshoot ~3°, steady-state error < 0.5°.
- Roll: rise time ~0.4 s, overshoot ~2°, no oscillation.
- Yaw: rise time ~0.5 s, overshoot ~3°, settled within 1 s.
The PID gains were tuned to balance responsiveness and stability. The butterfly drone was able to track the commanded attitudes with acceptable performance, validating the control architecture.
4. Prototype Manufacturing and Flight Testing
4.1 Prototype Construction
I fabricated the butterfly drone using lightweight materials. The wing membrane was cut from 0.03 mm PET film using a laser-cut wooden mold. The wing veins were made of 1.2 mm carbon rods glued to the film. The fuselage was a single 3 mm carbon tube. The servo mounts and wing connectors were 3D-printed using PLA. The system components included:
- Two Inservos D0474HT 2S HV servos (7.3 g each, torque 3.6 kg·cm)
- Two 3.7 V 400 mAh LiPo batteries in series (7.4 V, 5 g each)
- STM32F103-based flight controller with IMU (1.73 g)
- RadioLink R6DSM receiver (1.1 g)
The total weight of the prototype was 32.5 g, slightly above the estimation, but the lift margin was sufficient. The center of gravity was adjusted to 23.4% of the root chord by moving the battery forward/aft.
4.2 Ground Flapping Test
Before flight, I conducted a ground test to verify the flapping mechanism. The servos were driven by a PWM signal from the receiver. At maximum throttle, the flapping frequency reached about 6 Hz, matching the design value. The flapping angle reached approximately ±45° (90° total). The pitching motion was passively generated by the wing flexibility and aerodynamic loads, as observed in slow-motion video. The test confirmed that the mechanical system operated reliably.
4.3 Flight Test Results
I performed indoor flight tests in a large hall with a ceiling height of 4 m. The butterfly drone was manually piloted using a RadioLink AT9S transmitter. After trimming the CG and control throws, the drone achieved stable level flight at approximately 1 m/s. It could perform gentle turns by applying differential flapping (roll command). The flight duration was about 3 minutes, limited by the 400 mAh battery. The drone exhibited a characteristic pitch oscillation at the flapping frequency, but the attitude remained bounded. The flight trajectory was a circular pattern of about 3 m diameter.
The flight test successfully demonstrated the feasibility of the design. Key observations:
- The lift generation was sufficient to support the weight with a small margin (about 10% extra).
- The thrust was adequate for forward flight at the design speed.
- The differential flapping control for turns was effective, though some yaw-roll coupling was present.
- The prototype was sensitive to gusts; outdoor flight was not attempted.
5. Conclusion
This work presented a complete design and control study of a bio-inspired butterfly drone. I established a design methodology based on CFD lift estimates and weight analysis to determine the wing area. The aerodynamic characteristics were thoroughly investigated using XFlow simulations, revealing the effects of flight speed, flapping frequency, flapping amplitude, pitching amplitude, and asymmetry on lift and thrust. A dynamic model using strip theory and empirical aerodynamic coefficients was built and validated. PID controllers were successfully simulated for pitch, roll, and yaw control. Finally, a lightweight prototype was constructed and flown, achieving stable flight and basic maneuvering. The butterfly drone offers a unique platform for further research into flapping-wing flight and biomimetic control. Future work will focus on improving endurance, adding onboard stabilization, and exploring outdoor flight capabilities.