
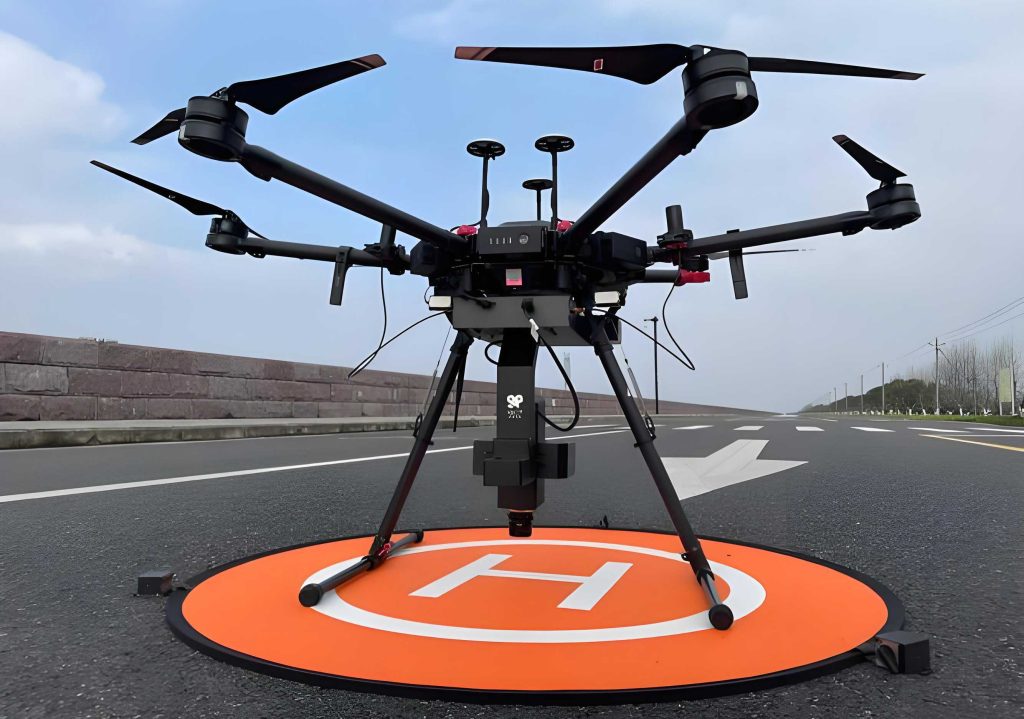
In the context of deep integration between aerospace technology and artificial intelligence, unmanned drones have become core equipment driving efficiency innovations in both military and civilian fields. The stable performance of unmanned drones heavily relies on the core power component—the engine, whose operational status directly determines mission reliability and flight safety. As the “heart” of an unmanned drone, the engine must endure long-term extreme and complex working conditions: high-altitude low-pressure environments can easily cause combustion chamber efficiency fluctuations, strong airflow impacts exacerbate blade fatigue damage, and corrosive media in the air can trigger oxidation corrosion of key components. According to statistical reports, engine failures account for a significant proportion of total unmanned drone failures, often leading to crashes and mission interruptions, posing threats to public safety. Traditional fault diagnosis methods, such as physical model-based approaches or classical machine learning techniques, exhibit limitations in handling the complex temporal dynamics and early warning requirements for unmanned drone engines. Therefore, in this study, I propose a fault risk prediction model based on a Long Short-Term Memory (LSTM) network integrated with an attention mechanism, aiming to achieve early identification and quantitative risk assessment for unmanned drone engine faults.
The operational data of turbofan engines from a domestic unmanned drone enterprise serves as the foundation for this research. The dataset includes multiple groups of full-lifecycle engine run data, covering normal and fault conditions, with key parameters such as engine speed, exhaust temperature, oil pressure, cylinder head temperature, and fuel flow. To ensure data quality, I perform preprocessing from three aspects: stationarity verification, correlation screening, and outlier handling. For stationarity, wavelet analysis is employed to handle non-stationary signals. Given that monitoring signals for unmanned drone engine parameters often exhibit non-stationary and non-linear characteristics, traditional Fourier transform lacks time-frequency localization capability. Wavelet analysis overcomes this by using scalable and translatable basis functions for multi-scale refinement. For an original time-series signal $S(t)$, a db5 wavelet is used for $J=5$ layers of decomposition, obtaining a set of wavelet coefficients, including one low-frequency approximation coefficient $CA_5$ and five high-frequency detail coefficients $CD_1, CD_2, …, CD_5$:
$$S(t) = CA_5 + \sum_{j=1}^{5} CD_j$$
Threshold denoising, specifically the unbiased risk estimation threshold (rigrsure) combined with a soft threshold function, is applied to the detail coefficients to suppress noise while preserving edge features. After denoising, energy features are extracted from the reconstructed sub-signals to build a dimensionality-reduced feature vector. The energy $E_j$ for the $j$-th layer is calculated as:
$$E_j = \|CD_j\|^2 = \sum_{k=1}^{N} |cd_{j,k}|^2$$
where $cd_{j,k}$ is the $k$-th point of the $j$-th layer detail coefficient. Under different fault modes, the distribution of signal energy across frequency bands changes significantly, forming highly discriminative feature vectors for subsequent deep learning models.
For correlation screening, Pearson correlation analysis is used to select key feature variables related to cylinder head temperature, which is the core monitoring indicator for engine health. The Pearson correlation coefficient $r$ between two variables $X$ and $Y$ with sample data $\{x_1, x_2, …, x_n\}$ and $\{y_1, y_2, …, y_n\}$ is calculated as:
$$r = \frac{\sum_{i=1}^{n} (x_i – \bar{x})(y_i – \bar{y})}{\sqrt{\sum_{i=1}^{n} (x_i – \bar{x})^2 \sum_{i=1}^{n} (y_i – \bar{y})^2}}$$
where $\bar{x}$ and $\bar{y}$ are the sample means. Based on this, a correlation threshold of $|r| \geq 0.70$ (significance level $\alpha = 0.01$) is set to filter key features. The screening results and physical significance are summarized in Table 1.
| No. | Feature Variable | Pearson Correlation Coefficient | Physical Significance | Fault Indication |
|---|---|---|---|---|
| 1 | Airbox Temperature | 0.798 | Reflects thermal state of intake system; strong positive correlation with cylinder head temperature. | Abnormal increase indicates intake system overheating, potentially leading to chain rise in cylinder head temperature. |
| 2 | Airbox Pressure | 0.783 | Indicates intake density and flow; pressure rise increases combustion heat release, affecting cylinder head temperature via heat conduction. | Abnormal fluctuations suggest intake system blockage or leakage, indirectly causing cylinder head temperature loss of control. |
| 3 | Oil Temperature | 0.754 | Represents thermal state of lubrication system; oil undertakes cylinder head cooling, temperature rise reflects decreased cooling efficiency. | Excessive oil temperature indicates lubrication failure, insufficient cylinder head cooling, signaling overheating fault risk. |
| 4 | Oil Pressure | 0.748 | Indicates working state of lubrication system; pressure drop reduces lubrication flow, decreasing cylinder head cooling capacity. | Insufficient oil pressure directly triggers lubrication failure chain reaction, indirectly causing cylinder head overheating damage. |
| 5 | Oil Temperature (quadratic term) | 0.586→0.75* | Constructed via polynomial feature engineering to enhance non-linear thermal accumulation effect representation. | Captures higher-order trends in oil temperature, identifying slow thermal degradation faults. |
*Note: The original correlation coefficient for oil temperature is 0.586; through polynomial feature construction ($x^2$), it is enhanced to 0.75 and included in the key feature set.
For outlier handling, a composite method combining the $3\sigma$ principle and the Interquartile Range (IQR) is applied. For a feature like cylinder head temperature $T$ assumed to follow a normal distribution $N(\mu, \sigma^2)$, the normal range is $\mu – 3\sigma \leq T \leq \mu + 3\sigma$, with values outside considered outliers. Additionally, the IQR method calculates the first quartile $Q_1$ (25th percentile) and third quartile $Q_3$ (75th percentile), with $IQR = Q_3 – Q_1$. Data points less than $Q_1 – 1.5 \times IQR$ or greater than $Q_3 + 1.5 \times IQR$ are identified as outliers. This ensures precise cleansing of abnormal data, which is crucial for reliable model training for unmanned drone engines.
The dataset is split into training and testing sets using stratified down-sampling to avoid overfitting. The data samples are summarized in Table 2.
| Group | Data Volume | Normal Data | Abnormal Data | Percentage (%) |
|---|---|---|---|---|
| 1 | 2000 | 1630 | 370 | 20.22 |
| 2 | 1500 | 1320 | 180 | 12.00 |
| 3 | 1020 | 920 | 100 | 9.80 |
| 4 | 1800 | 1600 | 200 | 11.11 |
| 5 | 1500 | 1290 | 210 | 14.00 |
| 6 | 1300 | 1230 | 400 | 30.77 |
| 7 | 2300 | 2020 | 280 | 12.17 |
| 8 | 3000 | 2600 | 400 | 13.33 |
| 9 | 1400 | 1230 | 170 | 12.14 |
| 10 | 1180 | 1000 | 180 | 15.25 |
Overall, the total dataset contains 17,000 records, with 13,370 (80%) for training and 3,343 (20%) for testing, ensuring consistent fault distribution between sets. The input feature variables are denoted as $X = [x_1, x_2, x_3, x_4, x_5]$, corresponding to the five key features from Table 1, and the target variable is cylinder head temperature $y$.
The core of this study is the construction of a fault risk prediction model based on an LSTM network integrated with an attention mechanism. The model architecture includes an input layer, LSTM feature extraction layer, attention mechanism layer, and fully connected output layer. Compared to traditional LSTM or Gated Recurrent Unit (GRU) models, this approach introduces a dynamic attention mechanism that allocates weights to time steps, enhancing focus on fault-sensitive periods—a critical need for unmanned drone real-time预警. The attention mechanism calculates attention scores $e_t$ for each time step $t$ in the input sequence $X = [x_1, x_2, …, x_T]$, where $T$ is the total number of time steps. Using dot-product attention as an example:
$$e_t = q^T k_t$$
Here, $q$ is the query vector representing the model’s current focus, and $k_t$ is the key vector for the $t$-th time step. The attention weights $\alpha_t$ are obtained via Softmax normalization:
$$\alpha_t = \frac{\exp(e_t)}{\sum_{t=1}^{T} \exp(e_t)}$$
These weights, ranging from 0 to 1 with $\sum_{t=1}^{T} \alpha_t = 1$, indicate the importance of each time step. A context vector $c$ is then computed as a weighted sum:
$$c = \sum_{t=1}^{T} \alpha_t x_t$$
This context vector integrates information from different time steps, emphasizing key features. For the LSTM component, it controls information flow through input, forget, and output gates, effectively capturing long-term dependencies in unmanned drone engine time-series data. The model is designed to provide a 30-minute early warning using a “historical time window → future sequence prediction” pattern. After comparing window sizes and prediction steps, an optimal window of 60 minutes and prediction step of 30 minutes is determined. The model rolls through sliding windows, each with a $60 \times 5$ input feature matrix and a $30 \times 1$ output temperature sequence. The maximum value of the future 30-minute temperature sequence is used as the fault judgment基准, but further refined using a three-dimensional risk feature vector for correction.
The risk assessment流程 incorporates fault等级划分 based on the severity of consequences, with等级 ranging from three to five (higher表示更严重). The risk factor $R$ for a fault mode is calculated as:
$$R = P \times S$$
where $P$ is the occurrence probability of the fault mode derived from historical data, and $S$ is the severity coefficient (3 for level three, 4 for level four, 5 for level five). To map predicted cylinder head temperature values to risk levels, thresholds are defined using the $3\sigma$ principle, with normal mean $\mu = 410^\circ$C and standard deviation $\sigma = 10^\circ$C. The threshold of $440^\circ$C corresponds to $\mu + 3\sigma$, serving as the baseline for temperature anomaly detection. The mapping rules are as follows: normal range: $y \in [380, 440]^\circ$C, no risk; level three risk: $440^\circ$C < $y \leq 460^\circ$C, with risk factor $R = 3 \times P$ (where $P$ ranges 0.3–0.5 based on historical data); level four risk: $460^\circ$C < $y \leq 480^\circ$C, $R = 4 \times P$ ($P$ ranges 0.5–0.8); level five risk: $y > 480^\circ$C, $R = 5 \times P$ ($P > 0.8$). The probability $P$ is estimated using kernel density estimation (KDE) and maximum likelihood estimation based on past fault cases, and dynamically updated with Bayesian methods using real-time operational data.
To enhance prediction robustness, a three-dimensional risk feature vector is constructed for修正 the maximum value基准. First, the temperature rise slope feature computes the average warming rate $k$ between the first and last 10 minutes of the predicted sequence: $k = \frac{T_{t+10} – T_t}{10}$ (in $^\circ$C/min). If $k > 2^\circ$C/min, the risk level is increased by one; if $0 < k < 0.5^\circ$C/min, it is decreased by one; if $k < 0$, the level is maintained but marked as “trend alleviation.” Second, the sustained over-threshold time feature统计 the duration $t_{over}$ where temperature exceeds $440^\circ$C in the predicted sequence: if $t_{over} > 15$ minutes, risk level increases by one; if $5 < t_{over} < 15$ minutes, current level is maintained; if $t_{over} < 5$ minutes, marked as瞬时波动 and level decreases by one. Third, the temperature fluctuation amplitude feature calculates the standard deviation $\sigma_T$ of the sequence: if $\sigma_T > 10^\circ$C, a “system instability” warning is triggered and risk level increases by one; if $\sigma_T < 3^\circ$C, the level is determined based on the maximum value基准. The comprehensive risk level $R_{final}$ is computed as:
$$R_{final} = \text{Clip}(R_{base} + \Delta R_{slope} + \Delta R_{time} + \Delta R_{vol}, 3, 5)$$
where $R_{base}$ is the基准 risk level based on the maximum temperature, $\Delta R$ are修正 amounts (values -1, 0, or +1), and the Clip function restricts the result to levels 3–5.
Furthermore, the model is integrated with an expert system to address limitations of relying solely on cylinder head temperature and to improve decision reliability. The fusion follows a three-level logic: model prediction → rule verification → decision output. The expert system, built on a knowledge库 with quantified rules and Boolean logic covering 12 fault types (e.g., fuel nozzle clogging, lubrication failure), uses real-time parameters like atmospheric pressure, oil temperature, and speed to verify and修正 risk levels. For instance, the cylinder head temperature threshold is dynamically adjusted based on oil temperature: if oil temperature > $120^\circ$C, the threshold is lowered by 5% to increase fault detection sensitivity; if oil temperature < $80^\circ$C, the threshold is raised by 3% to reduce false alarms. This integration enables precise fault localization and risk dynamic修正, providing technical support for maintenance decisions such as shortening inspections (level three), immediate return (level four), or emergency landing (level five) for unmanned drones.
To validate the model’s effectiveness, experiments are conducted comparing the proposed LSTM-attention model with traditional LSTM, GRU, and XGBoost models. Evaluation metrics include Mean Squared Error (MSE), Mean Absolute Error (MAE), and prediction accuracy based on the risk level mapping rules. The prediction accuracy is calculated as the percentage of correct risk level classifications on the test set. The performance comparison on the cylinder head temperature test set is shown in Table 3.
| Model | MSE | MAE | Prediction Accuracy (%) |
|---|---|---|---|
| LSTM Model | 3.8 | 2.9 | 83.6 |
| XGBoost Model | 4.3 | 3.1 | 78.9 |
| GRU Model | 3.5 | 2.7 | 85.2 |
| LSTM-Attention Model | 2.3 | 1.8 | 92.3 |
The results demonstrate that the proposed LSTM-attention model significantly outperforms the对比 models across all accuracy metrics. Specifically, MSE is reduced by 34.3% compared to GRU, MAE by 33.3%, and prediction accuracy reaches 92.3%, which is 8.7% higher than traditional LSTM. This indicates that the attention mechanism effectively focuses on fault-sensitive time-step features, addressing the “averaging处理” defect of traditional LSTM and improving prediction precision for cylinder head temperature in unmanned drone engines. Through long-term testing on engine test beds, the integration of model prediction, rule-based rapid diagnosis, and expert system assistance has reduced the annual frequency of core component failures from 8–9 times to 2–3 times, significantly lowering maintenance and loss costs for unmanned drone operations.
In conclusion, this study addresses the滞后 of fault warning and insufficient accuracy of traditional prediction models for unmanned drone engines by proposing an LSTM-based fault risk prediction model integrated with an attention mechanism. Through wavelet analysis, filtering, and composite outlier handling for data preprocessing, a two-layer feature extraction architecture of “LSTM-attention” is constructed, achieving accurate prediction of cylinder head temperature and early fault warning. Experimental results show that the model achieves a prediction accuracy of 92.3% on the test set, with RMSE reduced to $2.3^\circ$C, significantly outperforming对比 models. The research outcomes provide technical support for predictive maintenance of unmanned drone engines, offering practical value in reducing equipment operational costs and enhancing flight safety redundancy. However, limitations exist, such as the need for improved model generalization across different unmanned drone engine models and fault types, enhanced sensor robustness against data loss or deviations, and optimization of model real-time performance for deployment on edge devices. Future work will expand training data to cover more unmanned drone engine variants and fault types, introduce data completion and abnormal sensor identification modules, and apply techniques like model quantization and pruning to reduce computational complexity, meeting the real-time requirements of edge computing for unmanned drones.
The continuous advancement of deep learning techniques offers promising avenues for further improving fault risk prediction in unmanned drone engines. For instance, incorporating reinforcement learning for adaptive threshold adjustment or using generative adversarial networks for synthetic data augmentation could enhance model robustness. Additionally, real-time monitoring systems embedded with lightweight versions of the proposed model could enable onboard health management for unmanned drones, reducing reliance on ground stations. As unmanned drones become increasingly prevalent in critical applications, from delivery services to surveillance, ensuring their engine reliability through advanced predictive models will be paramount. This study contributes to that goal by demonstrating the efficacy of attention-enhanced LSTM models in capturing complex temporal patterns and providing actionable risk assessments, ultimately supporting the safe and efficient operation of unmanned drones across various sectors.